| Param | Original file | Final file |
|---|---|---|
| Filename | modeM0/AS1C06_002T01_9000004490_31071cztM0_level2.evt | modeM0/AS1C06_002T01_9000004490_31071cztM0_level2_quad_clean.evt |
| Size (bytes) | 739,054,080 | 136,782,720 |
| Size | 704.8 MB | 130.4 MB |
| Events in quadrant A | 4,247,060 | 895,866 |
| Events in quadrant B | 7,368,277 | 883,265 |
| Events in quadrant C | 4,546,433 | 864,722 |
| Events in quadrant D | 5,582,481 | 844,526 |
| Mode M0 | |||
|---|---|---|---|
| Quadrant | BADHDUFLAG | Total packets | Discarded packets |
| A | 0 | 19063 | 2 |
| B | 0 | 29138 | 2 |
| C | 0 | 19628 | 2 |
| D | 0 | 23208 | 2 |
| Mode M9 | |||
|---|---|---|---|
| Quadrant | BADHDUFLAG | Total packets | Discarded packets |
| A | 0 | 5 | 0 |
| B | 0 | 5 | 0 |
| C | 0 | 5 | 0 |
| D | 0 | 5 | 0 |
| Mode SS | |||
|---|---|---|---|
| Quadrant | BADHDUFLAG | Total packets | Discarded packets |
| A | 0 | 190 | 0 |
| B | 0 | 190 | 0 |
| C | 0 | 190 | 0 |
| D | 0 | 190 | 0 |
| Quadrant | Total seconds | Saturated seconds | Saturation percentage |
|---|---|---|---|
| A | 9436 | 58 | 0.614667% |
| B | 9436 | 238 | 2.522255% |
| C | 9436 | 132 | 1.398898% |
| D | 9436 | 114 | 1.208139% |
Noise dominated data is calculated using 1-second bins in cleaned event files. If a bin has >2000 counts, and if more than 50% of those come from <1% of pixels, then it is considered to be noise-dominated and hence unusable.
| Quadrant | # 1 sec bins | Bins with >0 counts | Bins with >2000 counts | High rate bins dominated by noise | Noise dominated (total time) | Noise dominated (detector-on time) | Marked lightcurve |
|---|---|---|---|---|---|---|---|
| A | 9901 | 9437 | 0 | 0 | 0.00% | 0.00% | 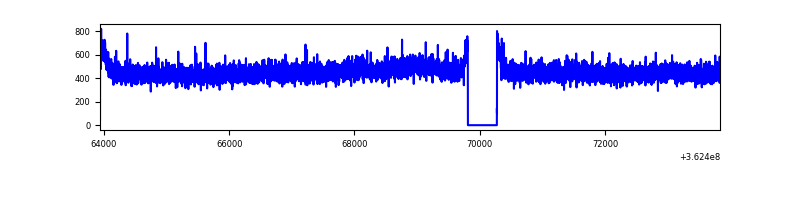 |
| B | 9901 | 9437 | 72 | 72 | 0.73% | 0.76% | 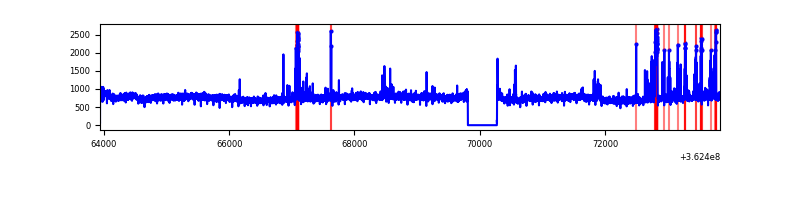 |
| C | 9901 | 9437 | 4 | 4 | 0.04% | 0.04% | 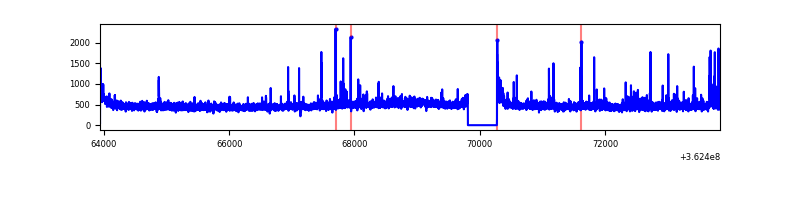 |
| D | 9901 | 9437 | 67 | 67 | 0.68% | 0.71% | 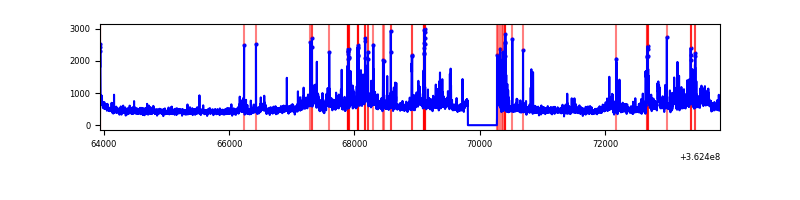 |
Top three noisy pixels from each quadrant. If the there are fewer than three noisy pixels in the level2.evt file, extra rows are filled as -1
| Pixel properties | Quadrant properties | ||||||
|---|---|---|---|---|---|---|---|
| Quadrant | DetID | PixID | Counts | Sigma | Mean | Median | Sigma |
| A | 13 | 254 | 17660 | 74.92 | 1100 | 1076 | 221.4 |
| A | 3 | 137 | 11405 | 46.66 | 1100 | 1076 | 221.4 |
| A | 0 | 226 | 9360 | 37.42 | 1100 | 1076 | 221.4 |
| B | 6 | 159 | 2659626 | 12878.79 | 1083 | 1054 | 206.4 |
| B | 5 | 172 | 284296 | 1372.09 | 1083 | 1054 | 206.4 |
| B | 0 | 190 | 45620 | 215.89 | 1083 | 1054 | 206.4 |
| C | 0 | 10 | 191523 | 771.71 | 1053 | 1055 | 246.8 |
| C | 14 | 238 | 169921 | 684.19 | 1053 | 1055 | 246.8 |
| C | 15 | 208 | 28730 | 112.13 | 1053 | 1055 | 246.8 |
| D | 8 | 195 | 755390 | 3024.94 | 1057 | 1028 | 249.4 |
| D | 1 | 52 | 218937 | 873.8 | 1057 | 1028 | 249.4 |
| D | 13 | 174 | 162492 | 647.46 | 1057 | 1028 | 249.4 |
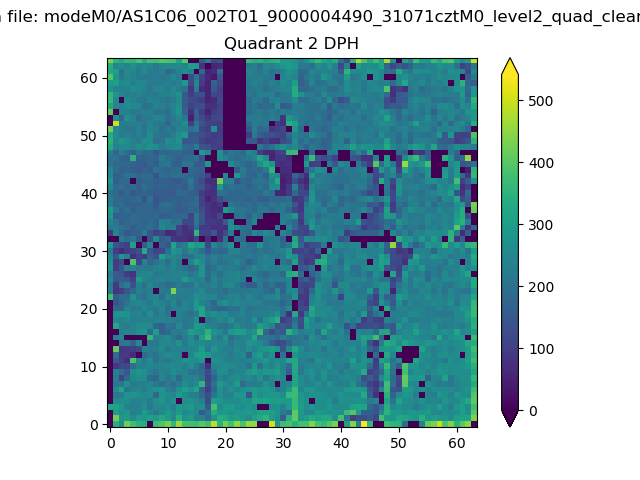
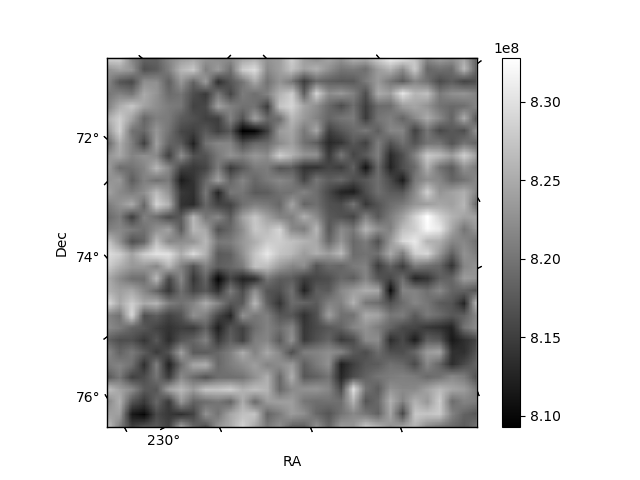
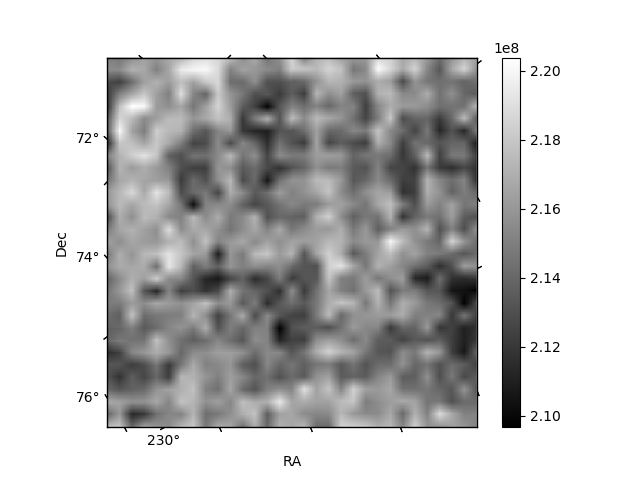
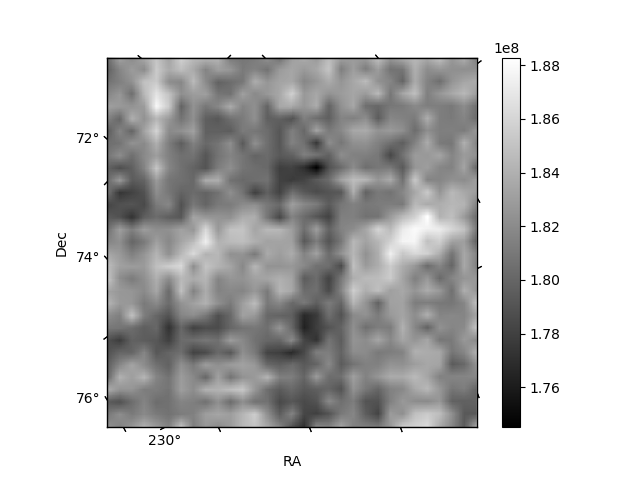
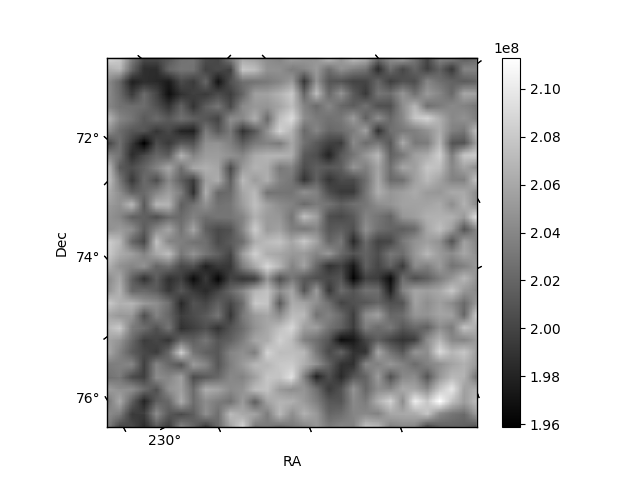
Histogram calculated using DETX and DETY for each event in the final _common_clean file
| Quadrant A | 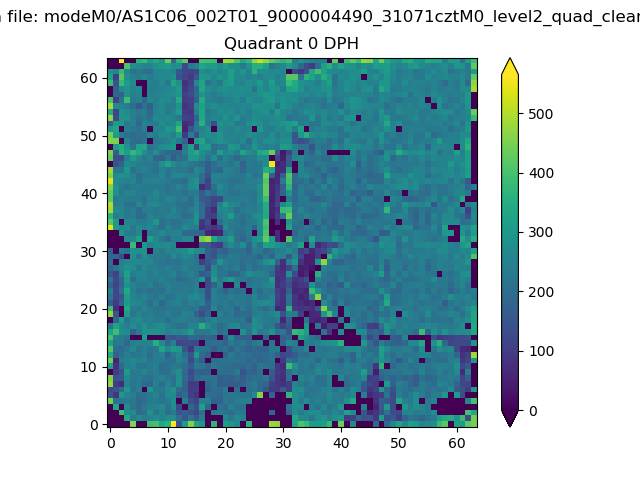 |
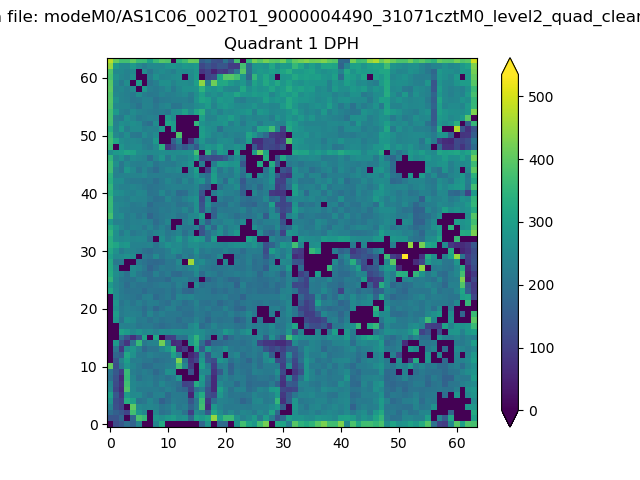 |
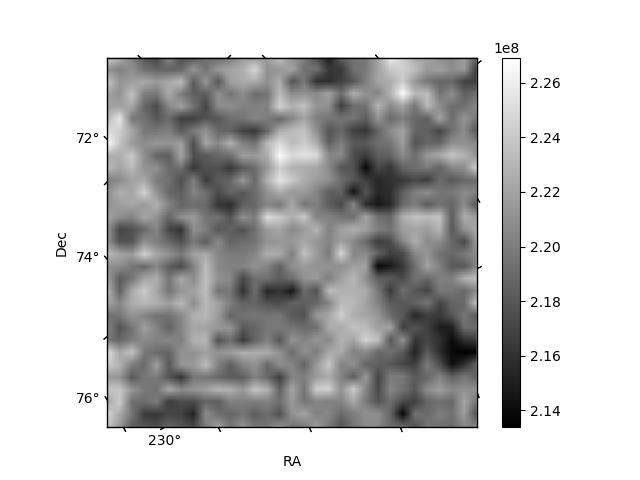
Quadrant B |
|---|---|---|---|
| Quadrant D | 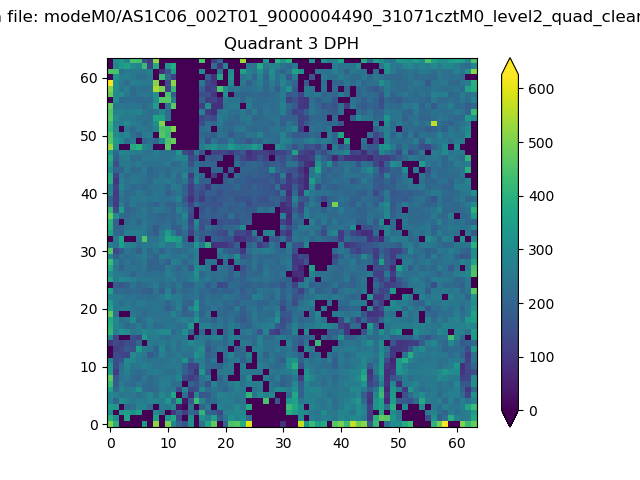 |
 |
Quadrant C |
| Plot type | Count rate plots | Images |
|---|---|---|
| Comparison with Poisson distribution Blue bars denote a histogram of data divided into 1 sec bins. Red curve is a Poisson curve with rate = median count rate of data. |
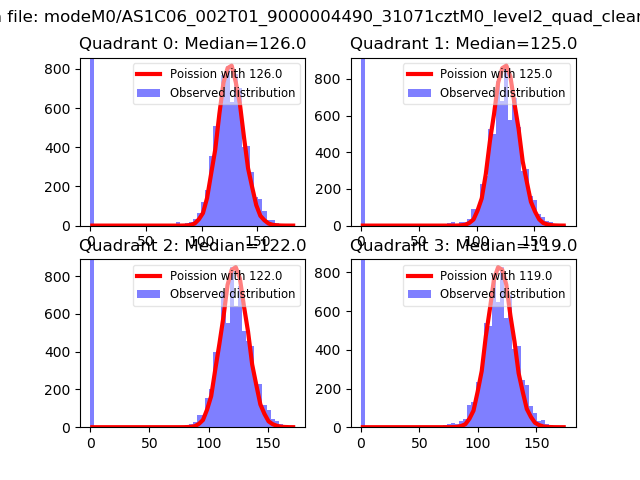 |
 |
| Quadrant-wise count rates Data is divided into 100 sec bins |
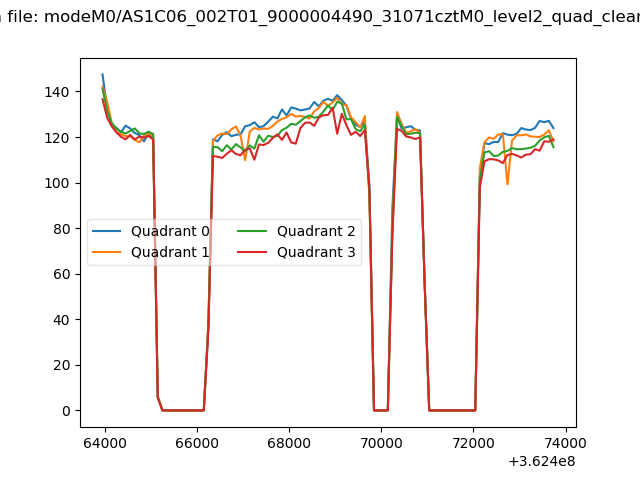 |
|
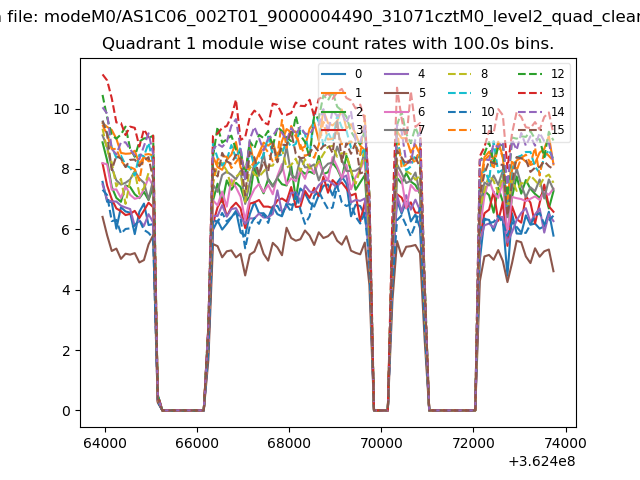
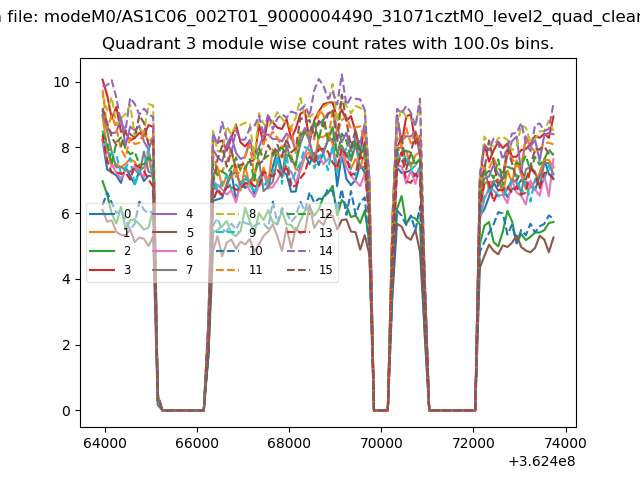
| Module-wise count rates for Quadrant A Data is divided into 100 sec bins |
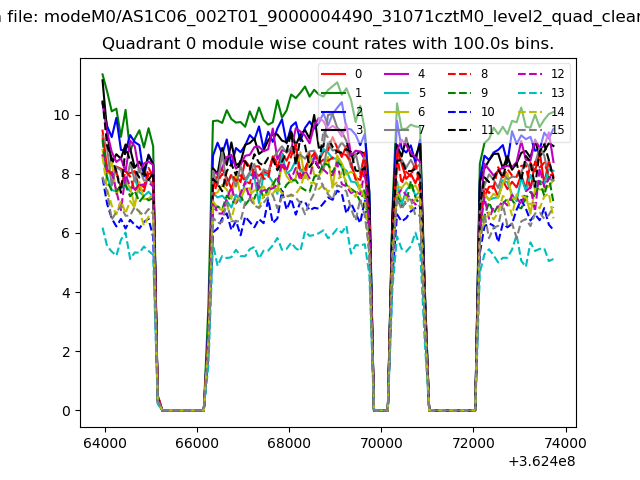 |
 |
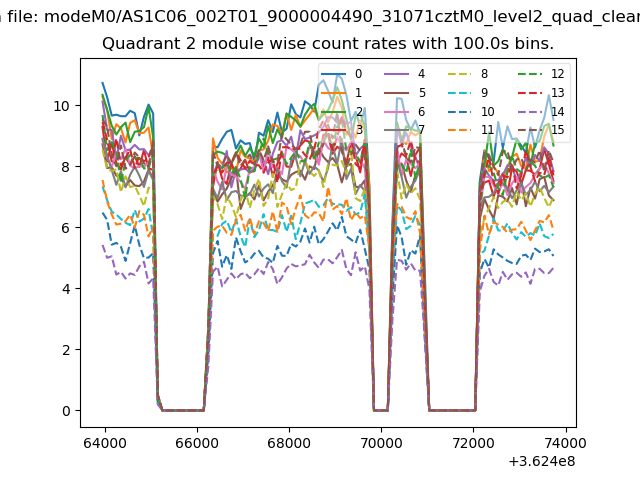
| Module-wise count rates for Quadrant B Data is divided into 100 sec bins |
 |
 |
| Module-wise count rates for Quadrant C Data is divided into 100 sec bins |
 |
 |
| Module-wise count rates for Quadrant D Data is divided into 100 sec bins |
 |
 |
| Parameter | Plot |
|---|---|
| CZT HV Monitor | 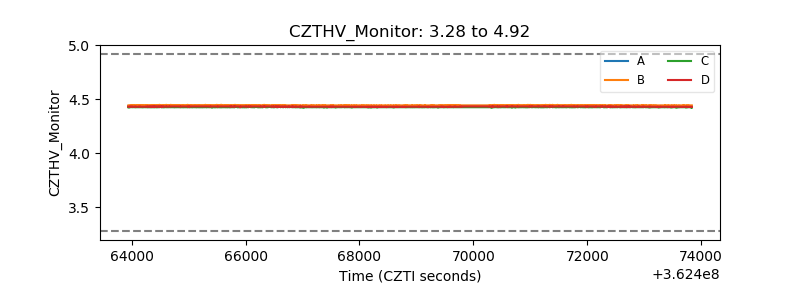 |
| D_VDD | 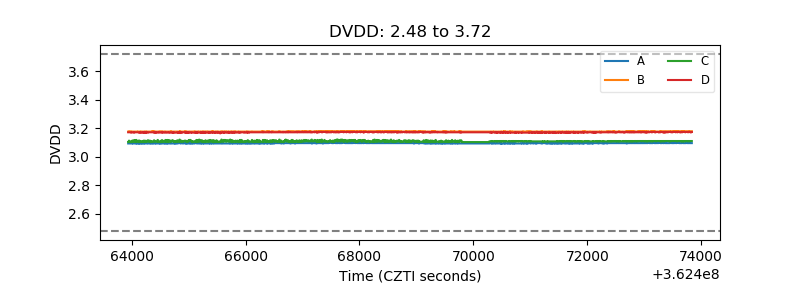 |
| Temperature 1 | 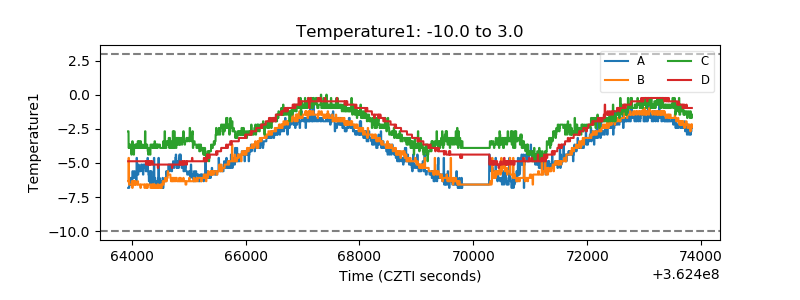 |
| Veto HV Monitor | 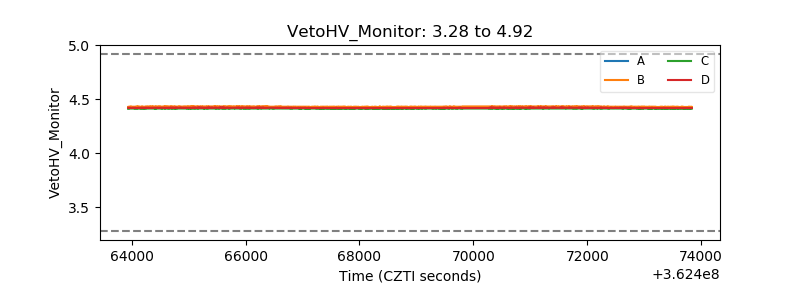 |
| Veto LLD | 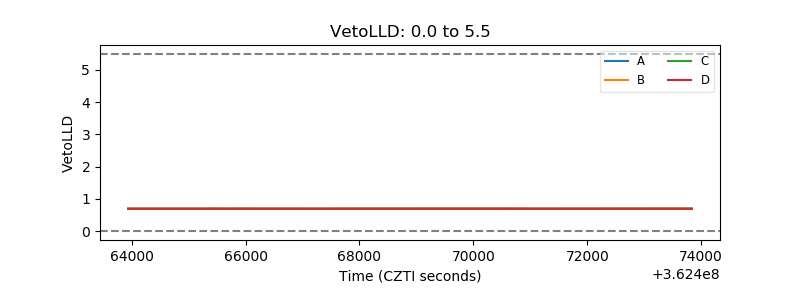 |
| Alpha Counter | 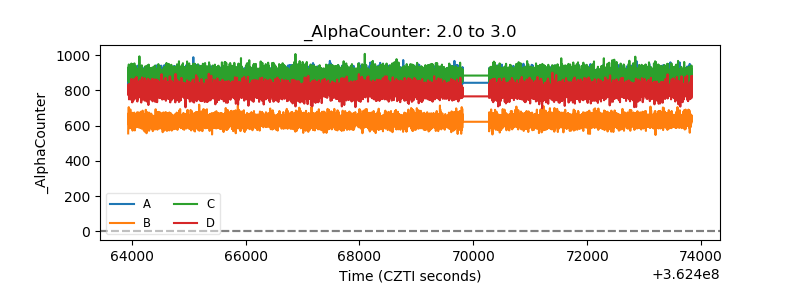 |
| _CPM_Rate | 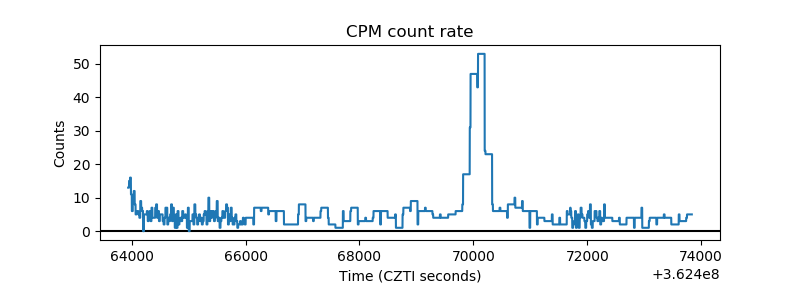 |
| CZT Counter | 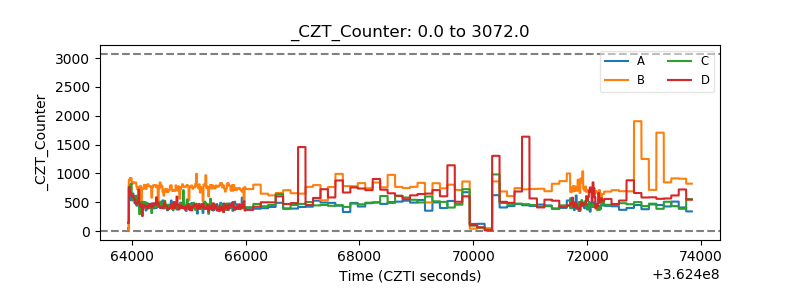 |
| +2.5 Volts monitor |  |
| +5 Volts monitor |  |
| _ROLL_ROT | 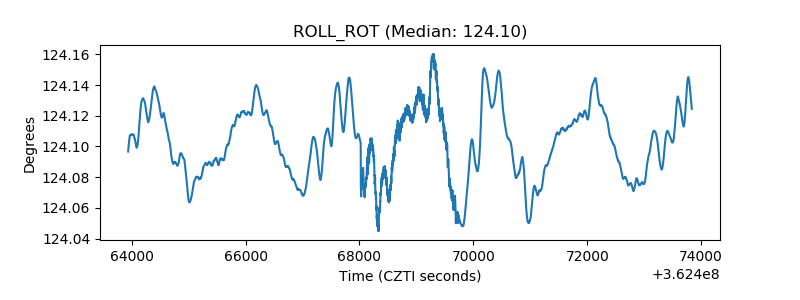 |
| _Roll_DEC | 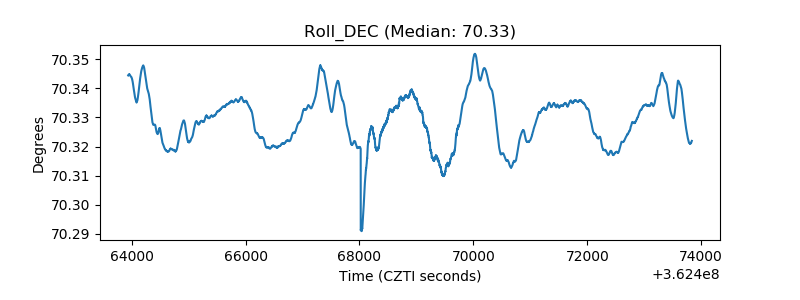 |
| _Roll_RA | 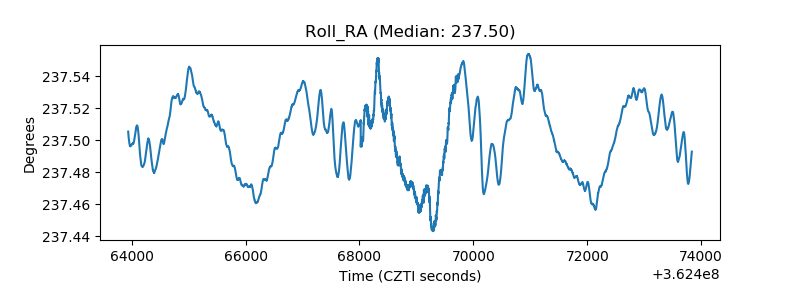 |
| Veto Counter | 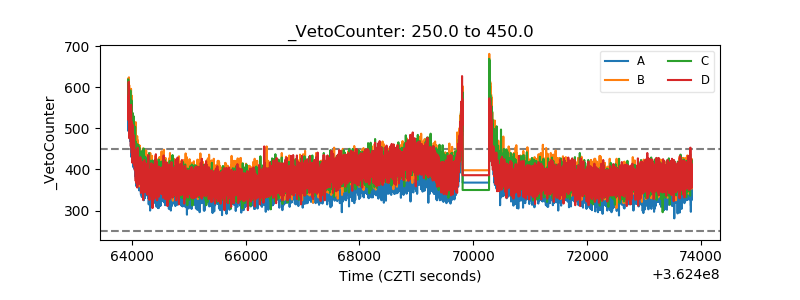 |