| Param | Original file | Final file |
|---|---|---|
| Filename | modeM0/AS1C06_002T01_9000004490_31072cztM0_level2.evt | modeM0/AS1C06_002T01_9000004490_31072cztM0_level2_quad_clean.evt |
| Size (bytes) | 163,753,920 | 36,144,000 |
| Size | 156.2 MB | 34.5 MB |
| Events in quadrant A | 867,638 | 246,580 |
| Events in quadrant B | 1,498,482 | 242,987 |
| Events in quadrant C | 1,198,261 | 232,955 |
| Events in quadrant D | 1,264,221 | 233,708 |
| Mode M0 | |||
|---|---|---|---|
| Quadrant | BADHDUFLAG | Total packets | Discarded packets |
| A | 0 | 3786 | 0 |
| B | 0 | 5786 | 0 |
| C | 0 | 4669 | 0 |
| D | 0 | 5015 | 0 |
| Mode SS | |||
|---|---|---|---|
| Quadrant | BADHDUFLAG | Total packets | Discarded packets |
| A | 0 | 38 | 0 |
| B | 0 | 38 | 0 |
| C | 0 | 38 | 0 |
| D | 0 | 38 | 0 |
| Quadrant | Total seconds | Saturated seconds | Saturation percentage |
|---|---|---|---|
| A | 1890 | 3 | 0.158730% |
| B | 1890 | 23 | 1.216931% |
| C | 1890 | 109 | 5.767196% |
| D | 1890 | 10 | 0.529101% |
Noise dominated data is calculated using 1-second bins in cleaned event files. If a bin has >2000 counts, and if more than 50% of those come from <1% of pixels, then it is considered to be noise-dominated and hence unusable.
| Quadrant | # 1 sec bins | Bins with >0 counts | Bins with >2000 counts | High rate bins dominated by noise | Noise dominated (total time) | Noise dominated (detector-on time) | Marked lightcurve |
|---|---|---|---|---|---|---|---|
| A | 1890 | 1890 | 0 | 0 | 0.00% | 0.00% | 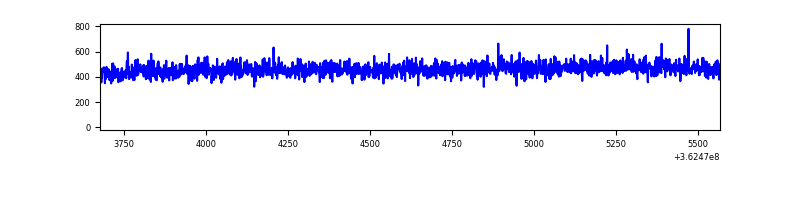 |
| B | 1890 | 1890 | 8 | 8 | 0.42% | 0.42% | 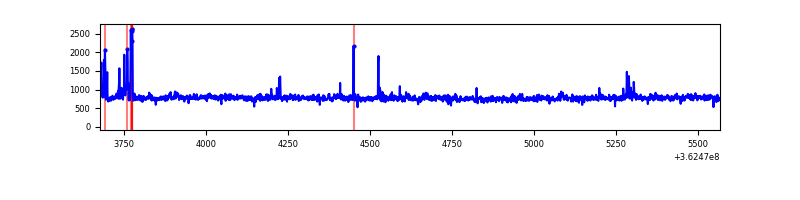 |
| C | 1890 | 1890 | 38 | 38 | 2.01% | 2.01% | 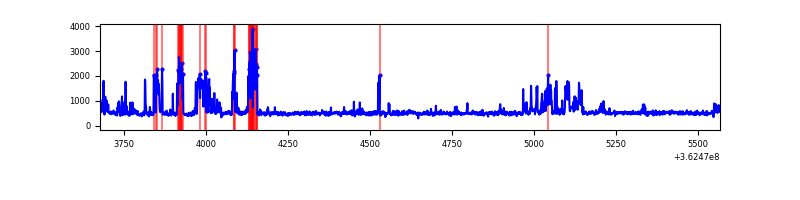 |
| D | 1890 | 1890 | 7 | 7 | 0.37% | 0.37% | 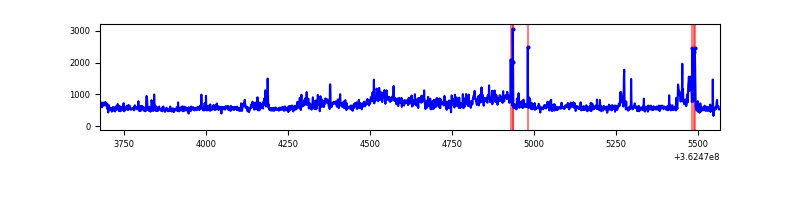 |
Top three noisy pixels from each quadrant. If the there are fewer than three noisy pixels in the level2.evt file, extra rows are filled as -1
| Pixel properties | Quadrant properties | ||||||
|---|---|---|---|---|---|---|---|
| Quadrant | DetID | PixID | Counts | Sigma | Mean | Median | Sigma |
| A | 13 | 254 | 3940 | 78.02 | 224 | 217 | 47.7 |
| A | 3 | 137 | 2154 | 40.59 | 224 | 217 | 47.7 |
| A | 0 | 226 | 1879 | 34.83 | 224 | 217 | 47.7 |
| B | 6 | 159 | 544059 | 12158.19 | 224 | 218 | 44.7 |
| B | 5 | 172 | 35098 | 779.78 | 224 | 218 | 44.7 |
| B | 0 | 183 | 19769 | 437.09 | 224 | 218 | 44.7 |
| C | 15 | 208 | 260909 | 4858.59 | 218 | 219 | 53.7 |
| C | 0 | 10 | 42790 | 793.41 | 218 | 219 | 53.7 |
| C | 14 | 238 | 34498 | 638.87 | 218 | 219 | 53.7 |
| D | 8 | 195 | 275664 | 4994.05 | 223 | 216 | 55.2 |
| D | 13 | 174 | 97390 | 1761.83 | 223 | 216 | 55.2 |
| D | 13 | 249 | 13582 | 242.33 | 223 | 216 | 55.2 |
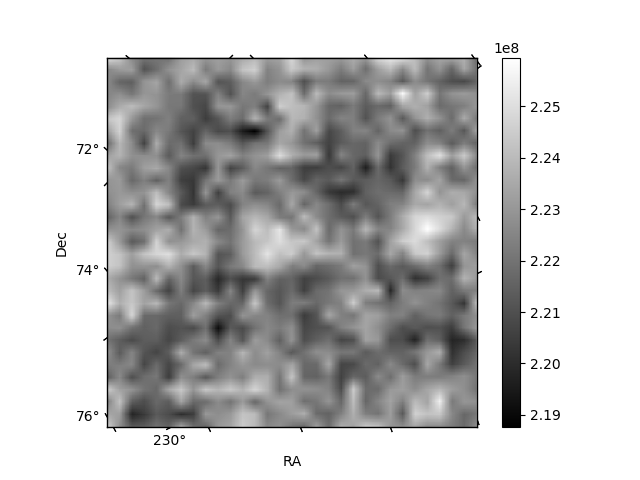
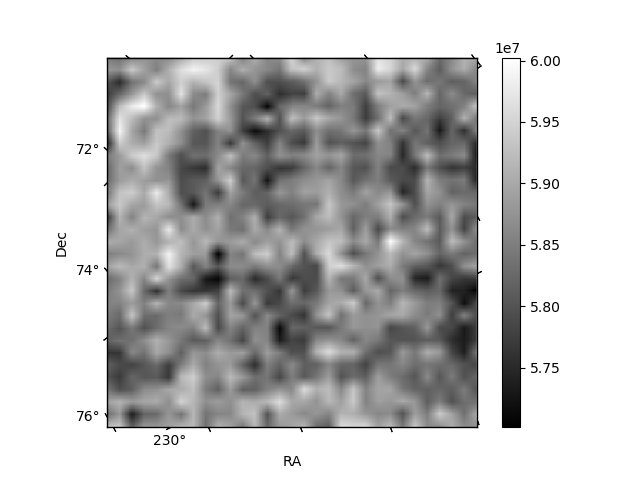
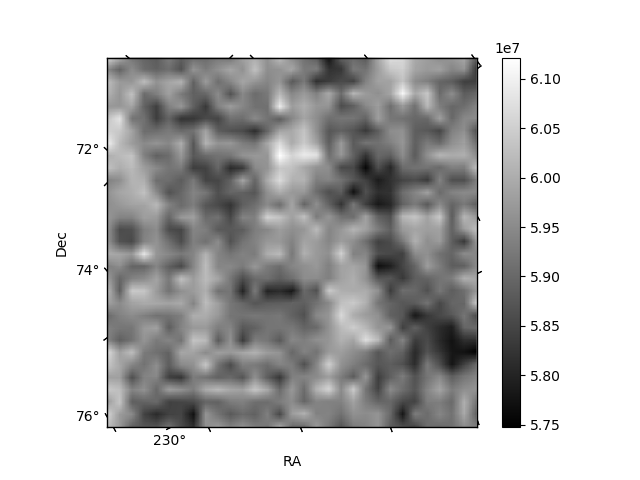
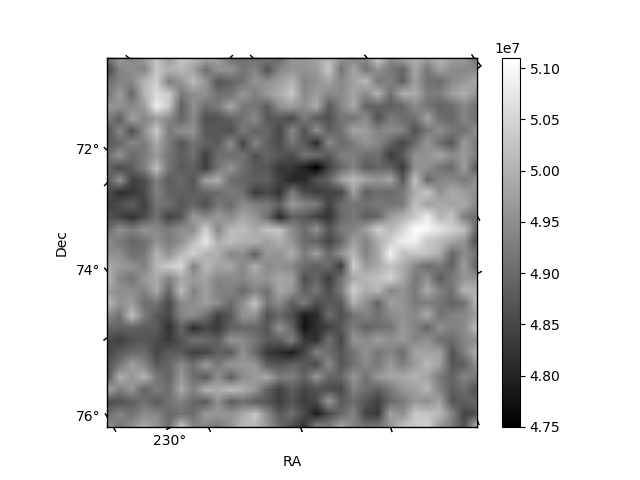
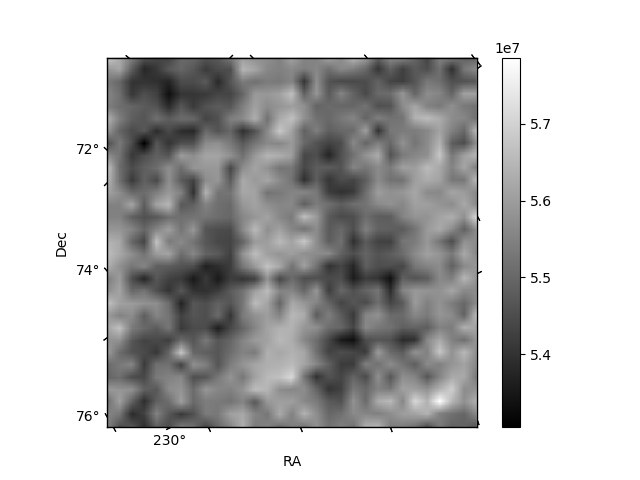
Histogram calculated using DETX and DETY for each event in the final _common_clean file
| Quadrant A | 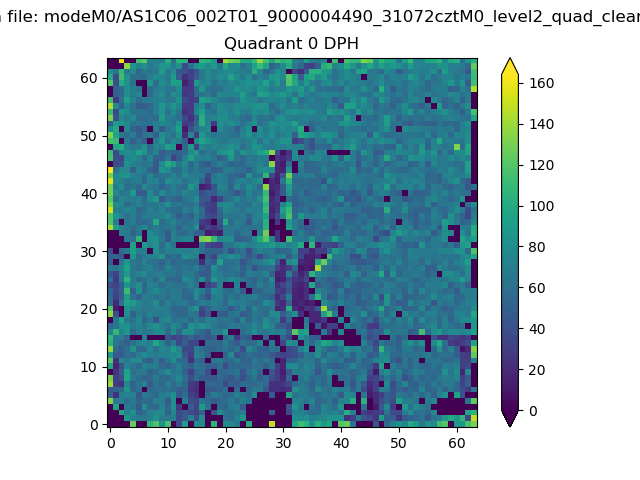 |
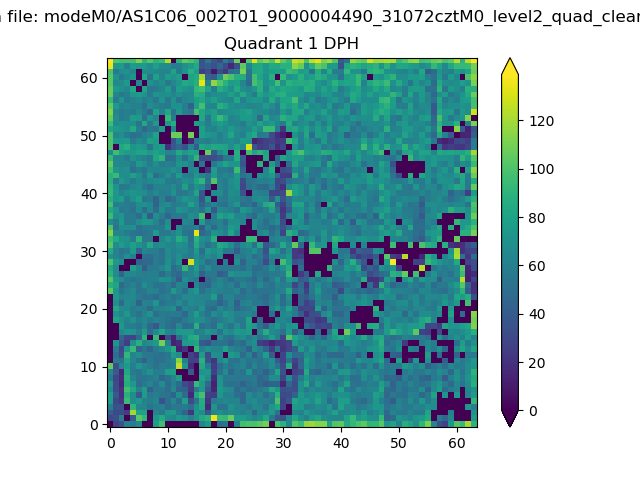 |
Quadrant B |
|---|---|---|---|
| Quadrant D | 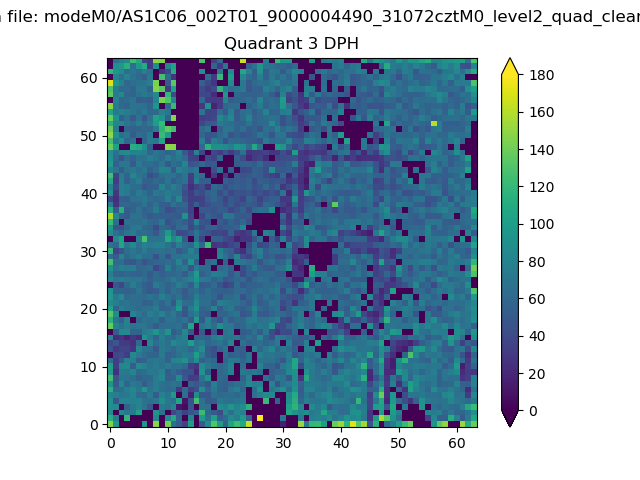 |
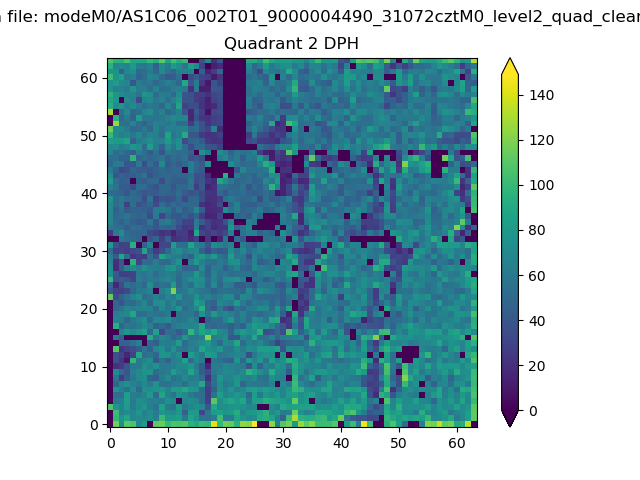 |
Quadrant C |
| Plot type | Count rate plots | Images |
|---|---|---|
| Comparison with Poisson distribution Blue bars denote a histogram of data divided into 1 sec bins. Red curve is a Poisson curve with rate = median count rate of data. |
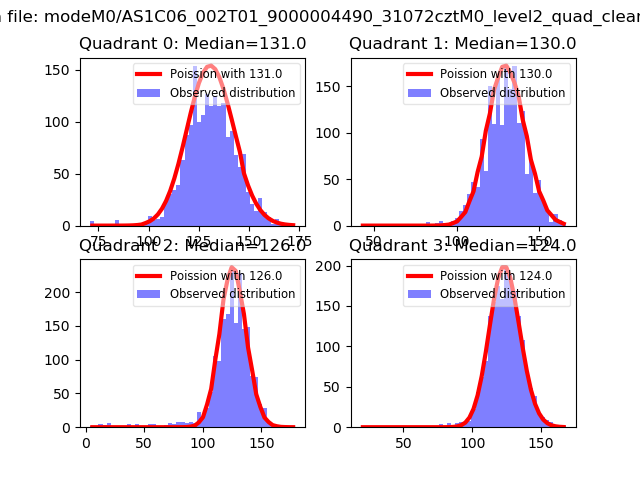 |
 |
| Quadrant-wise count rates Data is divided into 100 sec bins |
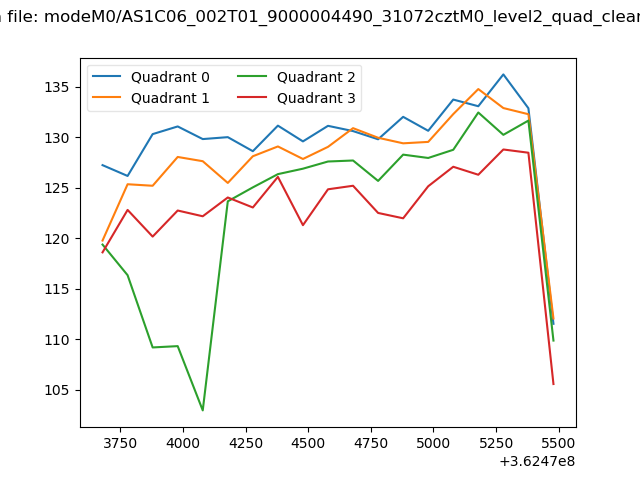 |
|
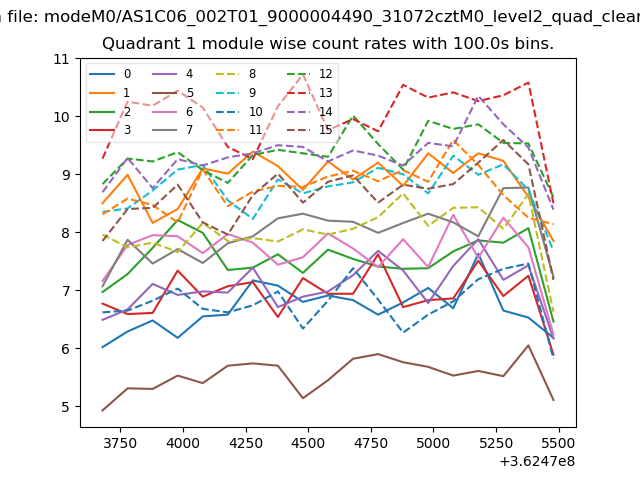
| Module-wise count rates for Quadrant A Data is divided into 100 sec bins |
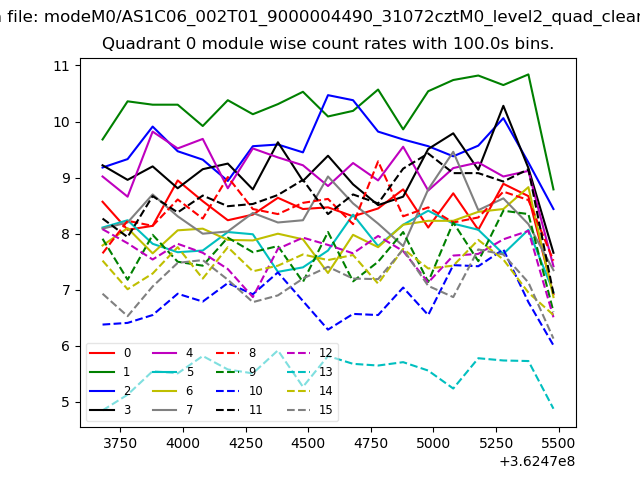 |
 |
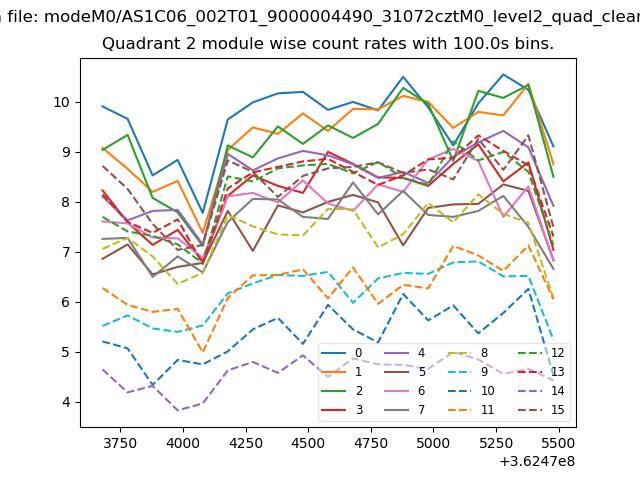
| Module-wise count rates for Quadrant B Data is divided into 100 sec bins |
 |
 |
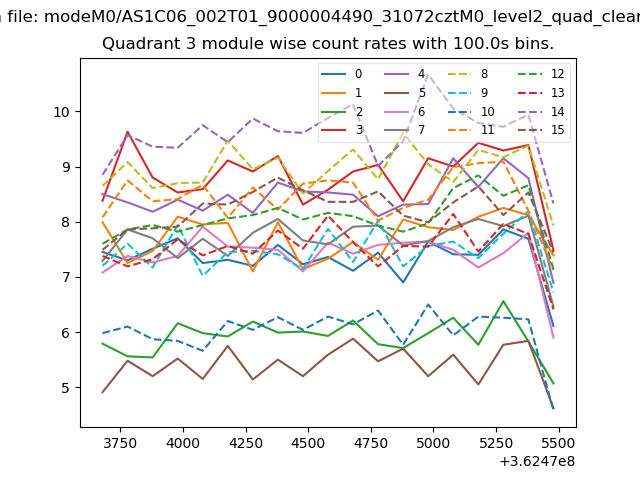
| Module-wise count rates for Quadrant C Data is divided into 100 sec bins |
 |
 |
| Module-wise count rates for Quadrant D Data is divided into 100 sec bins |
 |
 |
| Parameter | Plot |
|---|---|
| CZT HV Monitor | 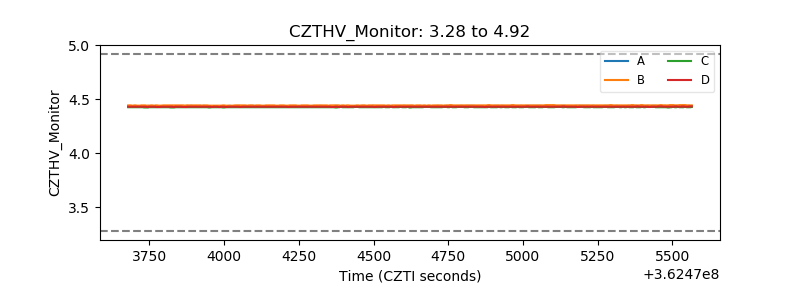 |
| D_VDD | 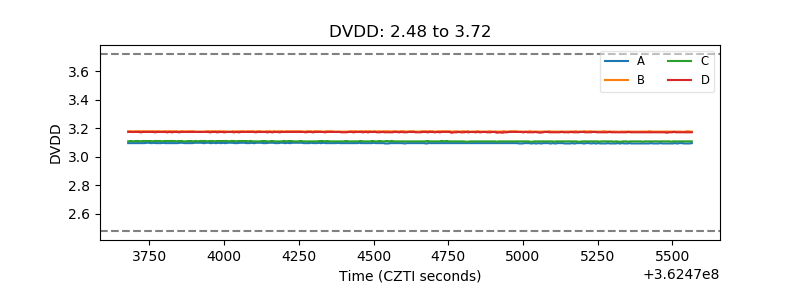 |
| Temperature 1 | 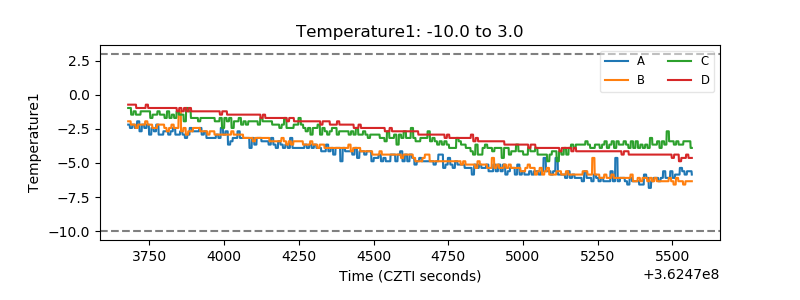 |
| Veto HV Monitor | 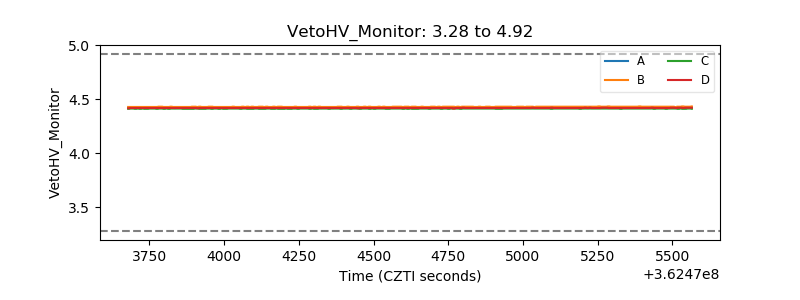 |
| Veto LLD | 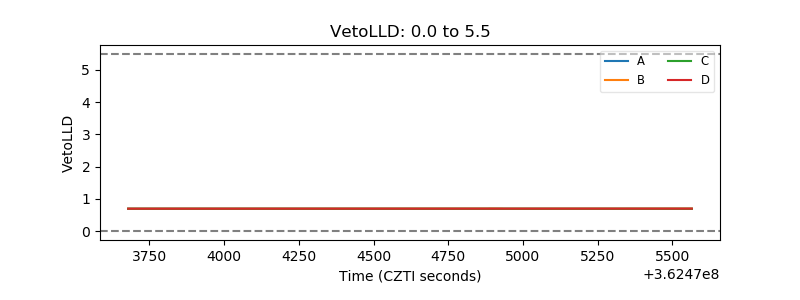 |
| Alpha Counter | 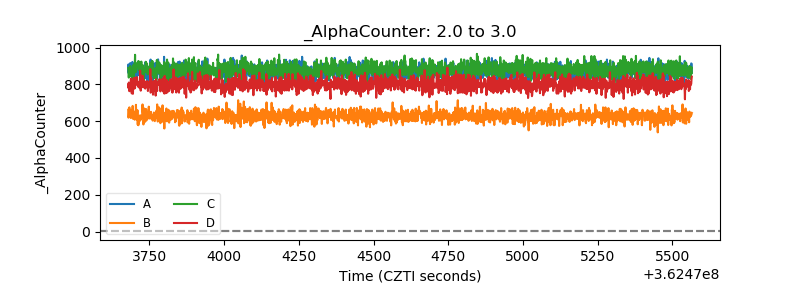 |
| _CPM_Rate | 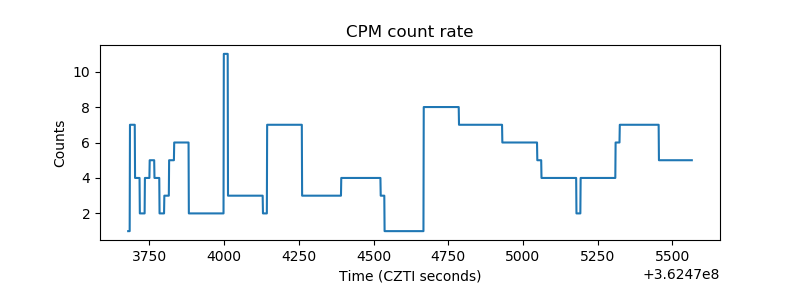 |
| CZT Counter | 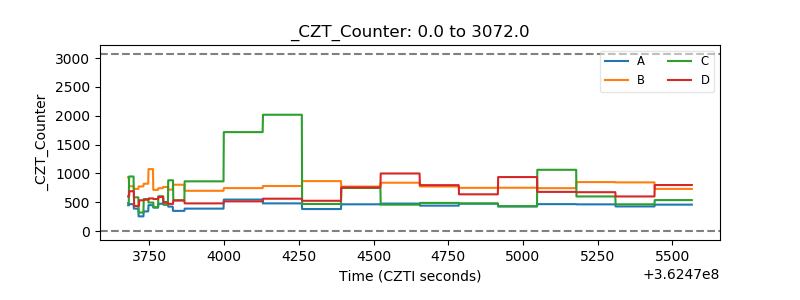 |
| +2.5 Volts monitor | 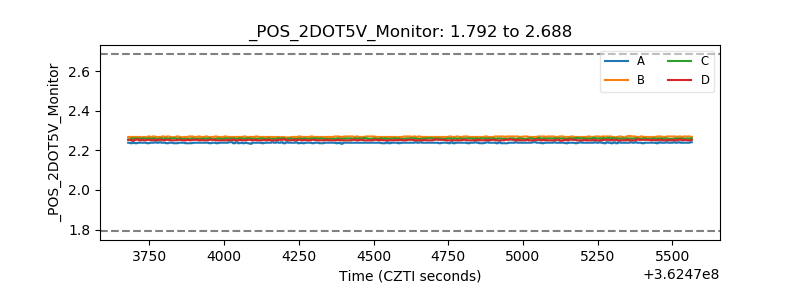 |
| +5 Volts monitor | 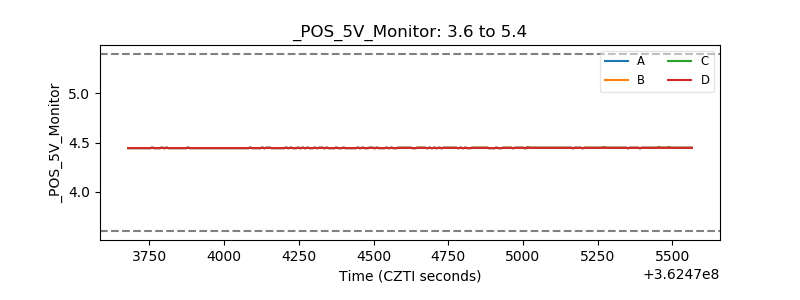 |
| _ROLL_ROT | 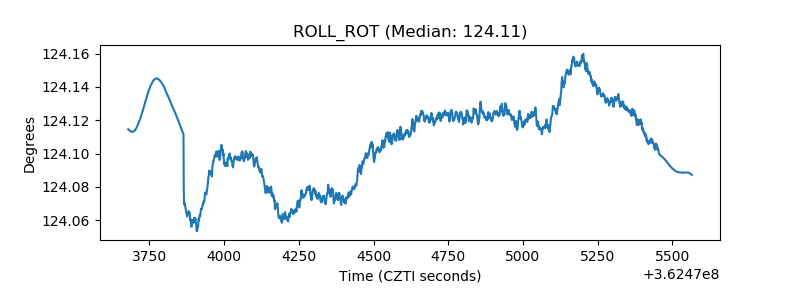 |
| _Roll_DEC | 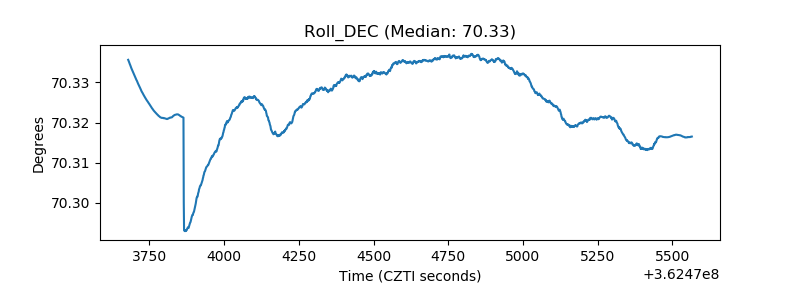 |
| _Roll_RA | 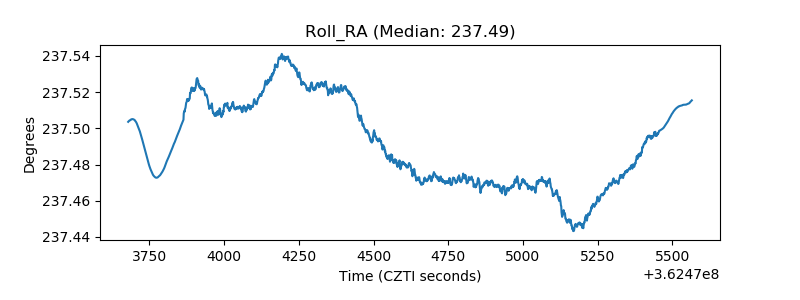 |
| Veto Counter | 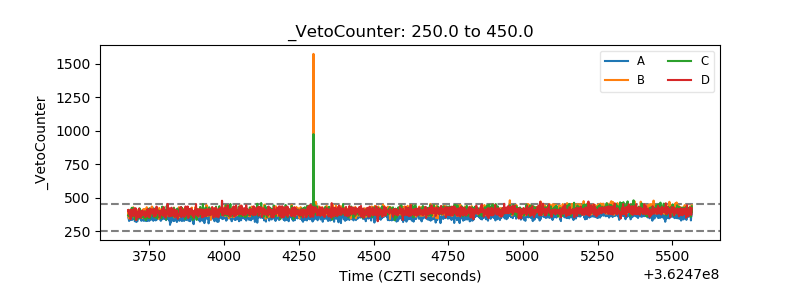 |