| Param | Original file | Final file |
|---|---|---|
| Filename | modeM0/AS1A10_109T01_9000004492cztM0_level2.fits | modeM0/AS1A10_109T01_9000004492cztM0_level2_quad_clean.evt |
| Size (bytes) | 2,302,917,120 | 1,871,403,840 |
| Size | 2.1 GB | 1.7 GB |
| Events in quadrant A | 14,452,388 | 10,907,194 |
| Events in quadrant B | 13,531,970 | 10,713,648 |
| Events in quadrant C | 13,941,120 | 10,253,468 |
| Events in quadrant D | 12,471,788 | 9,453,091 |
| Mode M0 | |||
|---|---|---|---|
| Quadrant | BADHDUFLAG | Total packets | Discarded packets |
| A | 0 | 474464 | 0 |
| B | 0 | 683440 | 0 |
| C | 0 | 511970 | 0 |
| D | 0 | 558901 | 0 |
| Mode SS | |||
|---|---|---|---|
| Quadrant | BADHDUFLAG | Total packets | Discarded packets |
| A | 0 | 4574 | 0 |
| B | 0 | 4571 | 0 |
| C | 0 | 4574 | 0 |
| D | 0 | 4583 | 0 |
| Mode M9 | |||
|---|---|---|---|
| Quadrant | BADHDUFLAG | Total packets | Discarded packets |
| A | 0 | 370 | 0 |
| B | 0 | 370 | 0 |
| C | 0 | 368 | 0 |
| D | 0 | 370 | 0 |
| Quadrant | Total seconds | Saturated seconds | Saturation percentage |
|---|---|---|---|
| A | 224121 | 2674 | 1.193106% |
| B | 223756 | 5573 | 2.490659% |
| C | 224052 | 7564 | 3.376002% |
| D | 224019 | 4088 | 1.824845% |
Noise dominated data is calculated using 1-second bins in cleaned event files. If a bin has >2000 counts, and if more than 50% of those come from <1% of pixels, then it is considered to be noise-dominated and hence unusable.
| Quadrant | # 1 sec bins | Bins with >0 counts | Bins with >2000 counts | High rate bins dominated by noise | Noise dominated (total time) | Noise dominated (detector-on time) | Marked lightcurve |
|---|---|---|---|---|---|---|---|
| A | 258577 | 222415 | 0 | 0 | 0.00% | 0.00% |  |
| B | 258577 | 222279 | 0 | 0 | 0.00% | 0.00% |  |
| C | 258577 | 222454 | 0 | 0 | 0.00% | 0.00% |  |
| D | 258575 | 222384 | 0 | 0 | 0.00% | 0.00% |  |
Top three noisy pixels from each quadrant. If the there are fewer than three noisy pixels in the level2.evt file, extra rows are filled as -1
| Pixel properties | Quadrant properties | ||||||
|---|---|---|---|---|---|---|---|
| Quadrant | DetID | PixID | Counts | Sigma | Mean | Median | Sigma |
| A | 0 | 29 | 13831 | 11.39 | 3759 | 3541 | 903.5 |
| A | 7 | 110 | 11422 | 8.72 | 3759 | 3541 | 903.5 |
| A | 9 | 19 | 10928 | 8.18 | 3759 | 3541 | 903.5 |
| B | 2 | 9 | 10737 | 10.45 | 3572 | 3410 | 701.2 |
| B | 3 | 80 | 8954 | 7.91 | 3572 | 3410 | 701.2 |
| B | 2 | 8 | 8940 | 7.89 | 3572 | 3410 | 701.2 |
| C | 12 | 241 | 9561 | 6.61 | 3693 | 3473 | 920.6 |
| C | 3 | 187 | 9478 | 6.52 | 3693 | 3473 | 920.6 |
| C | 3 | 126 | 9446 | 6.49 | 3693 | 3473 | 920.6 |
| D | 4 | 246 | 9728 | 6.94 | 3561 | 3253 | 933.3 |
| D | 15 | 46 | 9415 | 6.6 | 3561 | 3253 | 933.3 |
| D | 10 | 189 | 8700 | 5.84 | 3561 | 3253 | 933.3 |
Histogram calculated using DETX and DETY for each event in the final _common_clean file
| Quadrant A |  |
 |
Quadrant B |
|---|---|---|---|
| Quadrant D |  |
 |
Quadrant C |
| Plot type | Count rate plots | Images |
|---|---|---|
| Comparison with Poisson distribution Blue bars denote a histogram of data divided into 1 sec bins. Red curve is a Poisson curve with rate = median count rate of data. |
 |
 |
| Quadrant-wise count rates Data is divided into 100 sec bins |
 |
|
| Module-wise count rates for Quadrant A Data is divided into 100 sec bins |
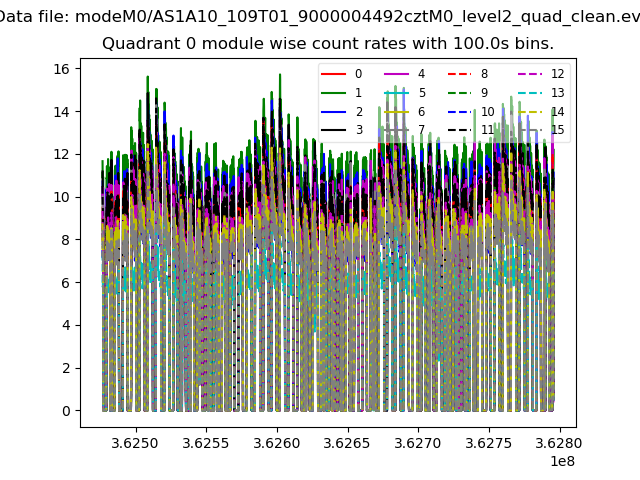 |
 |
| Module-wise count rates for Quadrant B Data is divided into 100 sec bins |
 |
 |
| Module-wise count rates for Quadrant C Data is divided into 100 sec bins |
 |
 |
| Module-wise count rates for Quadrant D Data is divided into 100 sec bins |
 |
 |
| Parameter | Plot |
|---|---|
| CZT HV Monitor |  |
| D_VDD |  |
| Temperature 1 |  |
| Veto HV Monitor |  |
| Veto LLD |  |
| Alpha Counter |  |
| _CPM_Rate |  |
| CZT Counter |  |
| +2.5 Volts monitor |  |
| +5 Volts monitor |  |
| _ROLL_ROT |  |
| _Roll_DEC |  |
| _Roll_RA |  |
| Veto Counter |  |