| Param | Original file | Final file |
|---|---|---|
| Filename | modeM0/AS1A10_109T01_9000004492_31072cztM0_level2.evt | modeM0/AS1A10_109T01_9000004492_31072cztM0_level2_quad_clean.evt |
| Size (bytes) | 585,074,880 | 76,976,640 |
| Size | 558.0 MB | 73.4 MB |
| Events in quadrant A | 3,314,395 | 479,626 |
| Events in quadrant B | 5,314,002 | 473,726 |
| Events in quadrant C | 4,057,453 | 453,272 |
| Events in quadrant D | 4,569,287 | 446,441 |
| Mode M0 | |||
|---|---|---|---|
| Quadrant | BADHDUFLAG | Total packets | Discarded packets |
| A | 0 | 14007 | 2 |
| B | 0 | 20880 | 2 |
| C | 0 | 16200 | 2 |
| D | 0 | 18312 | 2 |
| Mode SS | |||
|---|---|---|---|
| Quadrant | BADHDUFLAG | Total packets | Discarded packets |
| A | 0 | 140 | 0 |
| B | 0 | 140 | 0 |
| C | 0 | 140 | 0 |
| D | 0 | 140 | 0 |
| Mode M9 | |||
|---|---|---|---|
| Quadrant | BADHDUFLAG | Total packets | Discarded packets |
| A | 0 | 12 | 0 |
| B | 0 | 12 | 0 |
| C | 0 | 12 | 0 |
| D | 0 | 12 | 0 |
| Quadrant | Total seconds | Saturated seconds | Saturation percentage |
|---|---|---|---|
| A | 6852 | 61 | 0.890251% |
| B | 6852 | 114 | 1.663748% |
| C | 6852 | 244 | 3.561004% |
| D | 6852 | 97 | 1.415645% |
Noise dominated data is calculated using 1-second bins in cleaned event files. If a bin has >2000 counts, and if more than 50% of those come from <1% of pixels, then it is considered to be noise-dominated and hence unusable.
| Quadrant | # 1 sec bins | Bins with >0 counts | Bins with >2000 counts | High rate bins dominated by noise | Noise dominated (total time) | Noise dominated (detector-on time) | Marked lightcurve |
|---|---|---|---|---|---|---|---|
| A | 7657 | 6853 | 0 | 0 | 0.00% | 0.00% | 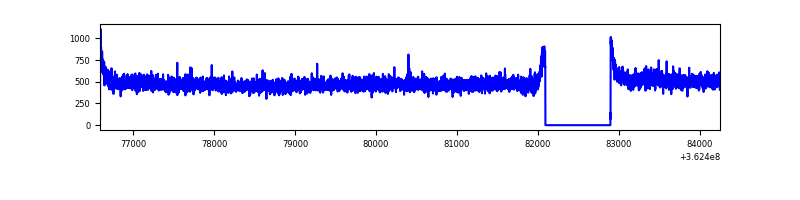 |
| B | 7657 | 6853 | 1 | 1 | 0.01% | 0.01% |  |
| C | 7657 | 6853 | 66 | 66 | 0.86% | 0.96% | 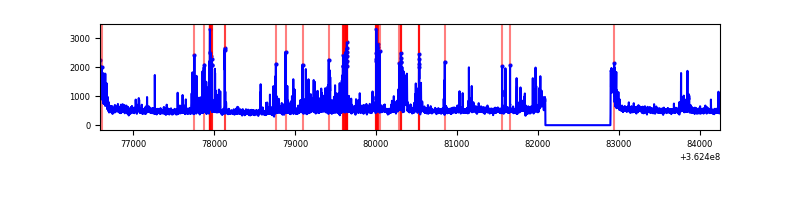 |
| D | 7657 | 6853 | 40 | 40 | 0.52% | 0.58% | 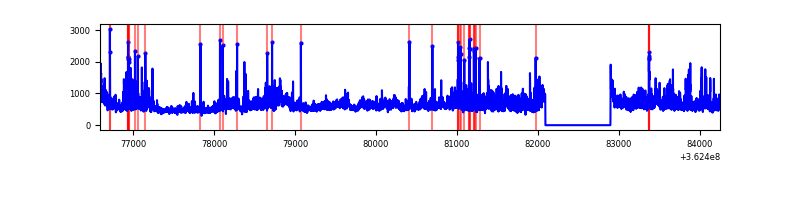 |
Top three noisy pixels from each quadrant. If the there are fewer than three noisy pixels in the level2.evt file, extra rows are filled as -1
| Pixel properties | Quadrant properties | ||||||
|---|---|---|---|---|---|---|---|
| Quadrant | DetID | PixID | Counts | Sigma | Mean | Median | Sigma |
| A | 13 | 170 | 17418 | 96.27 | 855 | 839 | 172.2 |
| A | 13 | 254 | 12100 | 65.39 | 855 | 839 | 172.2 |
| A | 3 | 137 | 8935 | 47.01 | 855 | 839 | 172.2 |
| B | 6 | 159 | 1832640 | 11224.82 | 841 | 819 | 163.2 |
| B | 0 | 190 | 82722 | 501.88 | 841 | 819 | 163.2 |
| B | 0 | 183 | 58410 | 352.9 | 841 | 819 | 163.2 |
| C | 15 | 208 | 418286 | 2182.83 | 806 | 813 | 191.3 |
| C | 0 | 10 | 271025 | 1412.85 | 806 | 813 | 191.3 |
| C | 14 | 238 | 130525 | 678.22 | 806 | 813 | 191.3 |
| D | 8 | 195 | 945201 | 4852.62 | 818 | 799 | 194.6 |
| D | 13 | 174 | 336151 | 1723.14 | 818 | 799 | 194.6 |
| D | 2 | 250 | 150180 | 767.56 | 818 | 799 | 194.6 |
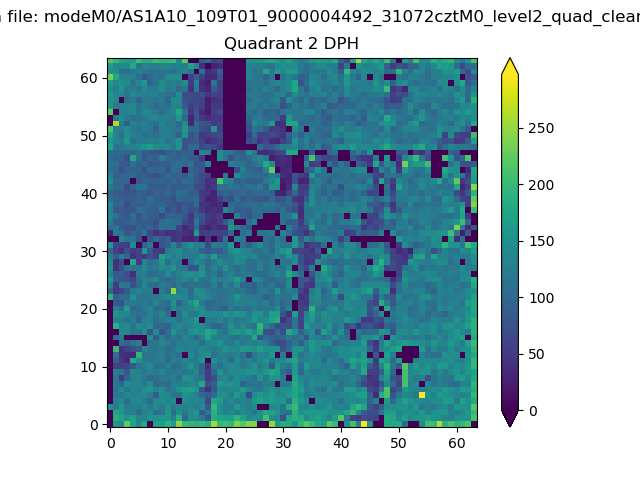
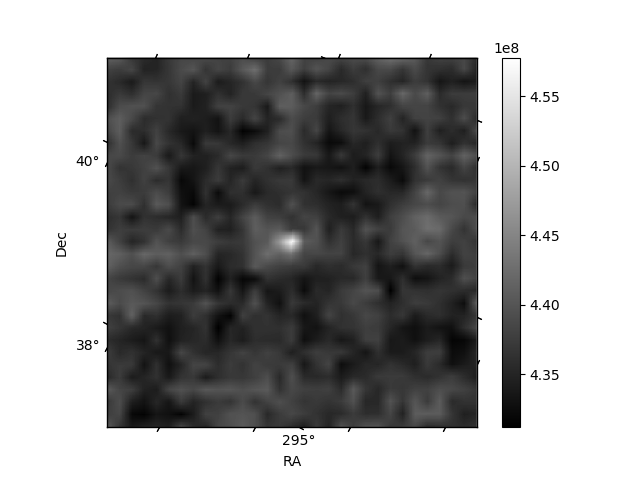
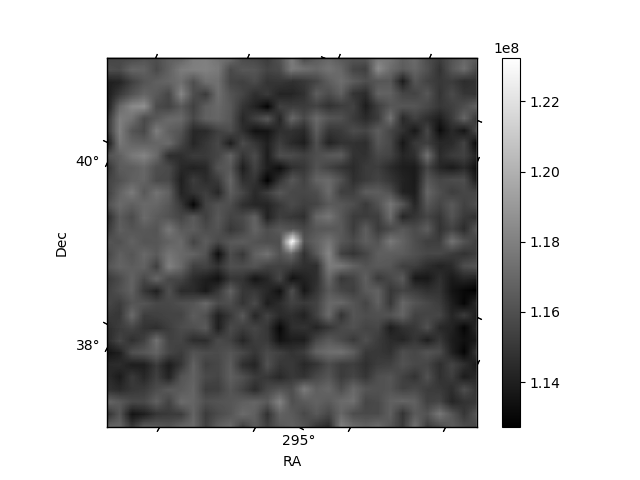
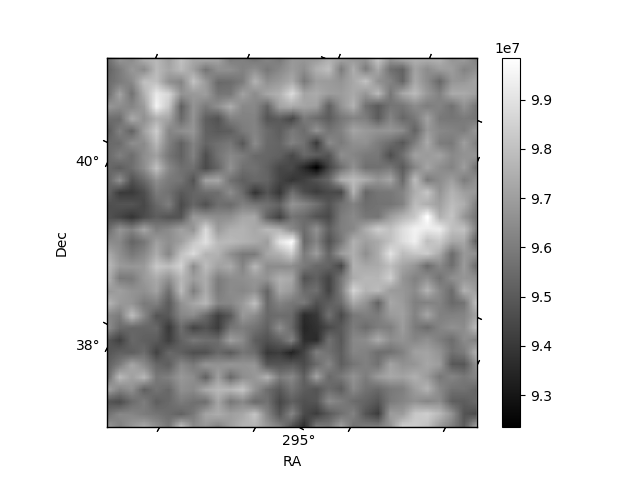
Histogram calculated using DETX and DETY for each event in the final _common_clean file
| Quadrant A | 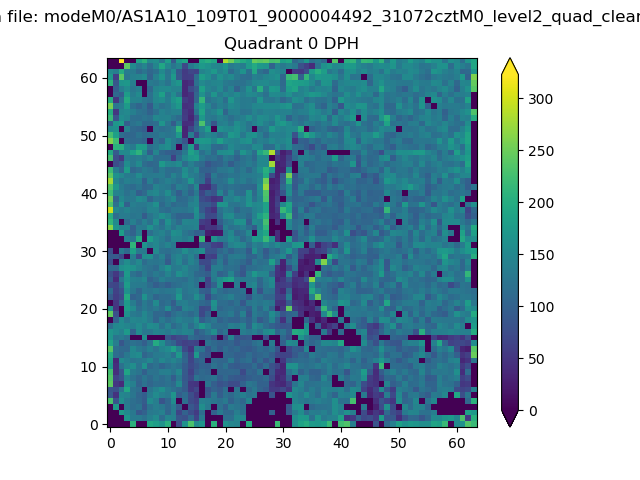 |
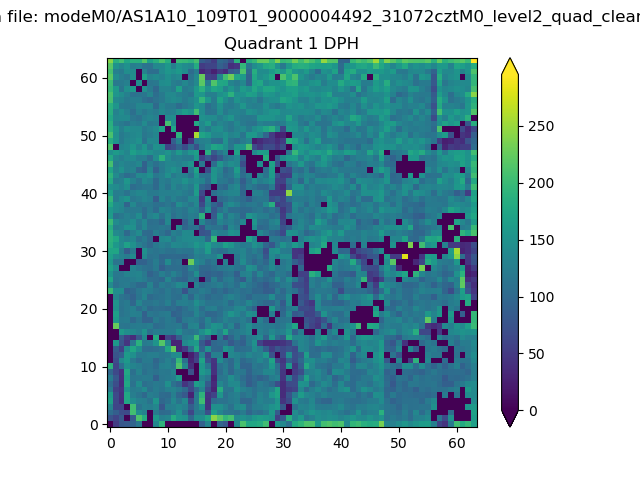 |
Quadrant B |
|---|---|---|---|
| Quadrant D | 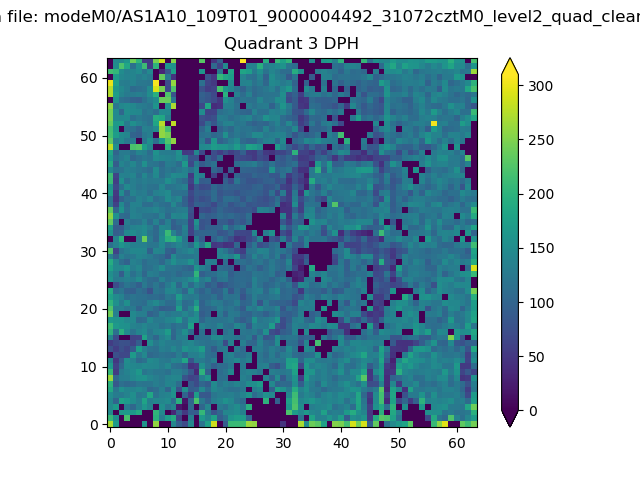 |
 |
Quadrant C |
| Plot type | Count rate plots | Images |
|---|---|---|
| Comparison with Poisson distribution Blue bars denote a histogram of data divided into 1 sec bins. Red curve is a Poisson curve with rate = median count rate of data. |
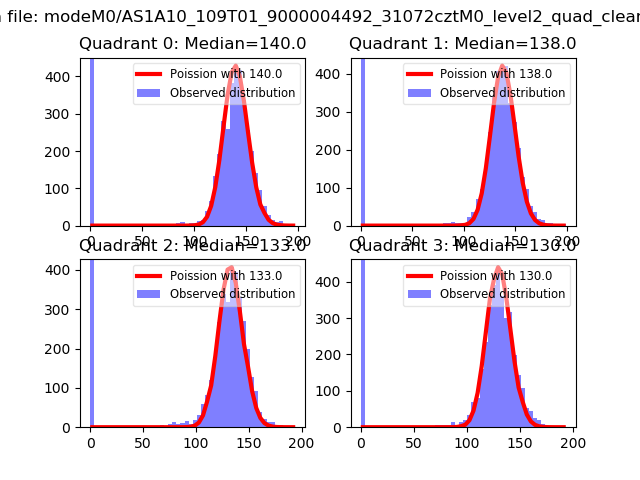 |
 |
| Quadrant-wise count rates Data is divided into 100 sec bins |
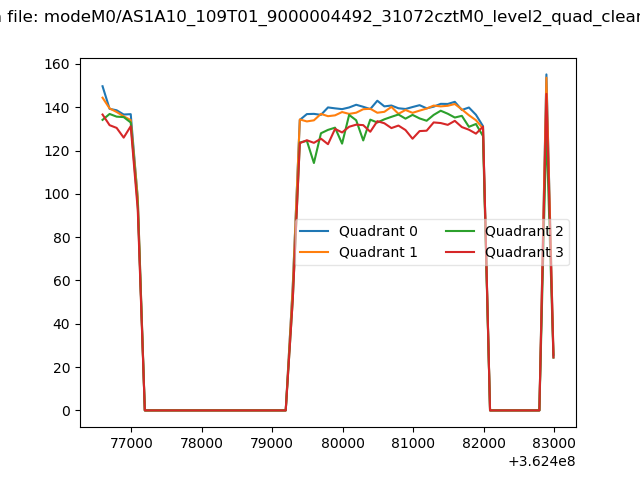 |
|
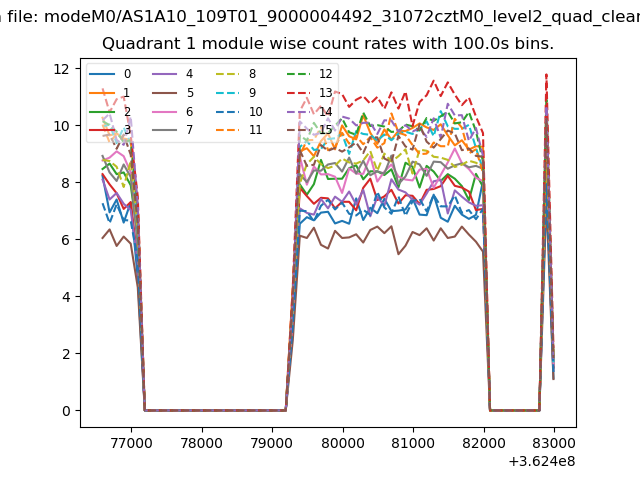
| Module-wise count rates for Quadrant A Data is divided into 100 sec bins |
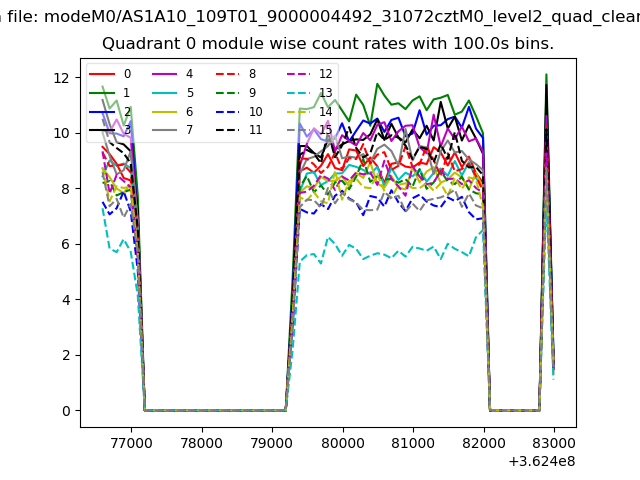 |
 |
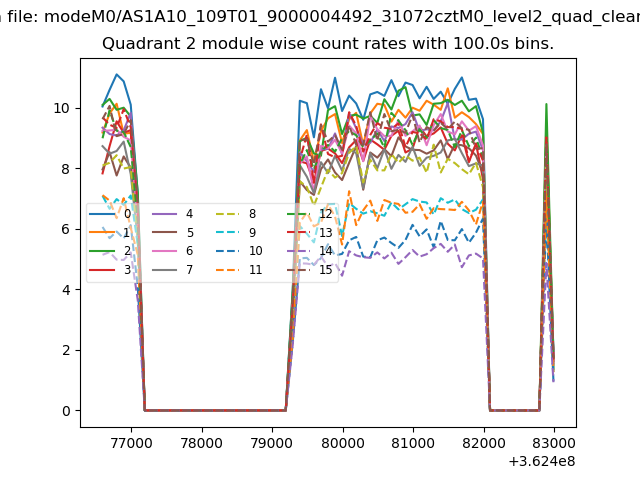
| Module-wise count rates for Quadrant B Data is divided into 100 sec bins |
 |
 |
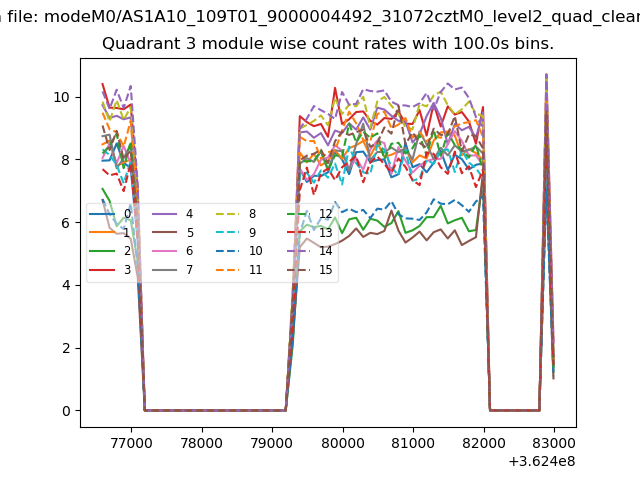
| Module-wise count rates for Quadrant C Data is divided into 100 sec bins |
 |
 |
| Module-wise count rates for Quadrant D Data is divided into 100 sec bins |
 |
 |
| Parameter | Plot |
|---|---|
| CZT HV Monitor | 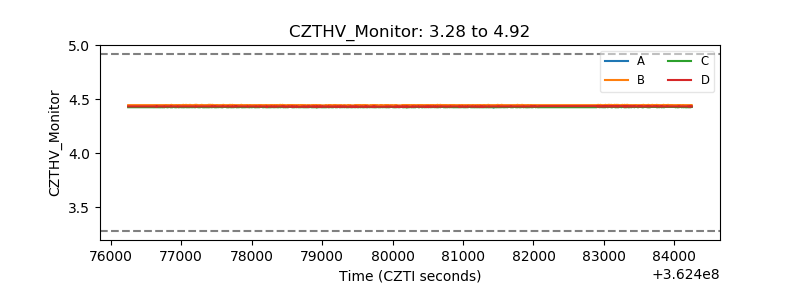 |
| D_VDD |  |
| Temperature 1 | 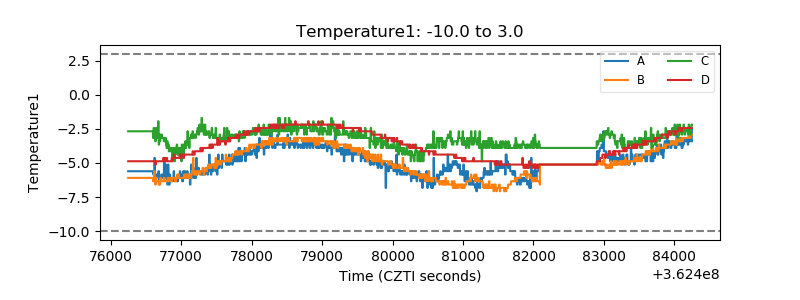 |
| Veto HV Monitor | 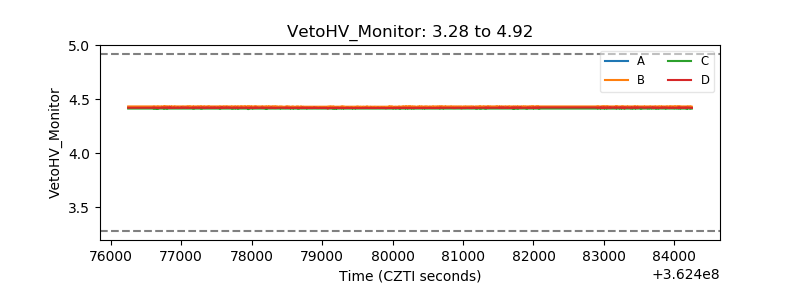 |
| Veto LLD | 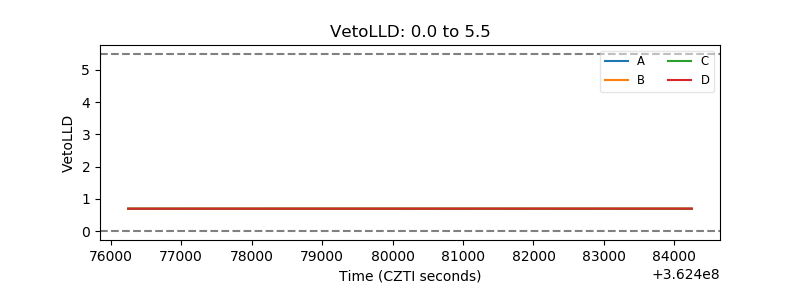 |
| Alpha Counter | 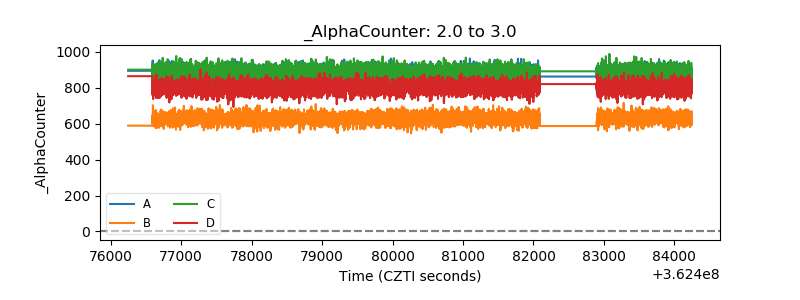 |
| _CPM_Rate | 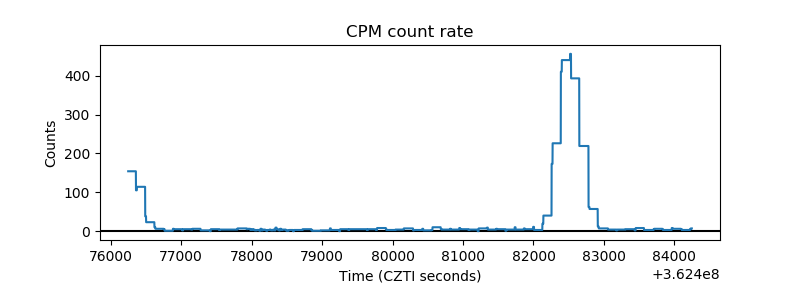 |
| CZT Counter | 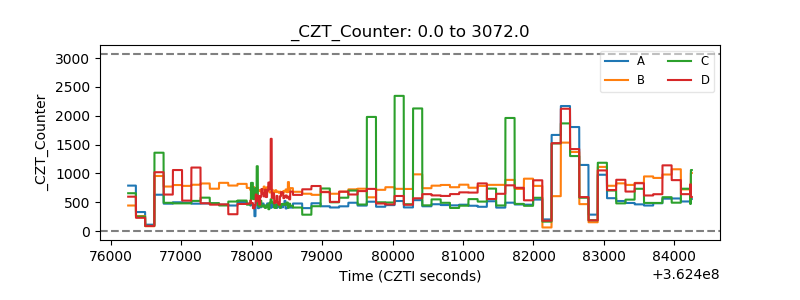 |
| +2.5 Volts monitor |  |
| +5 Volts monitor |  |
| _ROLL_ROT | 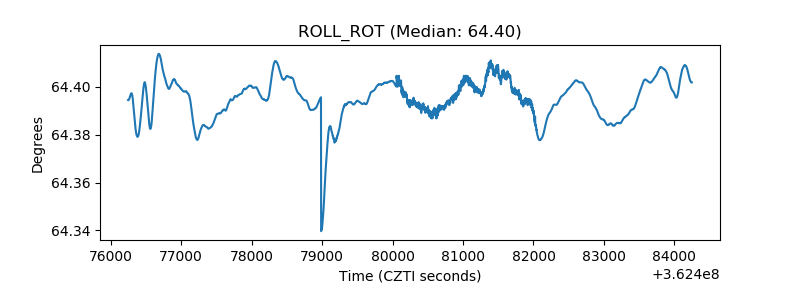 |
| _Roll_DEC | 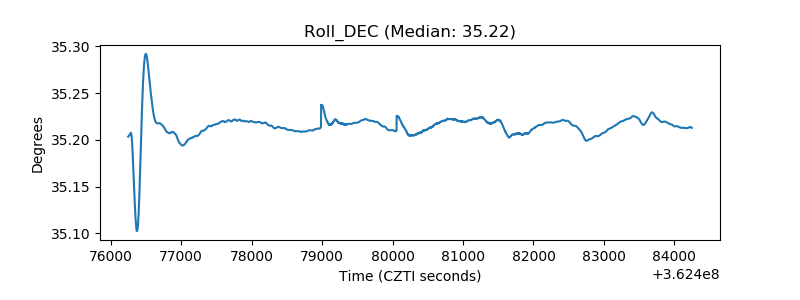 |
| _Roll_RA | 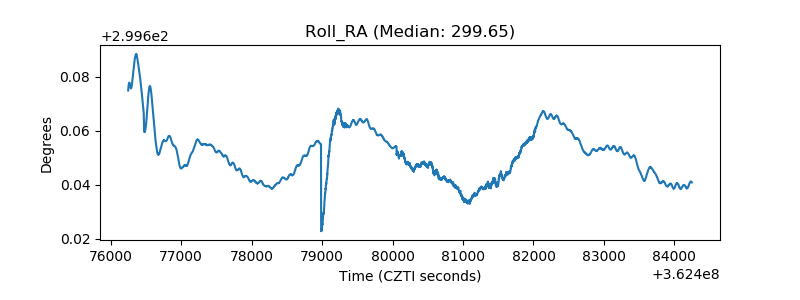 |
| Veto Counter | 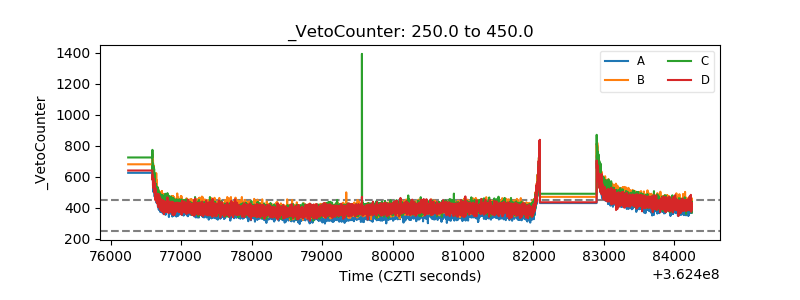 |