| Param | Original file | Final file |
|---|---|---|
| Filename | modeM0/AS1A10_109T01_9000004492_31075cztM0_level2.evt | modeM0/AS1A10_109T01_9000004492_31075cztM0_level2_quad_clean.evt |
| Size (bytes) | 580,763,520 | 79,620,480 |
| Size | 553.9 MB | 75.9 MB |
| Events in quadrant A | 3,600,225 | 500,026 |
| Events in quadrant B | 5,575,566 | 494,288 |
| Events in quadrant C | 3,875,300 | 478,734 |
| Events in quadrant D | 4,086,296 | 473,178 |
| Mode M0 | |||
|---|---|---|---|
| Quadrant | BADHDUFLAG | Total packets | Discarded packets |
| A | 0 | 14807 | 2 |
| B | 0 | 21153 | 2 |
| C | 0 | 15664 | 2 |
| D | 0 | 16663 | 2 |
| Mode SS | |||
|---|---|---|---|
| Quadrant | BADHDUFLAG | Total packets | Discarded packets |
| A | 0 | 138 | 0 |
| B | 0 | 138 | 0 |
| C | 0 | 138 | 0 |
| D | 0 | 138 | 0 |
| Mode M9 | |||
|---|---|---|---|
| Quadrant | BADHDUFLAG | Total packets | Discarded packets |
| A | 0 | 21 | 0 |
| B | 0 | 21 | 0 |
| C | 0 | 21 | 0 |
| D | 0 | 21 | 0 |
| Quadrant | Total seconds | Saturated seconds | Saturation percentage |
|---|---|---|---|
| A | 6664 | 111 | 1.665666% |
| B | 6665 | 216 | 3.240810% |
| C | 6665 | 259 | 3.885971% |
| D | 6665 | 102 | 1.530383% |
Noise dominated data is calculated using 1-second bins in cleaned event files. If a bin has >2000 counts, and if more than 50% of those come from <1% of pixels, then it is considered to be noise-dominated and hence unusable.
| Quadrant | # 1 sec bins | Bins with >0 counts | Bins with >2000 counts | High rate bins dominated by noise | Noise dominated (total time) | Noise dominated (detector-on time) | Marked lightcurve |
|---|---|---|---|---|---|---|---|
| A | 8744 | 6666 | 0 | 0 | 0.00% | 0.00% | 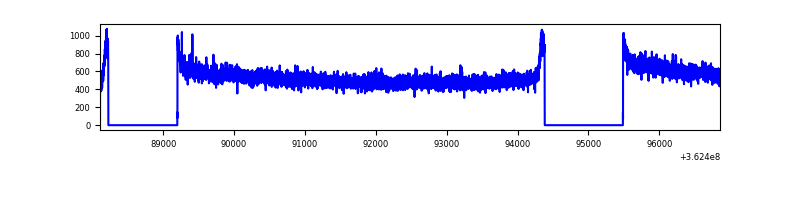 |
| B | 8745 | 6667 | 1 | 1 | 0.01% | 0.01% | 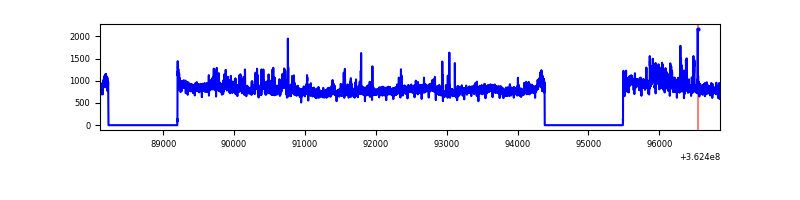 |
| C | 8745 | 6667 | 26 | 26 | 0.30% | 0.39% | 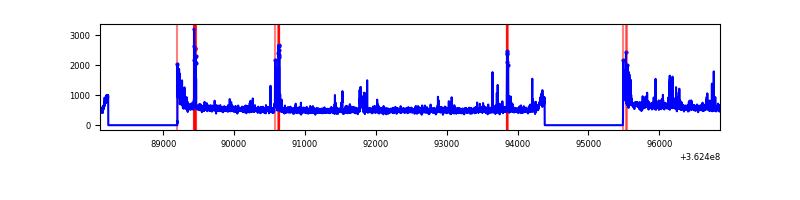 |
| D | 8745 | 6667 | 20 | 20 | 0.23% | 0.30% | 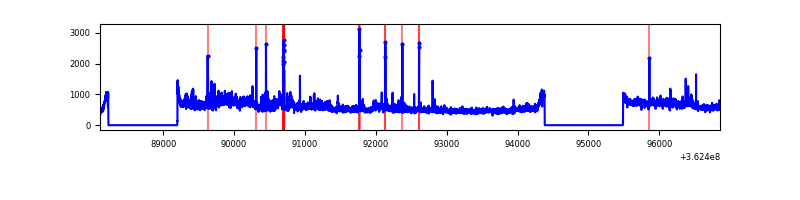 |
Top three noisy pixels from each quadrant. If the there are fewer than three noisy pixels in the level2.evt file, extra rows are filled as -1
| Pixel properties | Quadrant properties | ||||||
|---|---|---|---|---|---|---|---|
| Quadrant | DetID | PixID | Counts | Sigma | Mean | Median | Sigma |
| A | 13 | 170 | 86573 | 474.07 | 910 | 893 | 180.7 |
| A | 13 | 254 | 11903 | 60.92 | 910 | 893 | 180.7 |
| A | 3 | 137 | 8867 | 44.12 | 910 | 893 | 180.7 |
| B | 6 | 159 | 1771373 | 10441.76 | 889 | 868 | 169.6 |
| B | 0 | 190 | 199191 | 1169.63 | 889 | 868 | 169.6 |
| B | 0 | 183 | 73840 | 430.36 | 889 | 868 | 169.6 |
| C | 0 | 10 | 269010 | 1334.45 | 861 | 868 | 200.9 |
| C | 14 | 238 | 140232 | 693.56 | 861 | 868 | 200.9 |
| C | 10 | 22 | 56670 | 277.71 | 861 | 868 | 200.9 |
| D | 8 | 195 | 640252 | 3101.43 | 878 | 857 | 206.2 |
| D | 2 | 250 | 56140 | 268.15 | 878 | 857 | 206.2 |
| D | 2 | 234 | 25496 | 119.51 | 878 | 857 | 206.2 |
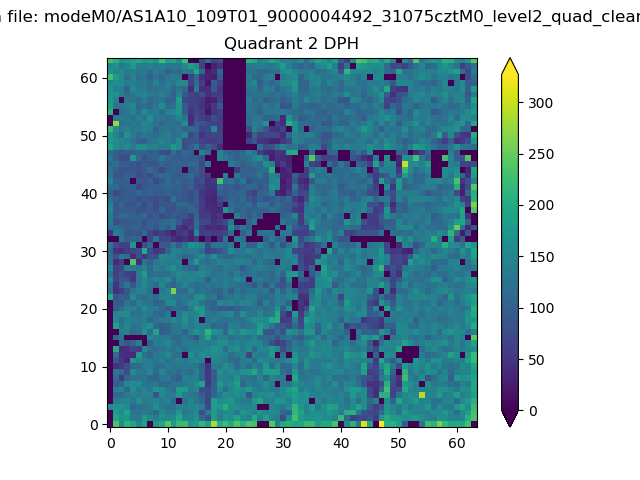
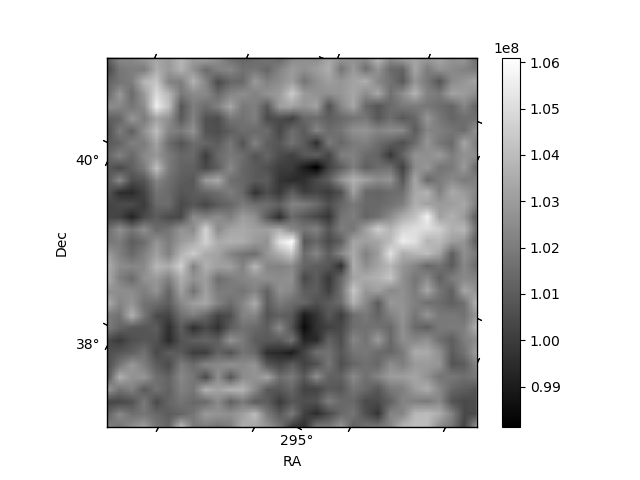
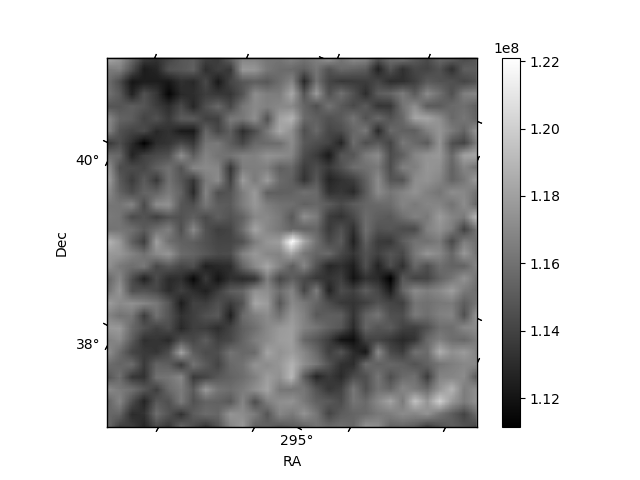
Histogram calculated using DETX and DETY for each event in the final _common_clean file
| Quadrant A | 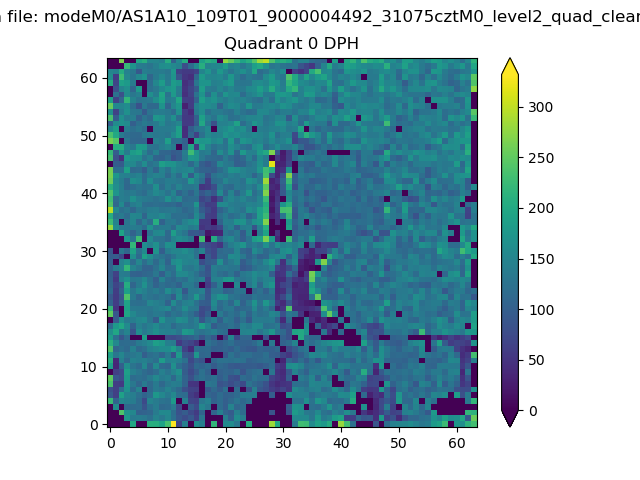 |
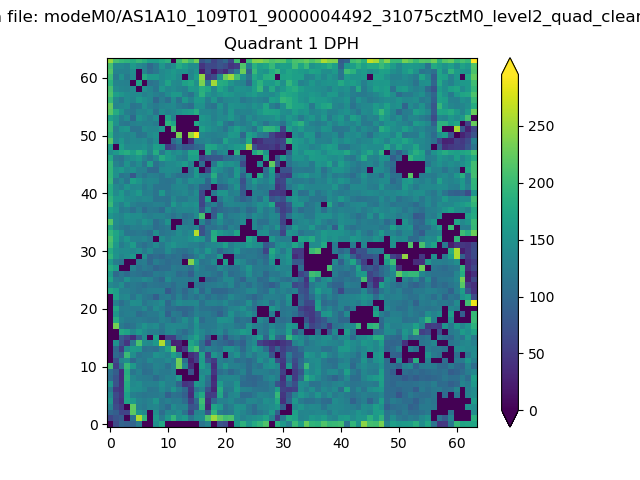 |
Quadrant B |
|---|---|---|---|
| Quadrant D | 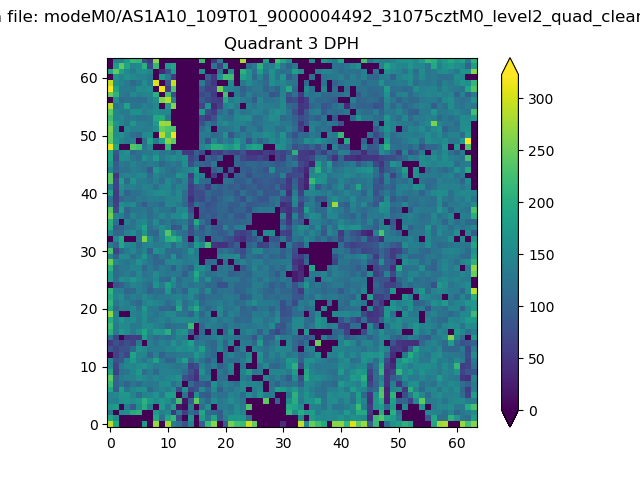 |
 |
Quadrant C |
| Plot type | Count rate plots | Images |
|---|---|---|
| Comparison with Poisson distribution Blue bars denote a histogram of data divided into 1 sec bins. Red curve is a Poisson curve with rate = median count rate of data. |
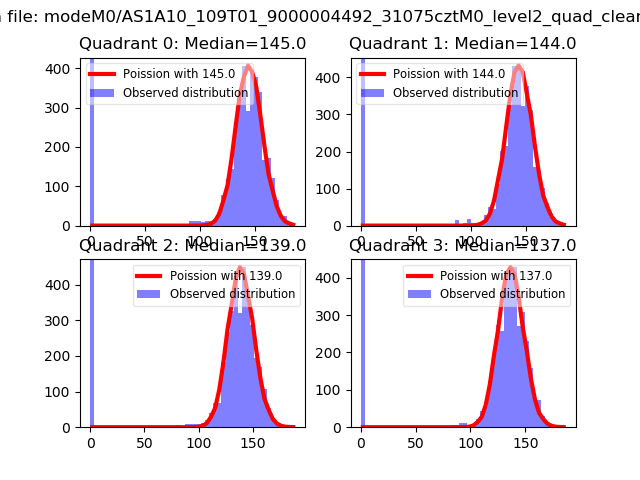 |
 |
| Quadrant-wise count rates Data is divided into 100 sec bins |
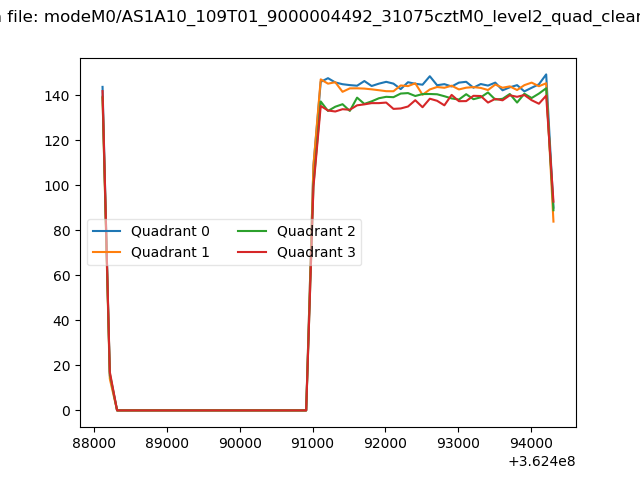 |
|
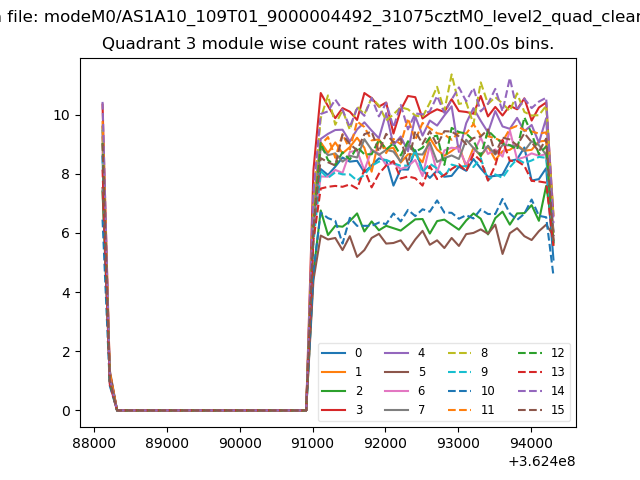
| Module-wise count rates for Quadrant A Data is divided into 100 sec bins |
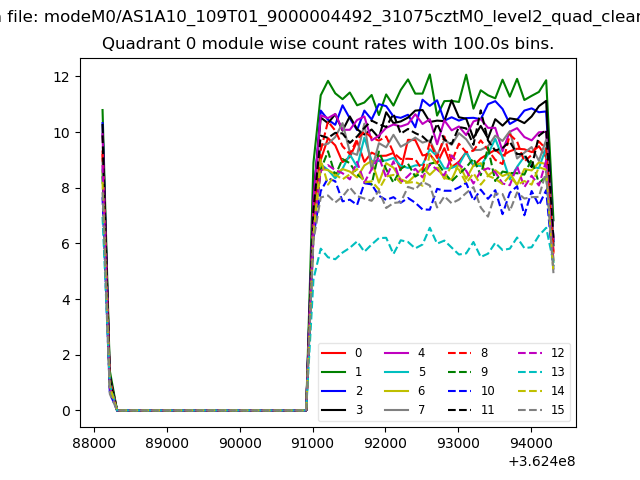 |
 |
| Module-wise count rates for Quadrant B Data is divided into 100 sec bins |
 |
 |
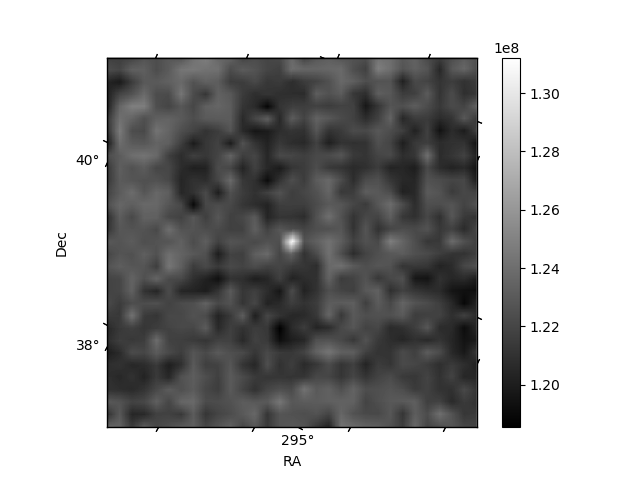
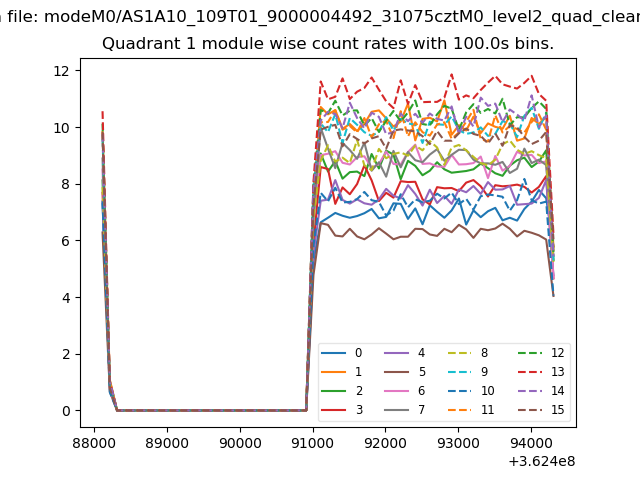
| Module-wise count rates for Quadrant C Data is divided into 100 sec bins |
 |
 |
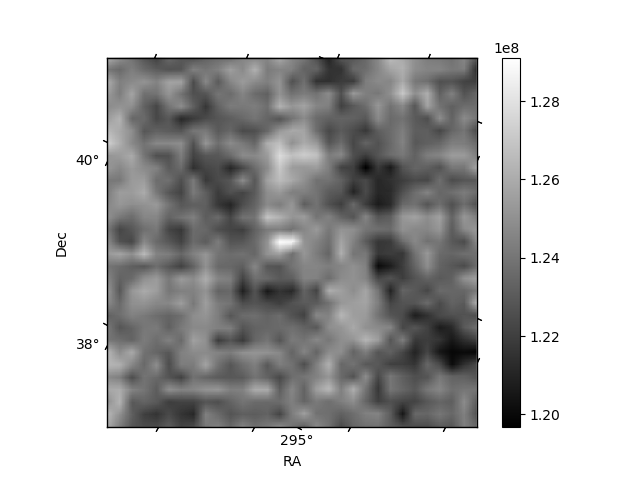
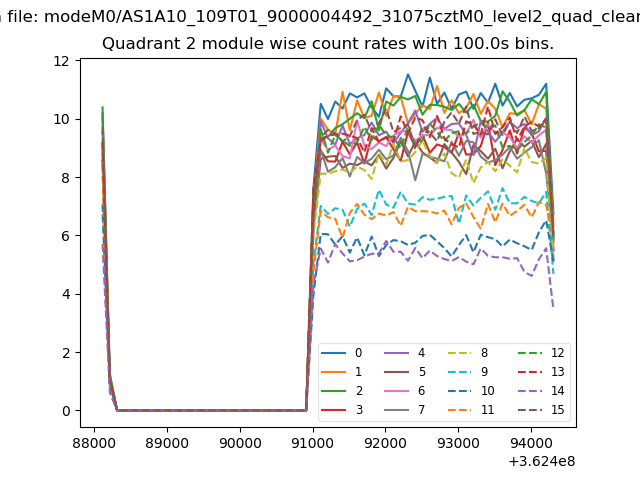
| Module-wise count rates for Quadrant D Data is divided into 100 sec bins |
 |
 |
| Parameter | Plot |
|---|---|
| CZT HV Monitor |  |
| D_VDD | 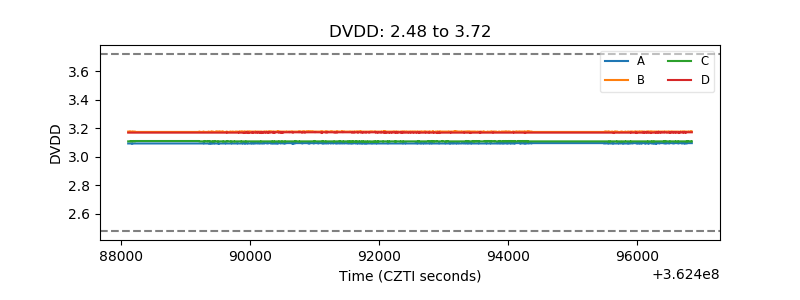 |
| Temperature 1 | 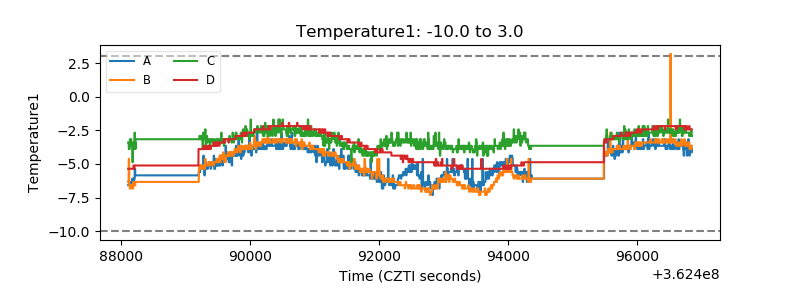 |
| Veto HV Monitor | 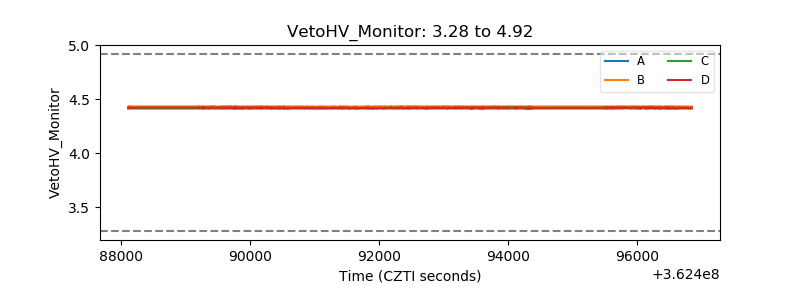 |
| Veto LLD | 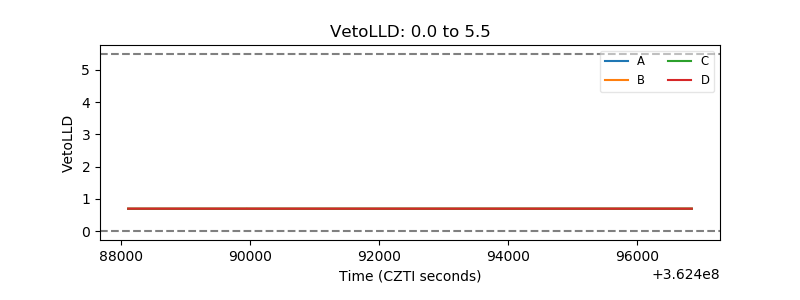 |
| Alpha Counter | 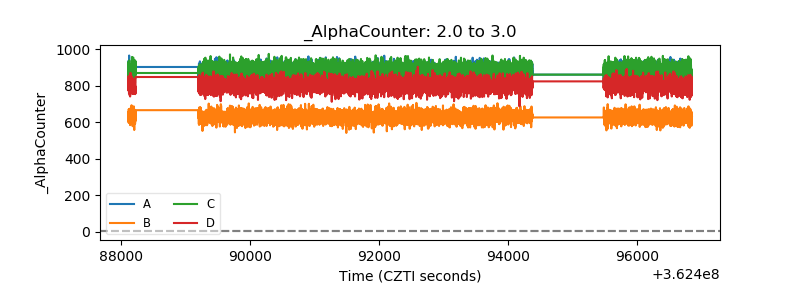 |
| _CPM_Rate | 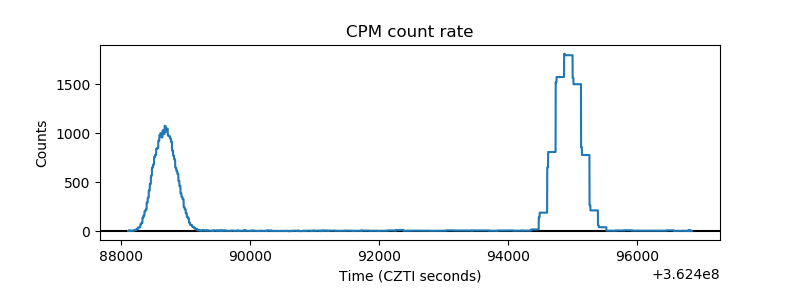 |
| CZT Counter | 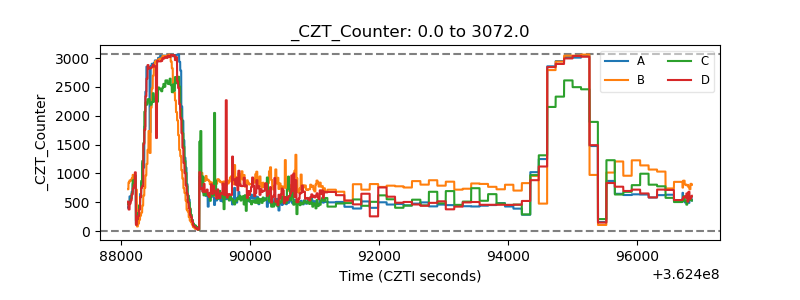 |
| +2.5 Volts monitor | 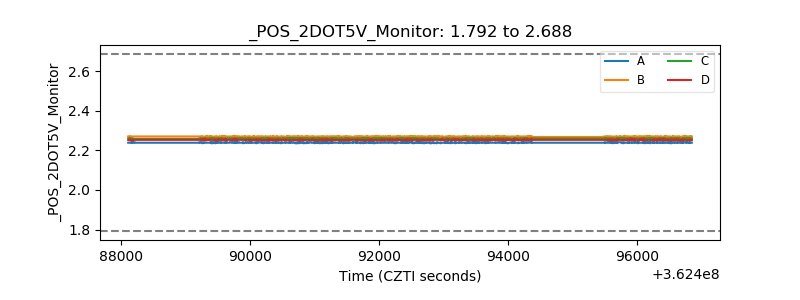 |
| +5 Volts monitor | 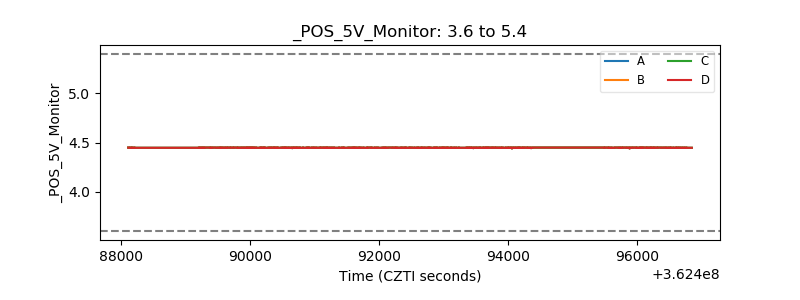 |
| _ROLL_ROT | 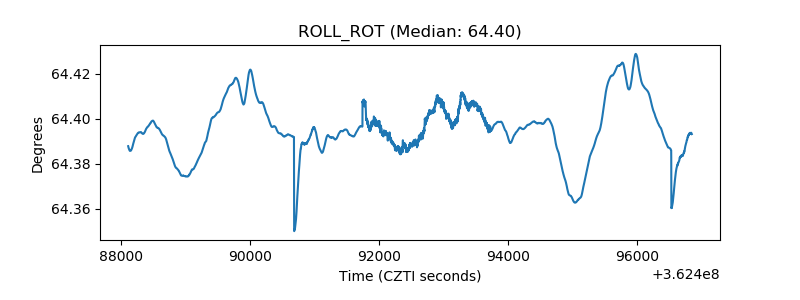 |
| _Roll_DEC | 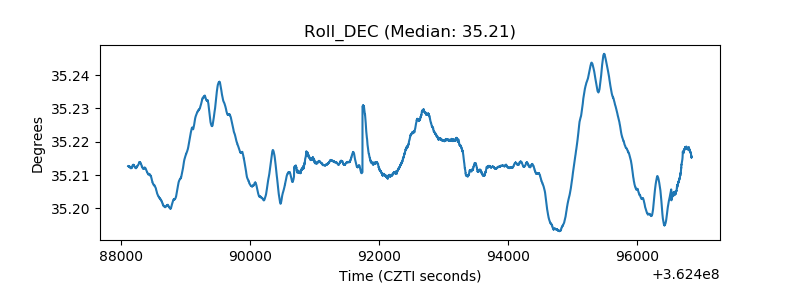 |
| _Roll_RA | 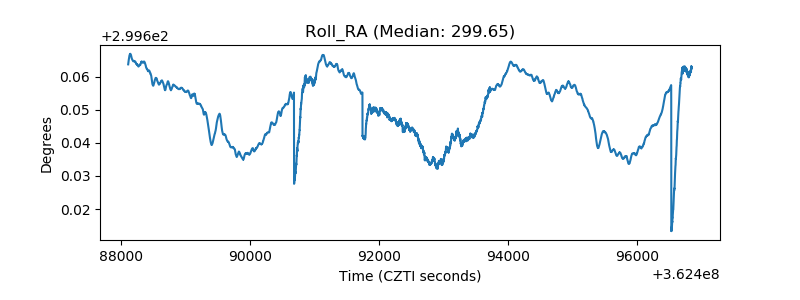 |
| Veto Counter |  |