| Param | Original file | Final file |
|---|---|---|
| Filename | modeM0/AS1A10_109T01_9000004492_31076cztM0_level2.evt | modeM0/AS1A10_109T01_9000004492_31076cztM0_level2_quad_clean.evt |
| Size (bytes) | 565,992,000 | 93,168,000 |
| Size | 539.8 MB | 88.9 MB |
| Events in quadrant A | 3,552,702 | 612,534 |
| Events in quadrant B | 5,381,228 | 603,596 |
| Events in quadrant C | 3,891,457 | 586,189 |
| Events in quadrant D | 3,889,905 | 579,861 |
| Mode M0 | |||
|---|---|---|---|
| Quadrant | BADHDUFLAG | Total packets | Discarded packets |
| A | 0 | 14690 | 2 |
| B | 0 | 20105 | 2 |
| C | 0 | 15769 | 2 |
| D | 0 | 15598 | 2 |
| Mode SS | |||
|---|---|---|---|
| Quadrant | BADHDUFLAG | Total packets | Discarded packets |
| A | 0 | 128 | 0 |
| B | 0 | 128 | 0 |
| C | 0 | 128 | 0 |
| D | 0 | 128 | 0 |
| Mode M9 | |||
|---|---|---|---|
| Quadrant | BADHDUFLAG | Total packets | Discarded packets |
| A | 0 | 24 | 0 |
| B | 0 | 24 | 0 |
| C | 0 | 24 | 0 |
| D | 0 | 24 | 0 |
| Quadrant | Total seconds | Saturated seconds | Saturation percentage |
|---|---|---|---|
| A | 6303 | 80 | 1.269237% |
| B | 6303 | 215 | 3.411074% |
| C | 6303 | 264 | 4.188482% |
| D | 6303 | 65 | 1.031255% |
Noise dominated data is calculated using 1-second bins in cleaned event files. If a bin has >2000 counts, and if more than 50% of those come from <1% of pixels, then it is considered to be noise-dominated and hence unusable.
| Quadrant | # 1 sec bins | Bins with >0 counts | Bins with >2000 counts | High rate bins dominated by noise | Noise dominated (total time) | Noise dominated (detector-on time) | Marked lightcurve |
|---|---|---|---|---|---|---|---|
| A | 8658 | 6305 | 0 | 0 | 0.00% | 0.00% | 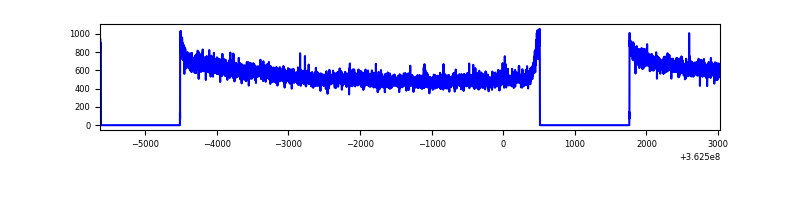 |
| B | 8658 | 6305 | 14 | 14 | 0.16% | 0.22% | 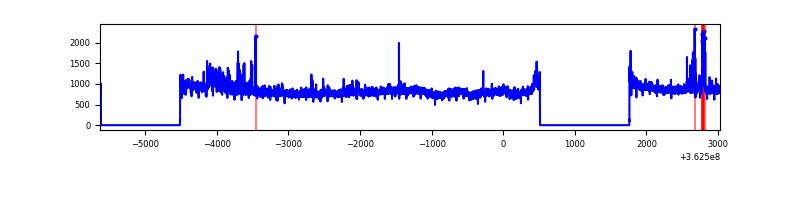 |
| C | 8658 | 6305 | 34 | 34 | 0.39% | 0.54% | 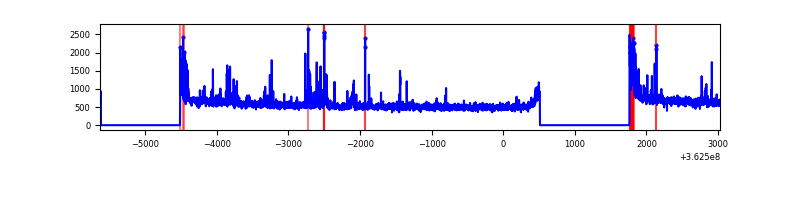 |
| D | 8658 | 6305 | 7 | 7 | 0.08% | 0.11% | 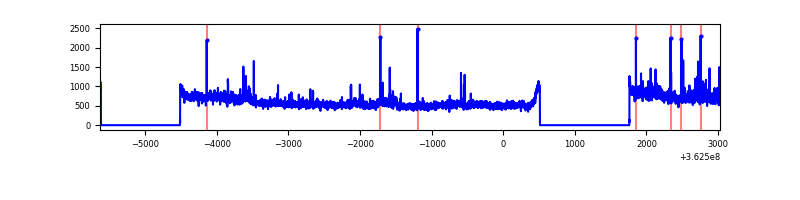 |
Top three noisy pixels from each quadrant. If the there are fewer than three noisy pixels in the level2.evt file, extra rows are filled as -1
| Pixel properties | Quadrant properties | ||||||
|---|---|---|---|---|---|---|---|
| Quadrant | DetID | PixID | Counts | Sigma | Mean | Median | Sigma |
| A | 13 | 170 | 79461 | 441.93 | 900 | 887 | 177.8 |
| A | 13 | 254 | 10812 | 55.82 | 900 | 887 | 177.8 |
| A | 3 | 137 | 8254 | 41.44 | 900 | 887 | 177.8 |
| B | 6 | 159 | 1672488 | 10150.61 | 880 | 861 | 164.7 |
| B | 0 | 190 | 121624 | 733.31 | 880 | 861 | 164.7 |
| B | 0 | 229 | 96749 | 582.26 | 880 | 861 | 164.7 |
| C | 0 | 10 | 249258 | 1242.82 | 858 | 868 | 199.9 |
| C | 14 | 238 | 140540 | 698.85 | 858 | 868 | 199.9 |
| C | 10 | 22 | 106504 | 528.55 | 858 | 868 | 199.9 |
| D | 8 | 195 | 495007 | 2398.14 | 875 | 855 | 206.1 |
| D | 2 | 250 | 34902 | 165.23 | 875 | 855 | 206.1 |
| D | 13 | 174 | 34793 | 164.7 | 875 | 855 | 206.1 |
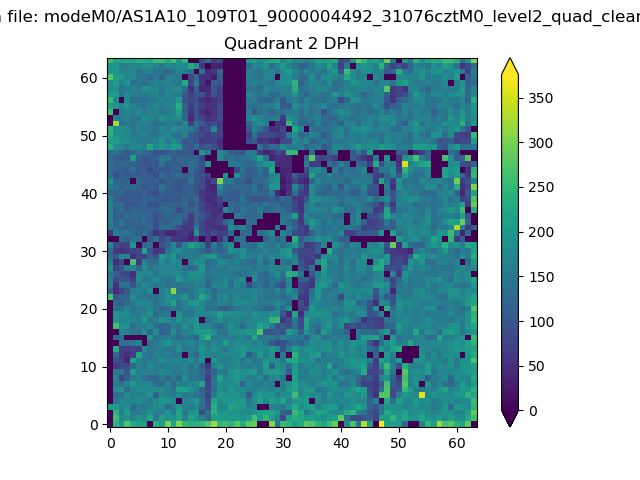
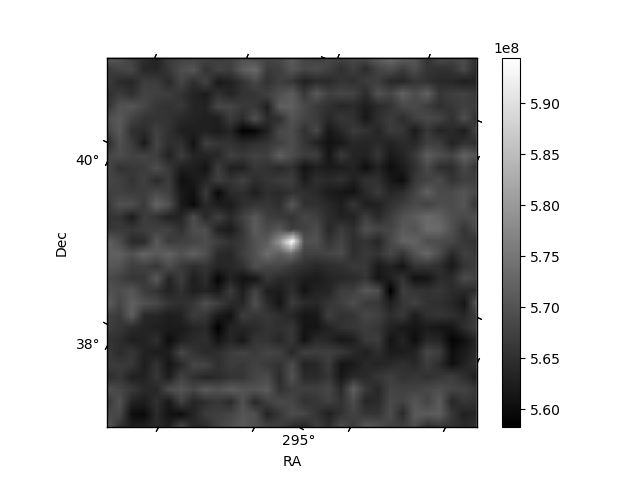
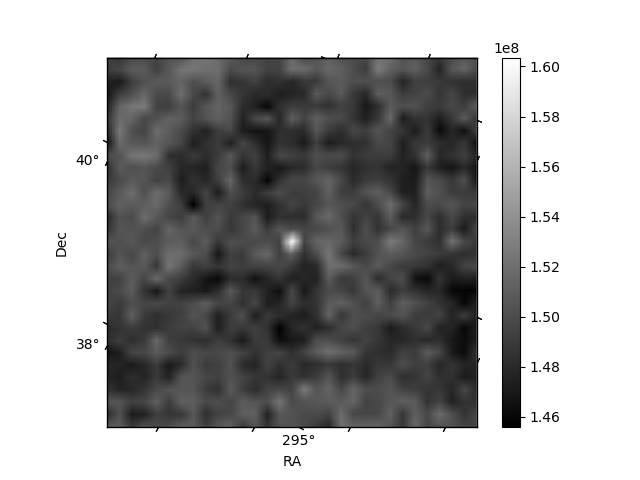
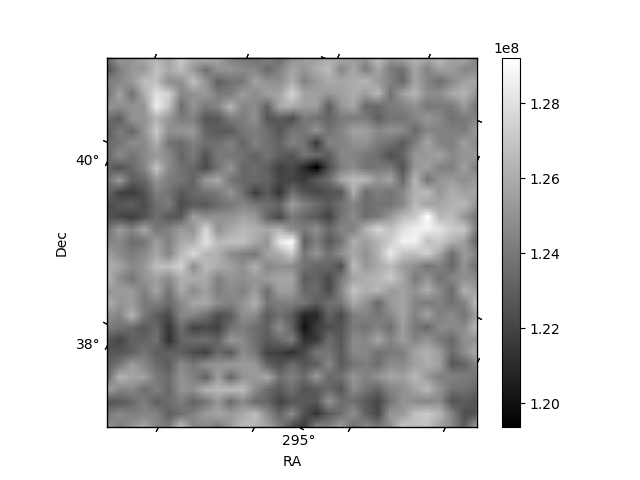
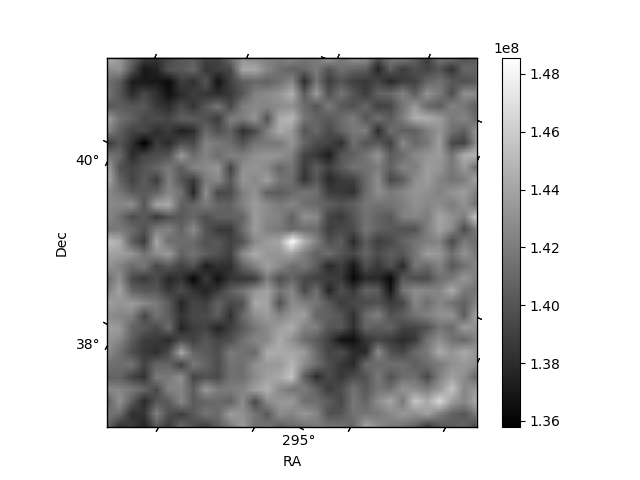
Histogram calculated using DETX and DETY for each event in the final _common_clean file
| Quadrant A | 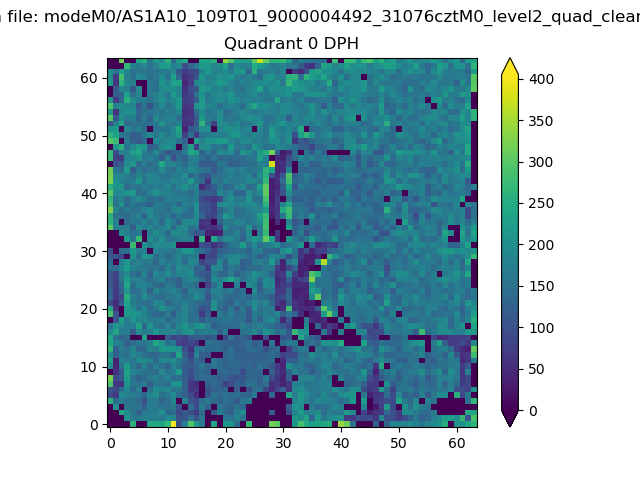 |
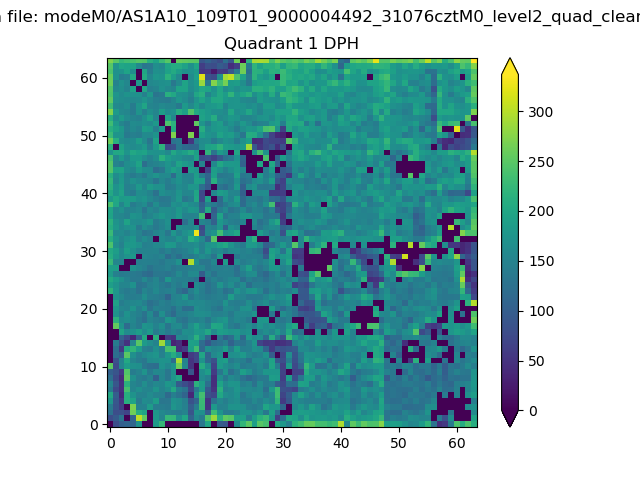 |
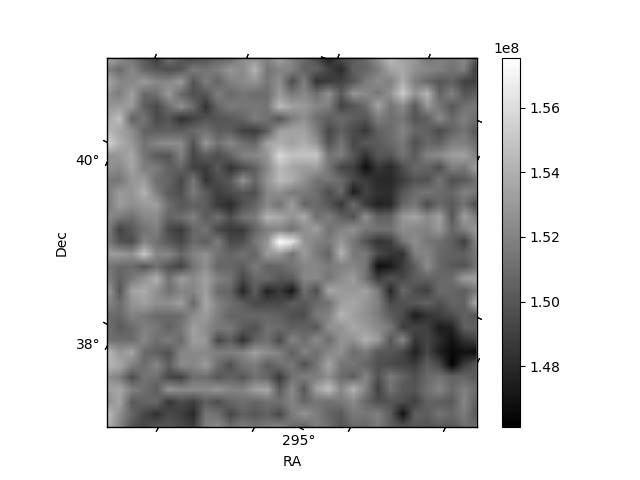
Quadrant B |
|---|---|---|---|
| Quadrant D | 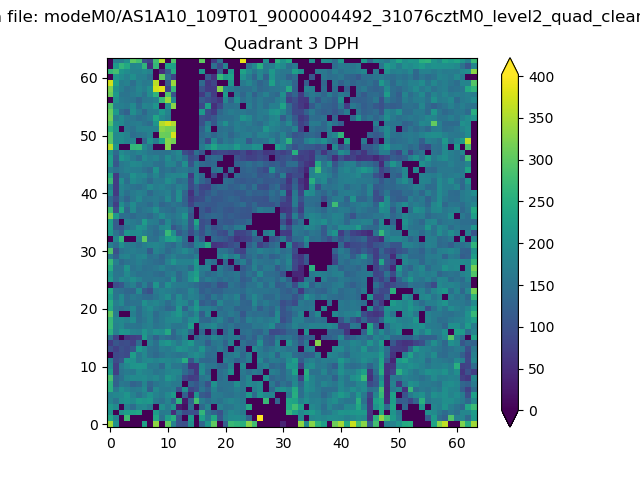 |
 |
Quadrant C |
| Plot type | Count rate plots | Images |
|---|---|---|
| Comparison with Poisson distribution Blue bars denote a histogram of data divided into 1 sec bins. Red curve is a Poisson curve with rate = median count rate of data. |
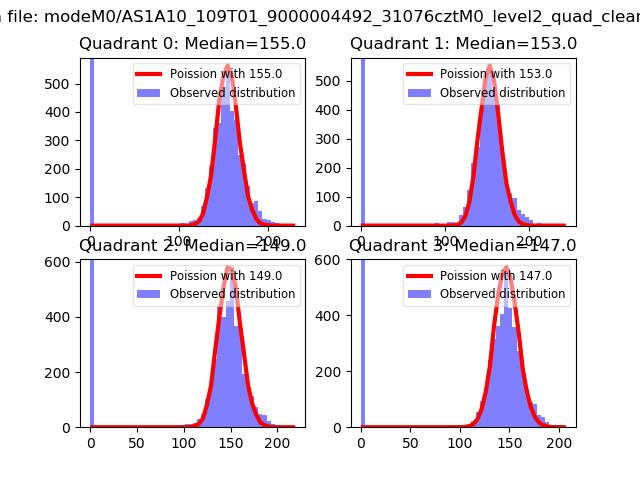 |
 |
| Quadrant-wise count rates Data is divided into 100 sec bins |
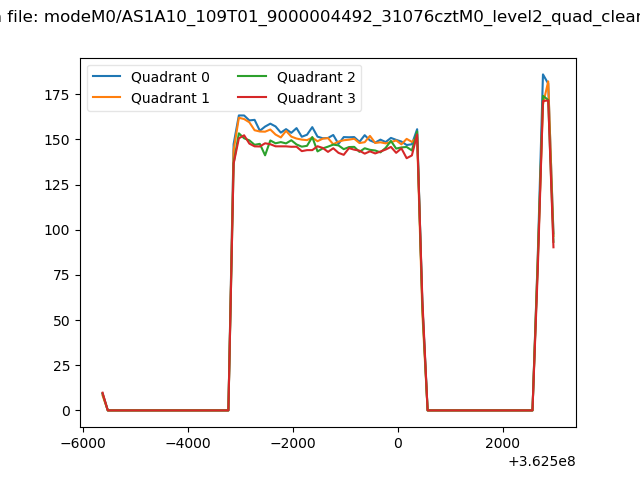 |
|
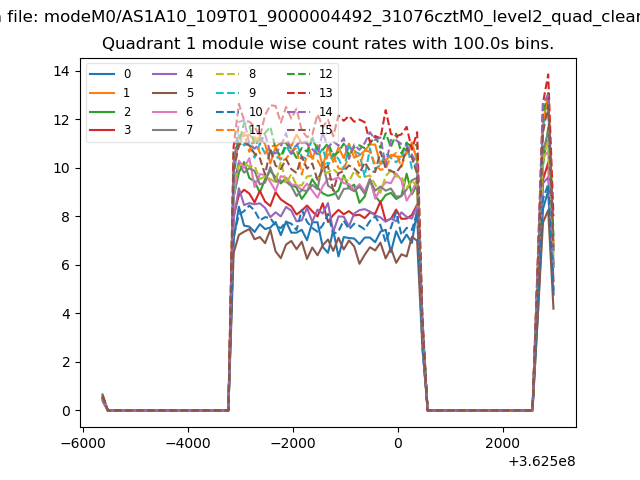
| Module-wise count rates for Quadrant A Data is divided into 100 sec bins |
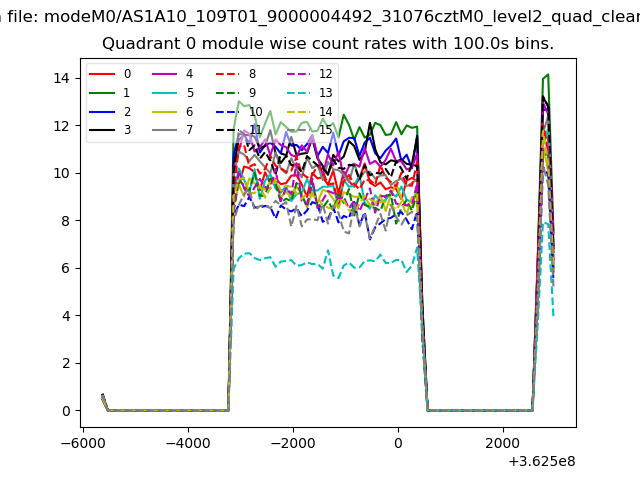 |
 |
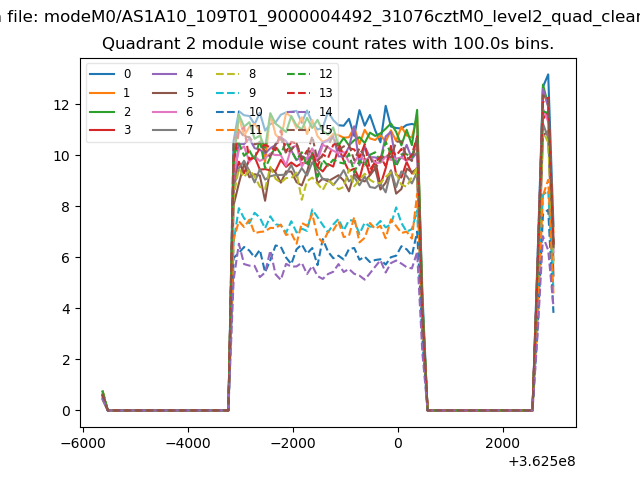
| Module-wise count rates for Quadrant B Data is divided into 100 sec bins |
 |
 |
| Module-wise count rates for Quadrant C Data is divided into 100 sec bins |
 |
 |
| Module-wise count rates for Quadrant D Data is divided into 100 sec bins |
 |
 |
| Parameter | Plot |
|---|---|
| CZT HV Monitor | 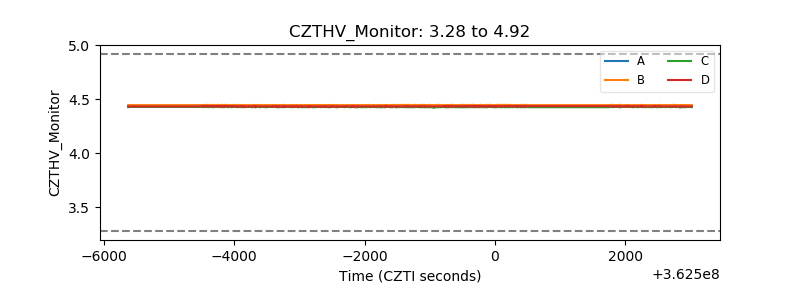 |
| D_VDD | 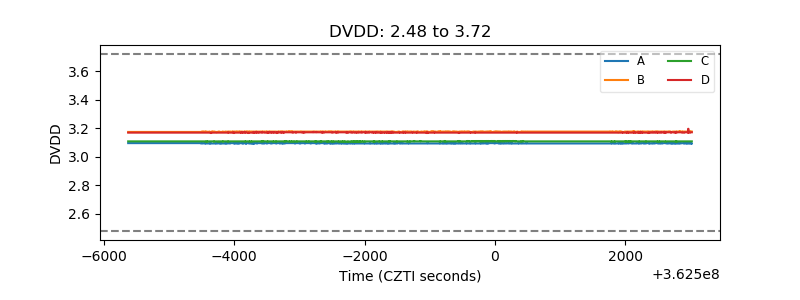 |
| Temperature 1 | 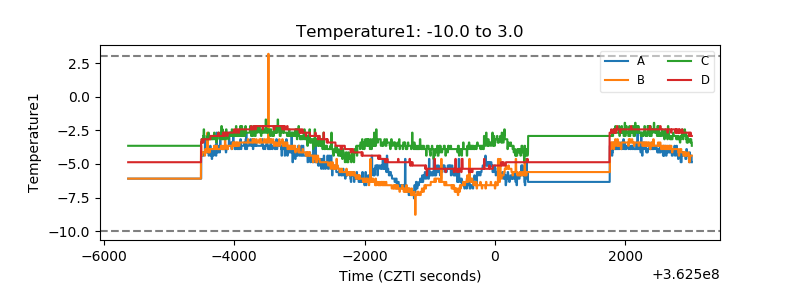 |
| Veto HV Monitor | 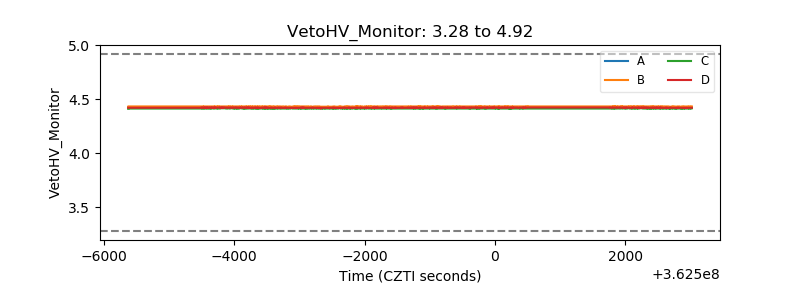 |
| Veto LLD | 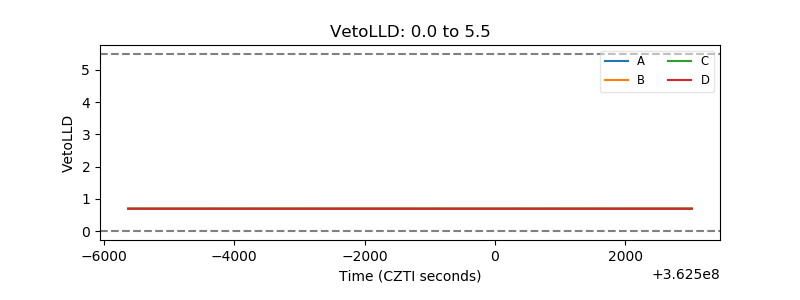 |
| Alpha Counter | 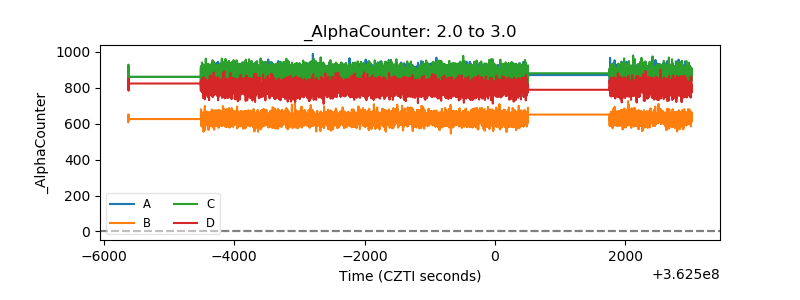 |
| _CPM_Rate | 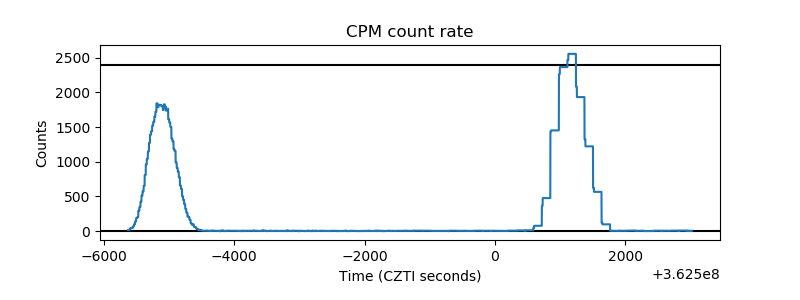 |
| CZT Counter | 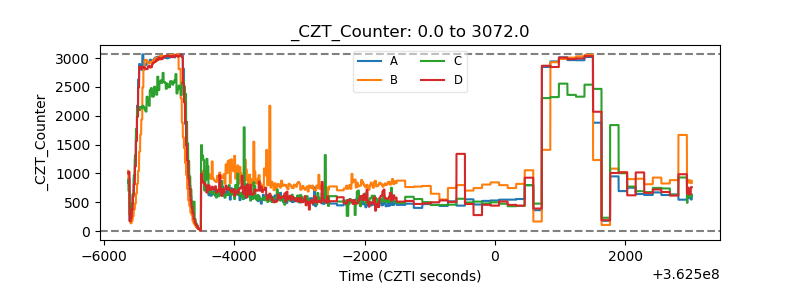 |
| +2.5 Volts monitor |  |
| +5 Volts monitor |  |
| _ROLL_ROT | 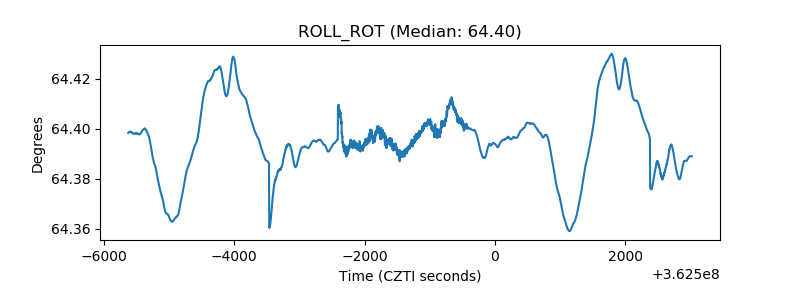 |
| _Roll_DEC | 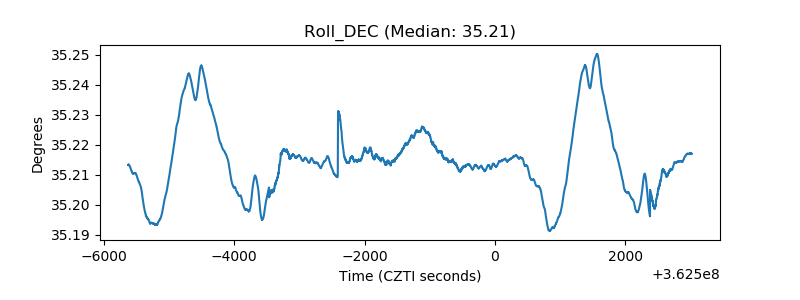 |
| _Roll_RA | 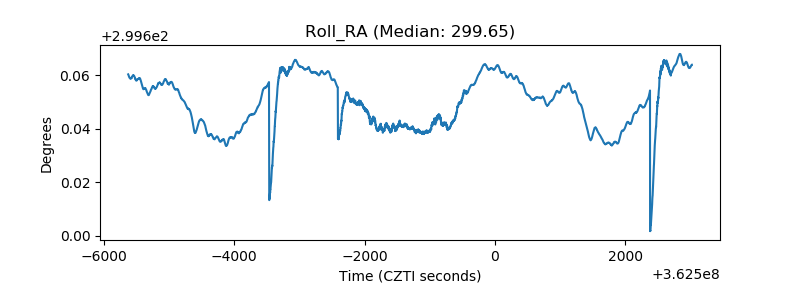 |
| Veto Counter | 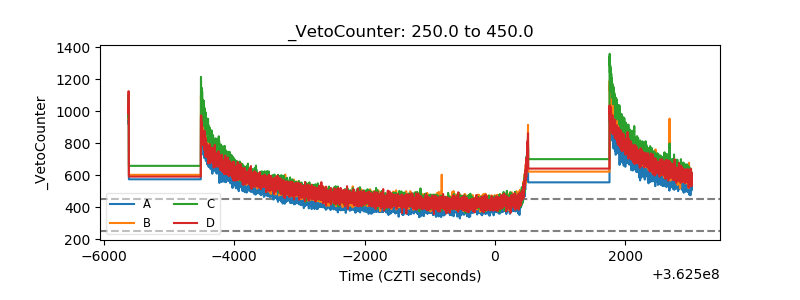 |