| Param | Original file | Final file |
|---|---|---|
| Filename | modeM0/AS1A10_109T01_9000004492_31077cztM0_level2.evt | modeM0/AS1A10_109T01_9000004492_31077cztM0_level2_quad_clean.evt |
| Size (bytes) | 583,819,200 | 109,270,080 |
| Size | 556.8 MB | 104.2 MB |
| Events in quadrant A | 3,623,155 | 735,491 |
| Events in quadrant B | 5,452,284 | 728,934 |
| Events in quadrant C | 3,931,073 | 714,734 |
| Events in quadrant D | 4,253,723 | 695,756 |
| Mode M0 | |||
|---|---|---|---|
| Quadrant | BADHDUFLAG | Total packets | Discarded packets |
| A | 0 | 14880 | 3 |
| B | 0 | 19974 | 2 |
| C | 0 | 15978 | 2 |
| D | 0 | 17042 | 2 |
| Mode SS | |||
|---|---|---|---|
| Quadrant | BADHDUFLAG | Total packets | Discarded packets |
| A | 0 | 126 | 0 |
| B | 0 | 126 | 0 |
| C | 0 | 126 | 0 |
| D | 0 | 126 | 0 |
| Mode M9 | |||
|---|---|---|---|
| Quadrant | BADHDUFLAG | Total packets | Discarded packets |
| A | 0 | 24 | 0 |
| B | 0 | 25 | 0 |
| C | 0 | 25 | 0 |
| D | 0 | 25 | 0 |
| Quadrant | Total seconds | Saturated seconds | Saturation percentage |
|---|---|---|---|
| A | 6227 | 83 | 1.332905% |
| B | 6227 | 226 | 3.629356% |
| C | 6227 | 293 | 4.705316% |
| D | 6227 | 82 | 1.316846% |
Noise dominated data is calculated using 1-second bins in cleaned event files. If a bin has >2000 counts, and if more than 50% of those come from <1% of pixels, then it is considered to be noise-dominated and hence unusable.
| Quadrant | # 1 sec bins | Bins with >0 counts | Bins with >2000 counts | High rate bins dominated by noise | Noise dominated (total time) | Noise dominated (detector-on time) | Marked lightcurve |
|---|---|---|---|---|---|---|---|
| A | 7557 | 6228 | 2 | 2 | 0.03% | 0.03% |  |
| B | 7557 | 6228 | 37 | 37 | 0.49% | 0.59% |  |
| C | 7557 | 6228 | 38 | 38 | 0.50% | 0.61% |  |
| D | 7557 | 6228 | 9 | 9 | 0.12% | 0.14% |  |
Top three noisy pixels from each quadrant. If the there are fewer than three noisy pixels in the level2.evt file, extra rows are filled as -1
| Pixel properties | Quadrant properties | ||||||
|---|---|---|---|---|---|---|---|
| Quadrant | DetID | PixID | Counts | Sigma | Mean | Median | Sigma |
| A | 13 | 170 | 74750 | 409.97 | 915 | 903 | 180.1 |
| A | 12 | 96 | 17621 | 92.81 | 915 | 903 | 180.1 |
| A | 13 | 254 | 11435 | 58.47 | 915 | 903 | 180.1 |
| B | 6 | 159 | 1691578 | 10214.21 | 897 | 879 | 165.5 |
| B | 0 | 229 | 200913 | 1208.49 | 897 | 879 | 165.5 |
| B | 12 | 111 | 19232 | 110.88 | 897 | 879 | 165.5 |
| C | 0 | 10 | 225898 | 1104.44 | 882 | 891 | 203.7 |
| C | 14 | 238 | 144938 | 707.05 | 882 | 891 | 203.7 |
| C | 10 | 22 | 81630 | 396.3 | 882 | 891 | 203.7 |
| D | 8 | 195 | 684487 | 3277.29 | 895 | 878 | 208.6 |
| D | 13 | 174 | 145972 | 695.6 | 895 | 878 | 208.6 |
| D | 2 | 250 | 32441 | 151.32 | 895 | 878 | 208.6 |
Histogram calculated using DETX and DETY for each event in the final _common_clean file
| Quadrant A |  |
 |
Quadrant B |
|---|---|---|---|
| Quadrant D |  |
 |
Quadrant C |
| Plot type | Count rate plots | Images |
|---|---|---|
| Comparison with Poisson distribution Blue bars denote a histogram of data divided into 1 sec bins. Red curve is a Poisson curve with rate = median count rate of data. |
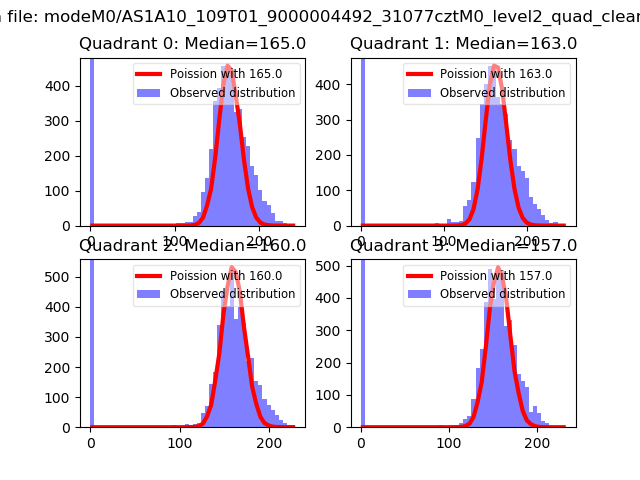 |
 |
| Quadrant-wise count rates Data is divided into 100 sec bins |
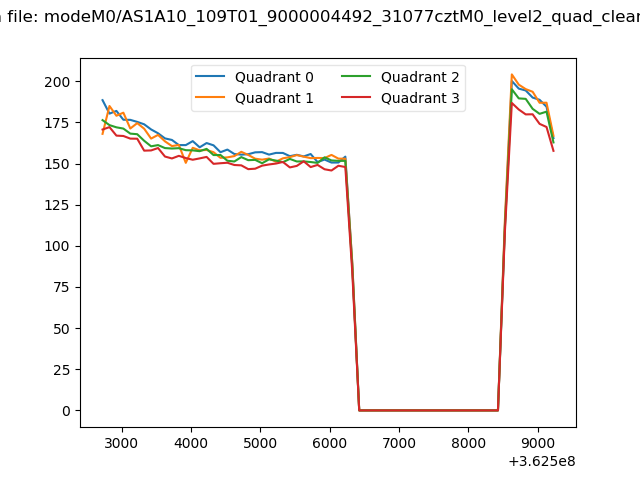 |
|
| Module-wise count rates for Quadrant A Data is divided into 100 sec bins |
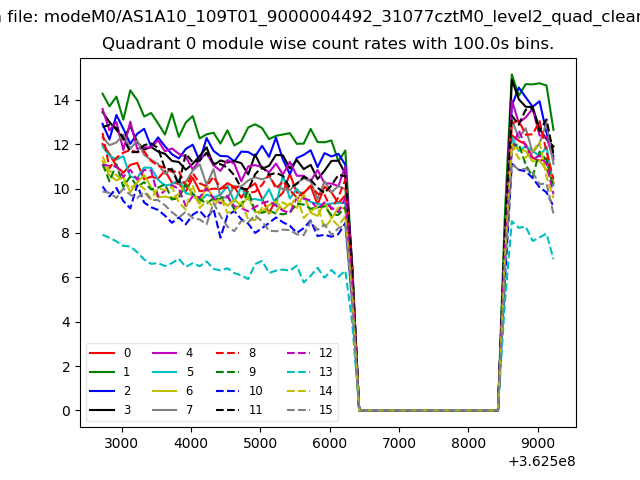 |
 |
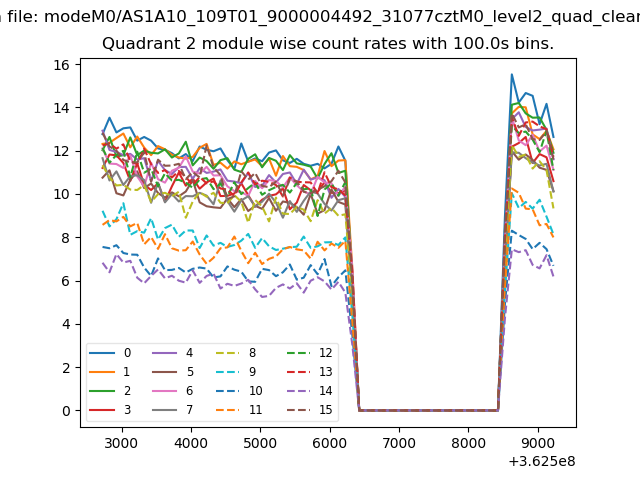
| Module-wise count rates for Quadrant B Data is divided into 100 sec bins |
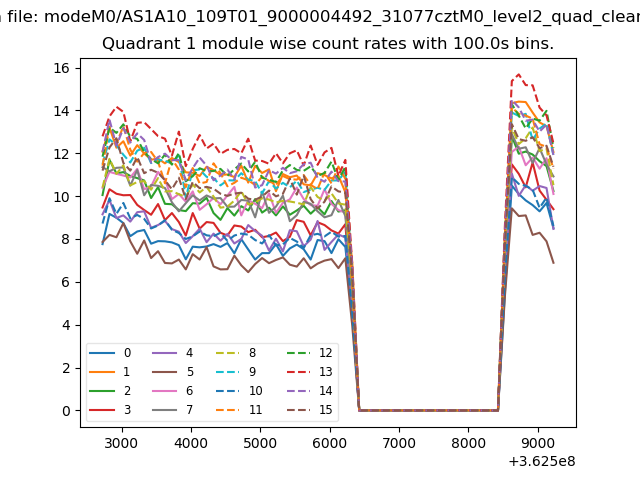 |
 |
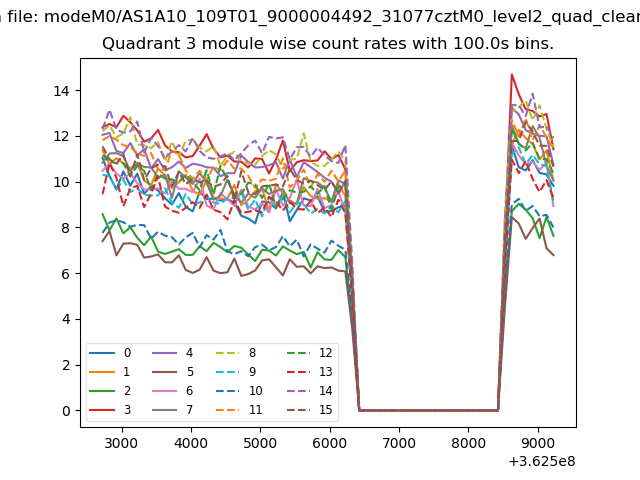
| Module-wise count rates for Quadrant C Data is divided into 100 sec bins |
 |
 |
| Module-wise count rates for Quadrant D Data is divided into 100 sec bins |
 |
 |
| Parameter | Plot |
|---|---|
| CZT HV Monitor | 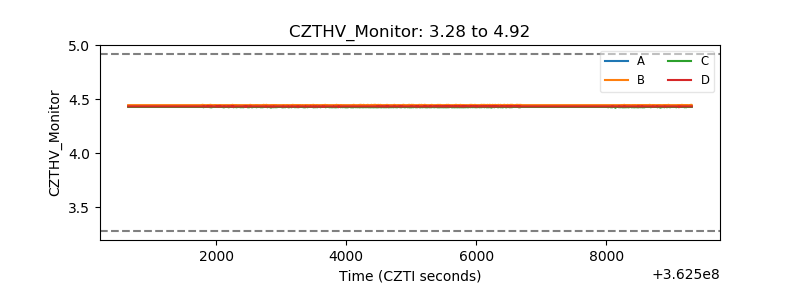 |
| D_VDD |  |
| Temperature 1 |  |
| Veto HV Monitor |  |
| Veto LLD |  |
| Alpha Counter | 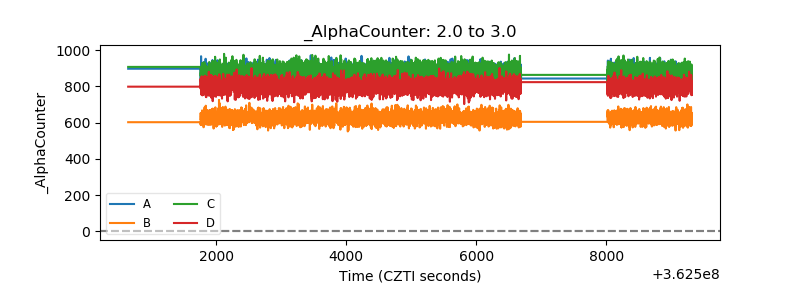 |
| _CPM_Rate | 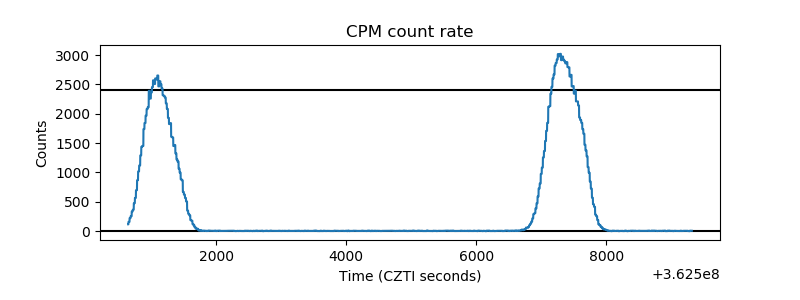 |
| CZT Counter |  |
| +2.5 Volts monitor |  |
| +5 Volts monitor |  |
| _ROLL_ROT | 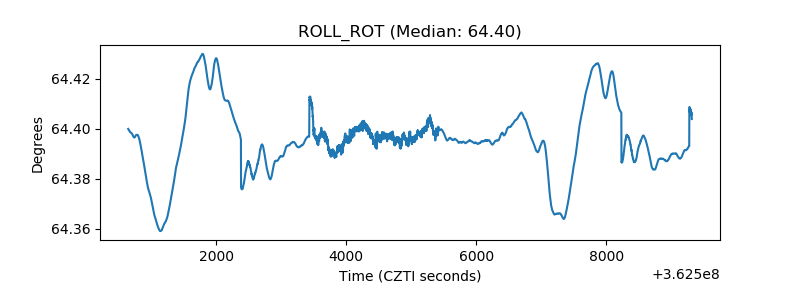 |
| _Roll_DEC | 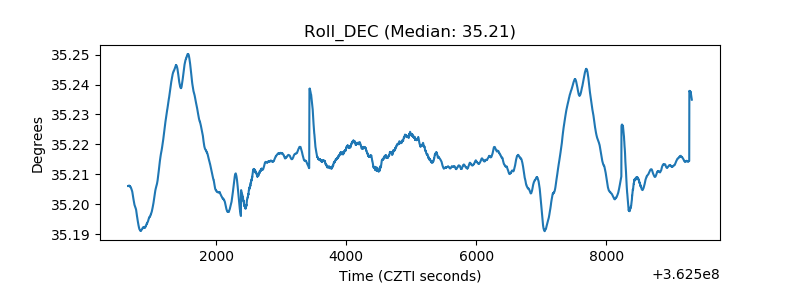 |
| _Roll_RA |  |
| Veto Counter | 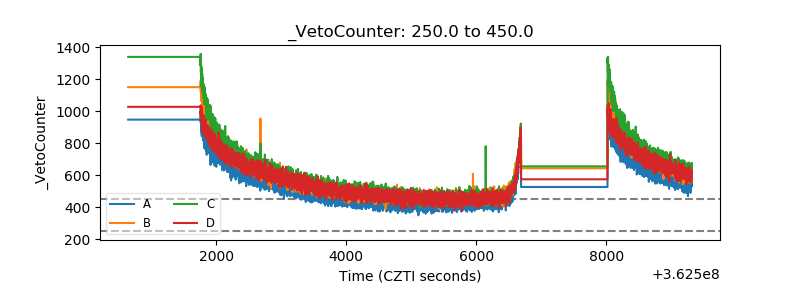 |