| Param | Original file | Final file |
|---|---|---|
| Filename | modeM0/AS1A10_109T01_9000004492_31078cztM0_level2.evt | modeM0/AS1A10_109T01_9000004492_31078cztM0_level2_quad_clean.evt |
| Size (bytes) | 569,756,160 | 120,706,560 |
| Size | 543.4 MB | 115.1 MB |
| Events in quadrant A | 3,503,041 | 820,104 |
| Events in quadrant B | 5,187,286 | 826,235 |
| Events in quadrant C | 3,973,575 | 806,616 |
| Events in quadrant D | 4,178,468 | 776,866 |
| Mode M0 | |||
|---|---|---|---|
| Quadrant | BADHDUFLAG | Total packets | Discarded packets |
| A | 0 | 14378 | 2 |
| B | 0 | 19039 | 2 |
| C | 0 | 15898 | 2 |
| D | 0 | 16458 | 2 |
| Mode SS | |||
|---|---|---|---|
| Quadrant | BADHDUFLAG | Total packets | Discarded packets |
| A | 0 | 124 | 0 |
| B | 0 | 124 | 0 |
| C | 0 | 124 | 0 |
| D | 0 | 124 | 0 |
| Mode M9 | |||
|---|---|---|---|
| Quadrant | BADHDUFLAG | Total packets | Discarded packets |
| A | 0 | 24 | 0 |
| B | 0 | 25 | 0 |
| C | 0 | 25 | 0 |
| D | 0 | 25 | 0 |
| Quadrant | Total seconds | Saturated seconds | Saturation percentage |
|---|---|---|---|
| A | 6104 | 74 | 1.212320% |
| B | 6104 | 148 | 2.424640% |
| C | 6104 | 267 | 4.374181% |
| D | 6104 | 152 | 2.490170% |
Noise dominated data is calculated using 1-second bins in cleaned event files. If a bin has >2000 counts, and if more than 50% of those come from <1% of pixels, then it is considered to be noise-dominated and hence unusable.
| Quadrant | # 1 sec bins | Bins with >0 counts | Bins with >2000 counts | High rate bins dominated by noise | Noise dominated (total time) | Noise dominated (detector-on time) | Marked lightcurve |
|---|---|---|---|---|---|---|---|
| A | 7499 | 6105 | 4 | 4 | 0.05% | 0.07% | 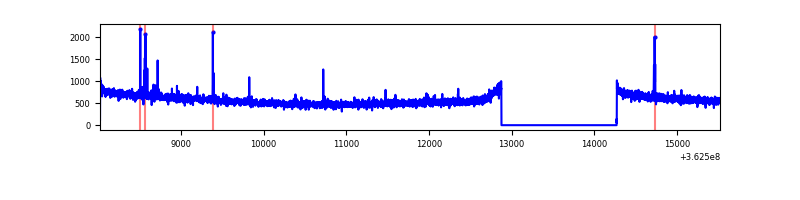 |
| B | 7499 | 6105 | 0 | 0 | 0.00% | 0.00% | 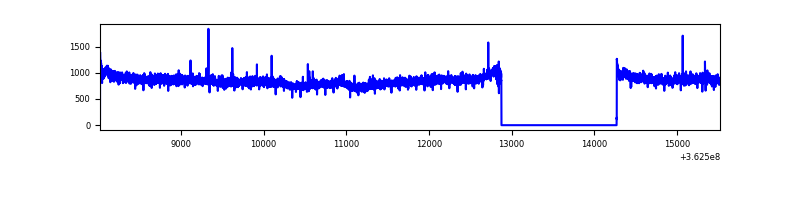 |
| C | 7499 | 6105 | 36 | 36 | 0.48% | 0.59% | 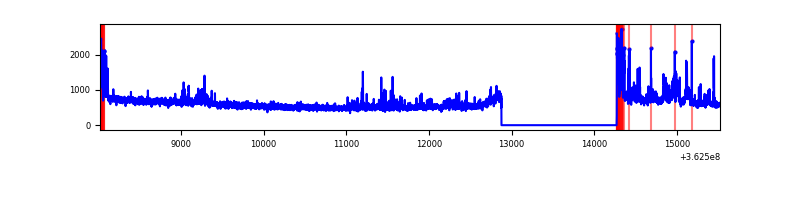 |
| D | 7499 | 6105 | 82 | 82 | 1.09% | 1.34% | 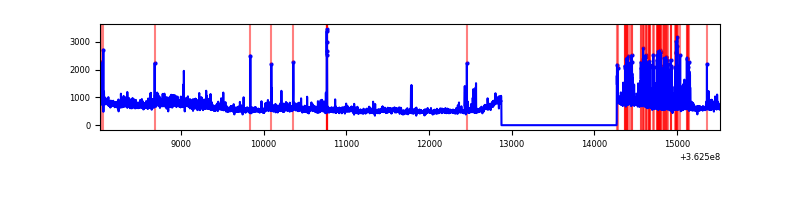 |
Top three noisy pixels from each quadrant. If the there are fewer than three noisy pixels in the level2.evt file, extra rows are filled as -1
| Pixel properties | Quadrant properties | ||||||
|---|---|---|---|---|---|---|---|
| Quadrant | DetID | PixID | Counts | Sigma | Mean | Median | Sigma |
| A | 13 | 170 | 44006 | 247.83 | 886 | 873 | 174.0 |
| A | 12 | 96 | 38590 | 216.71 | 886 | 873 | 174.0 |
| A | 13 | 254 | 11304 | 59.93 | 886 | 873 | 174.0 |
| B | 6 | 159 | 1714485 | 10517.87 | 878 | 859 | 162.9 |
| B | 12 | 111 | 18786 | 110.03 | 878 | 859 | 162.9 |
| B | 11 | 111 | 17407 | 101.57 | 878 | 859 | 162.9 |
| C | 0 | 10 | 276705 | 1386.13 | 864 | 876 | 199.0 |
| C | 10 | 22 | 144537 | 721.94 | 864 | 876 | 199.0 |
| C | 14 | 238 | 141096 | 704.65 | 864 | 876 | 199.0 |
| D | 8 | 195 | 494062 | 2431.25 | 867 | 850 | 202.9 |
| D | 13 | 174 | 323441 | 1590.19 | 867 | 850 | 202.9 |
| D | 2 | 250 | 43656 | 211.01 | 867 | 850 | 202.9 |
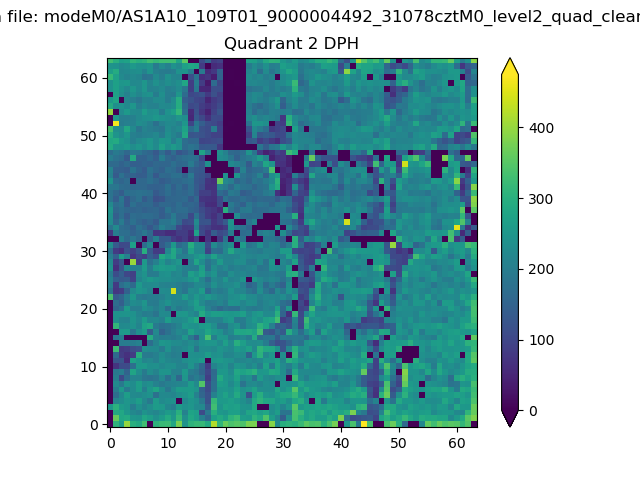
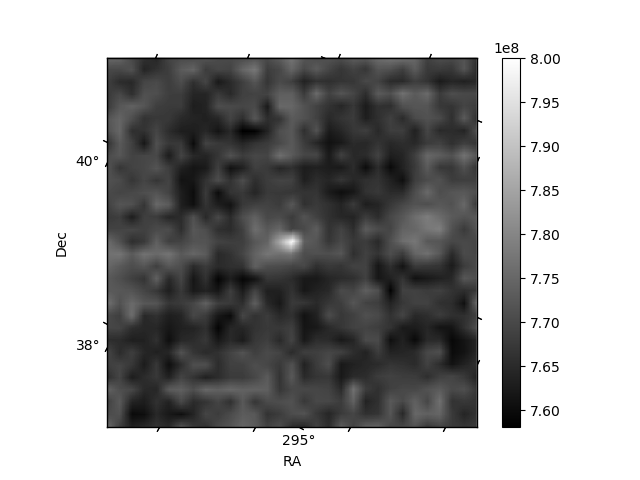
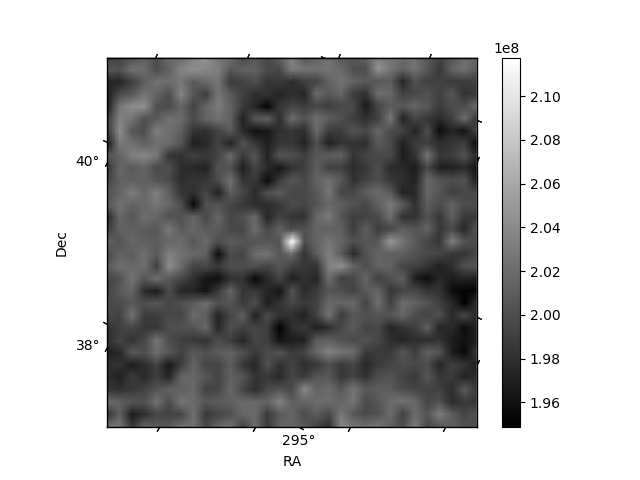
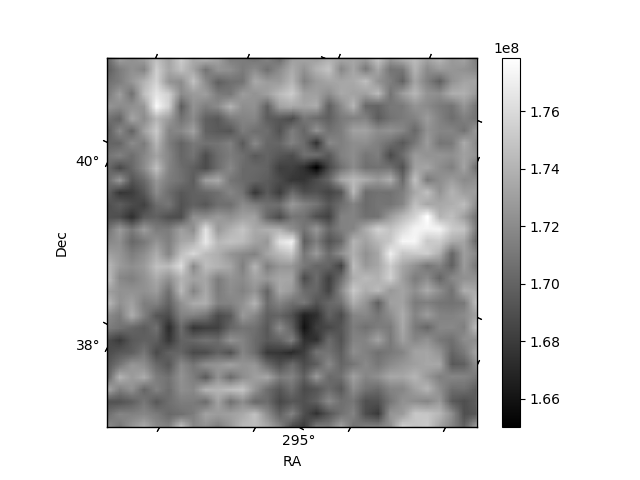
Histogram calculated using DETX and DETY for each event in the final _common_clean file
| Quadrant A | 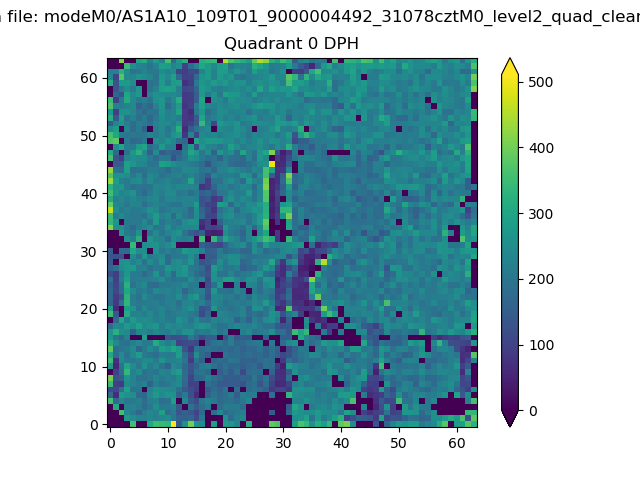 |
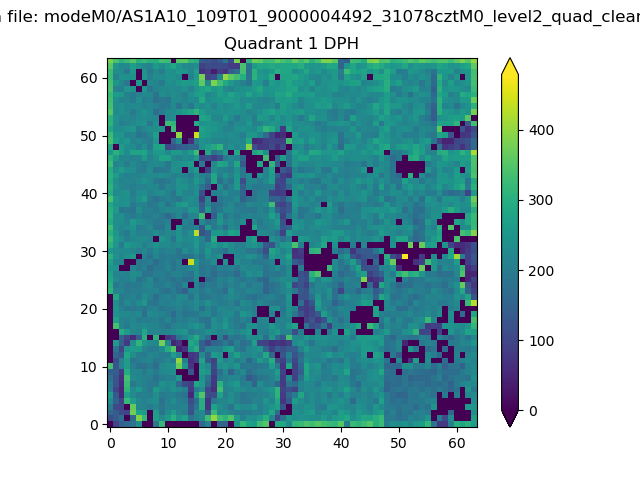 |
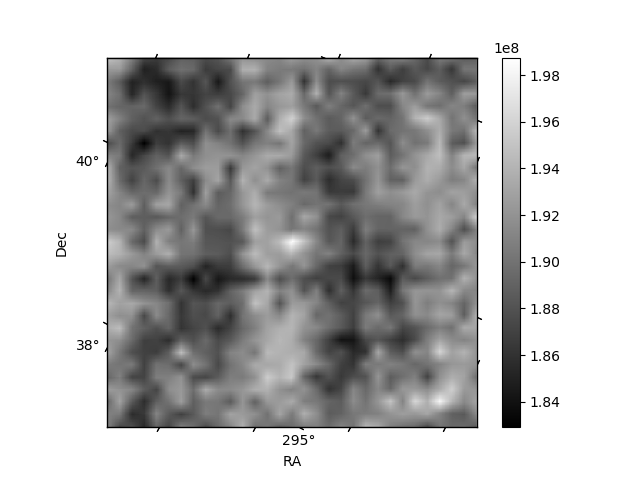
Quadrant B |
|---|---|---|---|
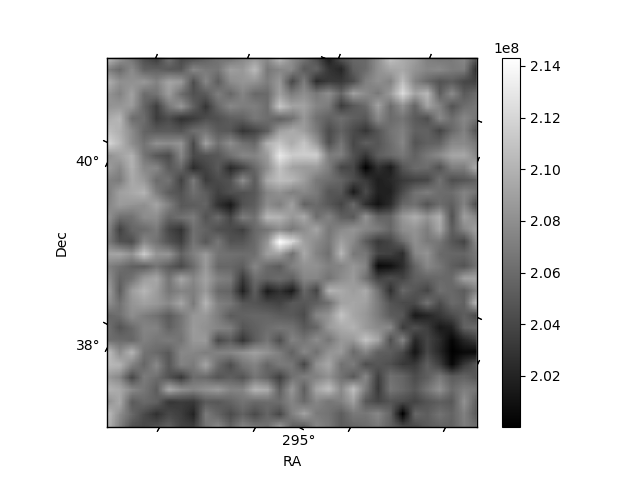
| Quadrant D | 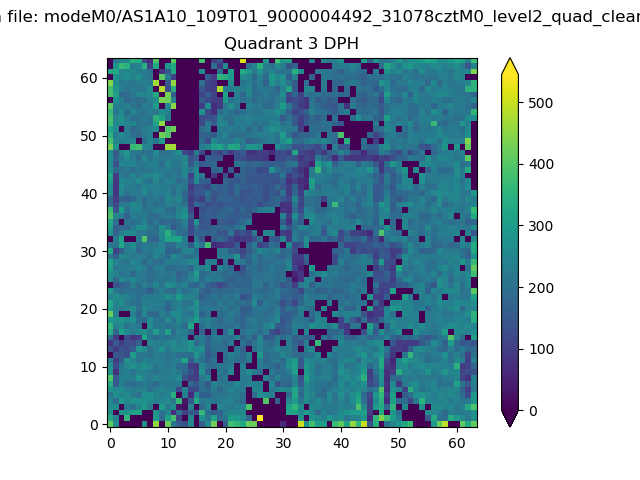 |
 |
Quadrant C |
| Plot type | Count rate plots | Images |
|---|---|---|
| Comparison with Poisson distribution Blue bars denote a histogram of data divided into 1 sec bins. Red curve is a Poisson curve with rate = median count rate of data. |
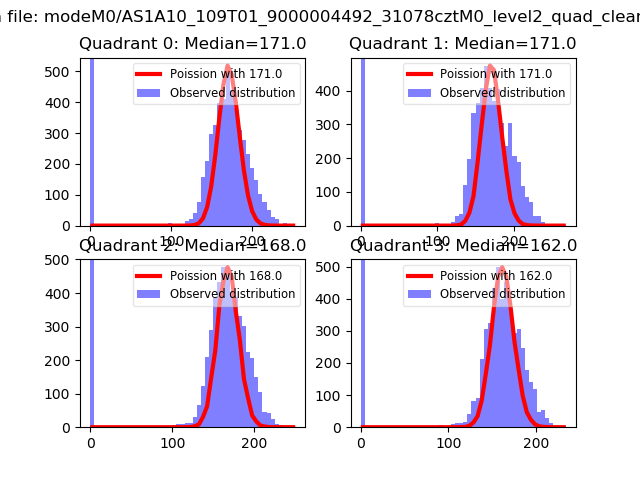 |
 |
| Quadrant-wise count rates Data is divided into 100 sec bins |
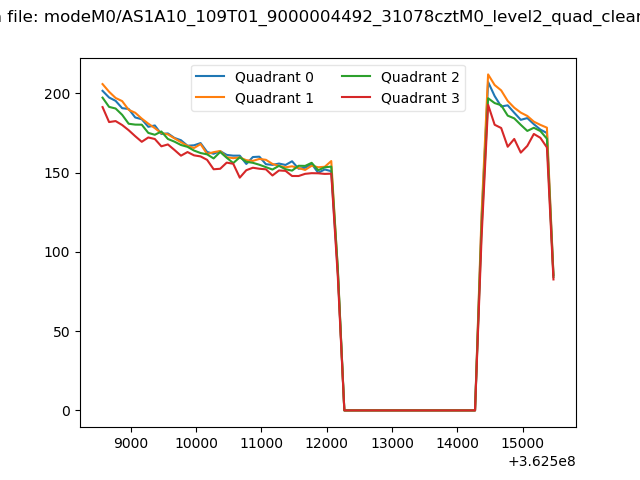 |
|
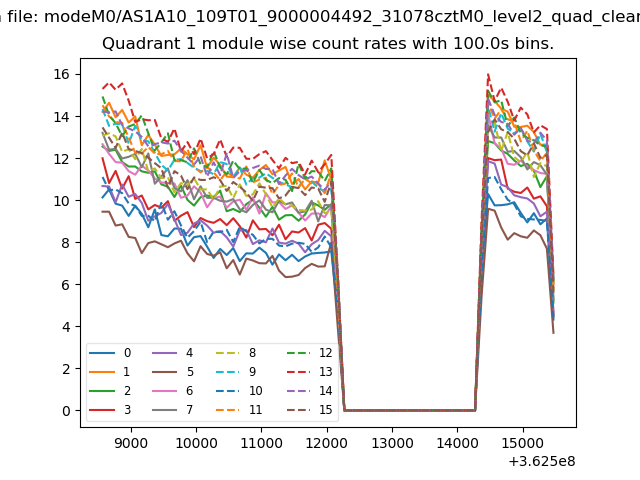
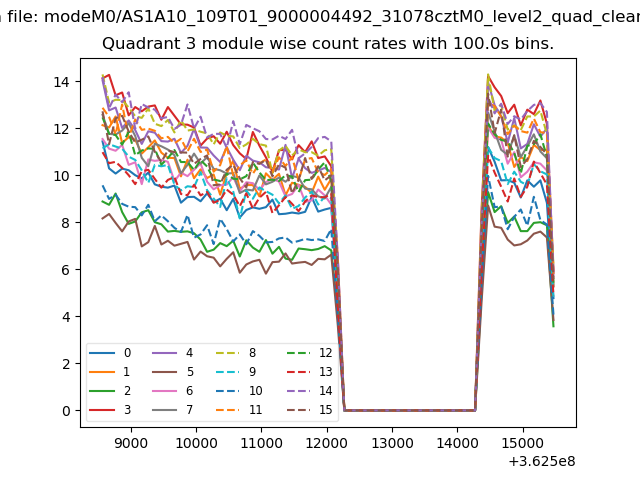
| Module-wise count rates for Quadrant A Data is divided into 100 sec bins |
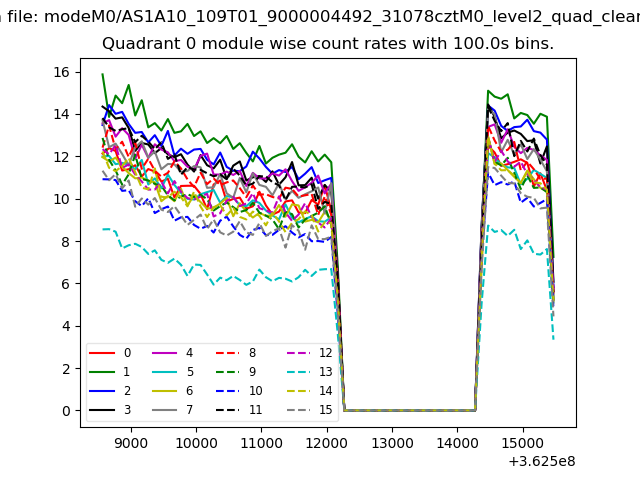 |
 |
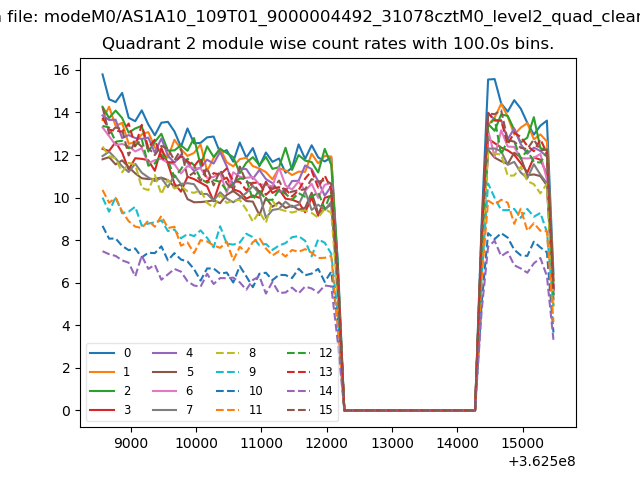
| Module-wise count rates for Quadrant B Data is divided into 100 sec bins |
 |
 |
| Module-wise count rates for Quadrant C Data is divided into 100 sec bins |
 |
 |
| Module-wise count rates for Quadrant D Data is divided into 100 sec bins |
 |
 |
| Parameter | Plot |
|---|---|
| CZT HV Monitor | 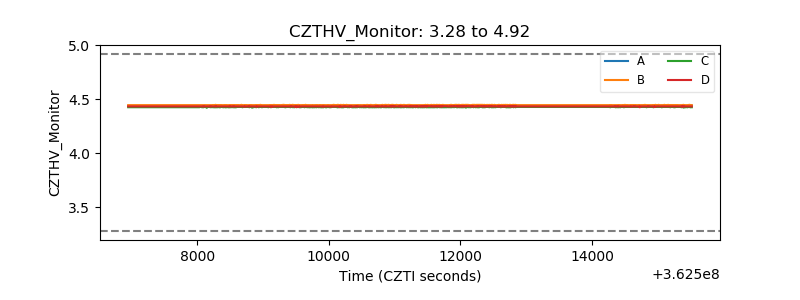 |
| D_VDD | 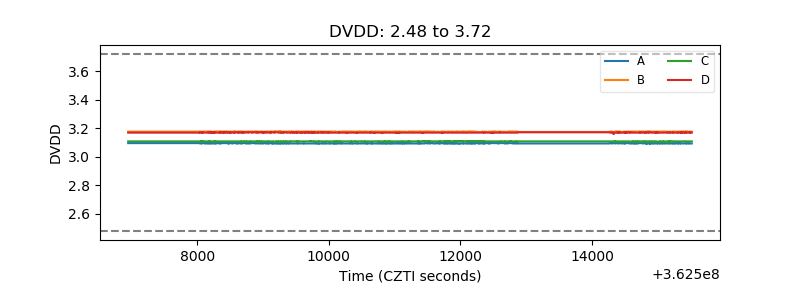 |
| Temperature 1 | 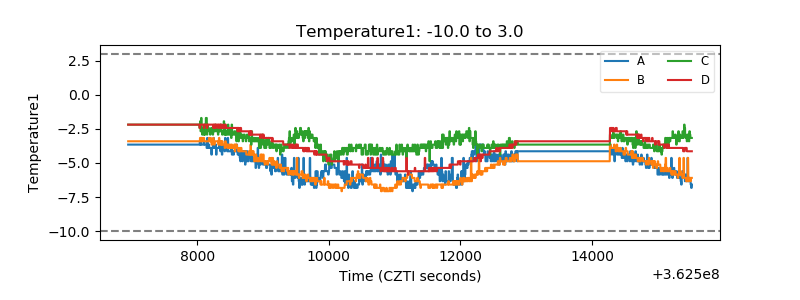 |
| Veto HV Monitor |  |
| Veto LLD | 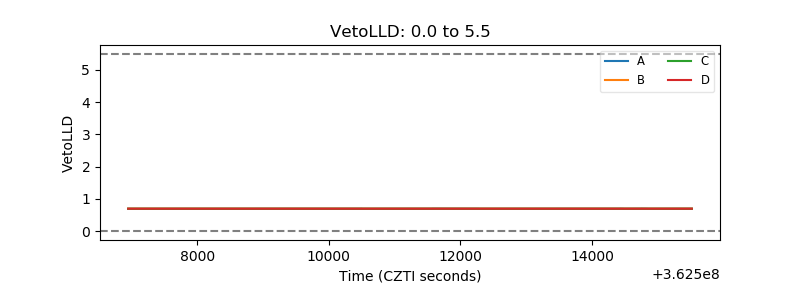 |
| Alpha Counter | 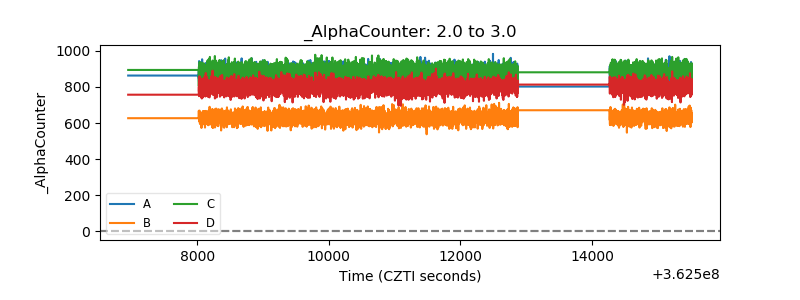 |
| _CPM_Rate |  |
| CZT Counter | 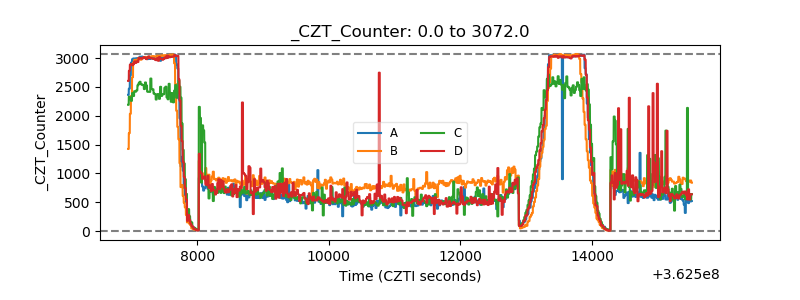 |
| +2.5 Volts monitor |  |
| +5 Volts monitor | 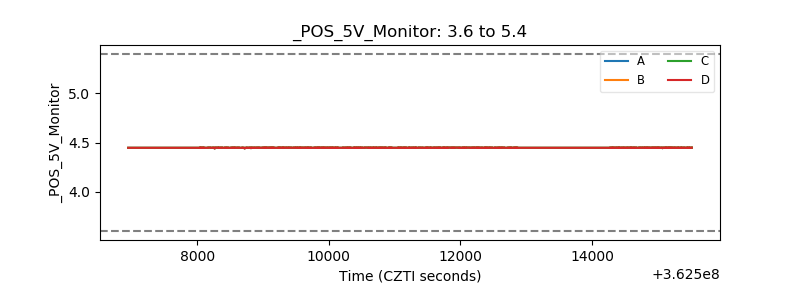 |
| _ROLL_ROT | 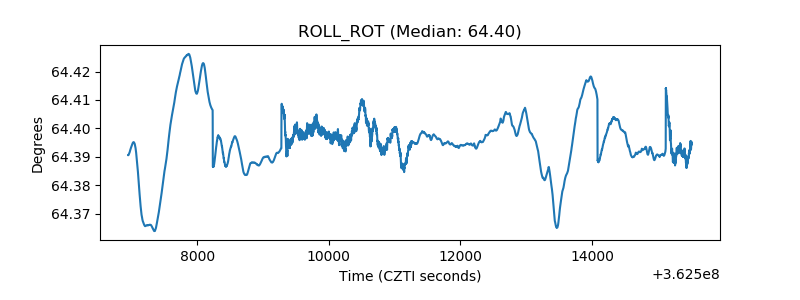 |
| _Roll_DEC | 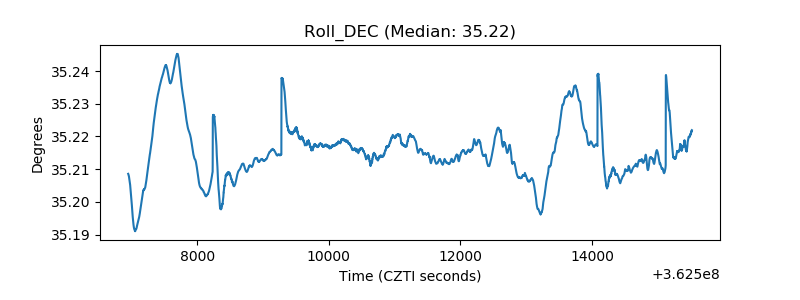 |
| _Roll_RA | 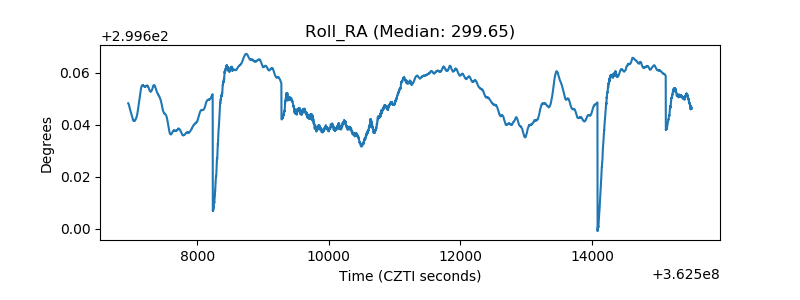 |
| Veto Counter | 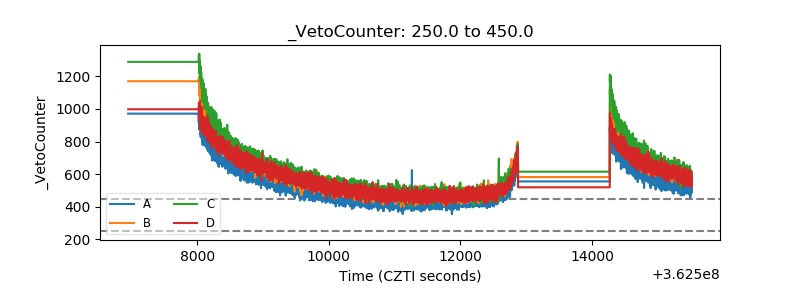 |