| Param | Original file | Final file |
|---|---|---|
| Filename | modeM0/AS1A10_109T01_9000004492_31082cztM0_level2.evt | modeM0/AS1A10_109T01_9000004492_31082cztM0_level2_quad_clean.evt |
| Size (bytes) | 1,042,488,000 | 187,934,400 |
| Size | 994.2 MB | 179.2 MB |
| Events in quadrant A | 6,293,999 | 1,226,345 |
| Events in quadrant B | 10,115,576 | 1,216,520 |
| Events in quadrant C | 6,721,803 | 1,190,922 |
| Events in quadrant D | 7,570,125 | 1,167,062 |
| Mode M0 | |||
|---|---|---|---|
| Quadrant | BADHDUFLAG | Total packets | Discarded packets |
| A | 0 | 26986 | 2 |
| B | 0 | 39505 | 2 |
| C | 0 | 28179 | 2 |
| D | 0 | 30863 | 2 |
| Mode SS | |||
|---|---|---|---|
| Quadrant | BADHDUFLAG | Total packets | Discarded packets |
| A | 0 | 262 | 0 |
| B | 0 | 262 | 0 |
| C | 0 | 262 | 0 |
| D | 0 | 262 | 0 |
| Mode M9 | |||
|---|---|---|---|
| Quadrant | BADHDUFLAG | Total packets | Discarded packets |
| A | 0 | 9 | 0 |
| B | 0 | 9 | 0 |
| C | 0 | 9 | 0 |
| D | 0 | 9 | 0 |
| Quadrant | Total seconds | Saturated seconds | Saturation percentage |
|---|---|---|---|
| A | 12894 | 164 | 1.271909% |
| B | 12894 | 381 | 2.954863% |
| C | 12894 | 347 | 2.691174% |
| D | 12895 | 126 | 0.977123% |
Noise dominated data is calculated using 1-second bins in cleaned event files. If a bin has >2000 counts, and if more than 50% of those come from <1% of pixels, then it is considered to be noise-dominated and hence unusable.
| Quadrant | # 1 sec bins | Bins with >0 counts | Bins with >2000 counts | High rate bins dominated by noise | Noise dominated (total time) | Noise dominated (detector-on time) | Marked lightcurve |
|---|---|---|---|---|---|---|---|
| A | 13804 | 12896 | 1 | 1 | 0.01% | 0.01% | 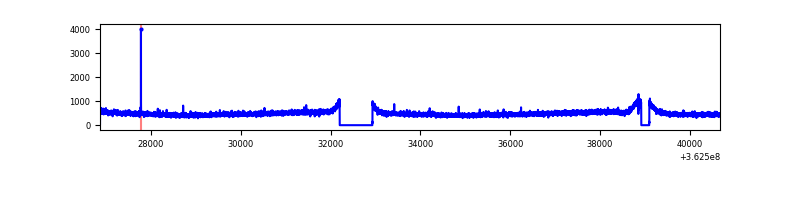 |
| B | 13804 | 12896 | 4 | 4 | 0.03% | 0.03% | 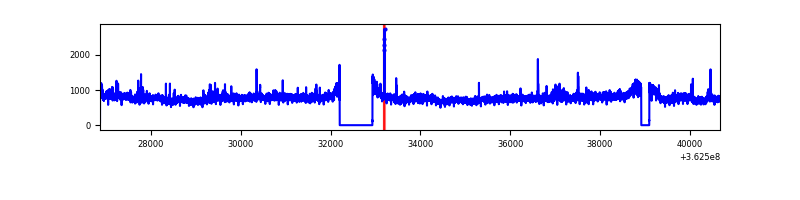 |
| C | 13804 | 12896 | 14 | 14 | 0.10% | 0.11% | 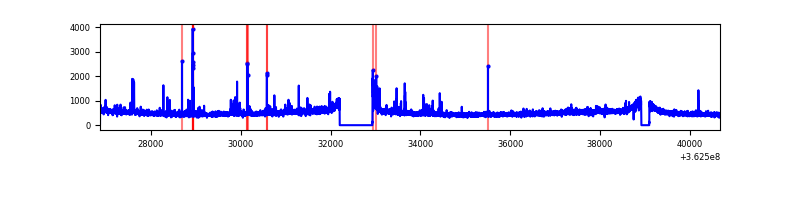 |
| D | 13805 | 12897 | 27 | 27 | 0.20% | 0.21% | 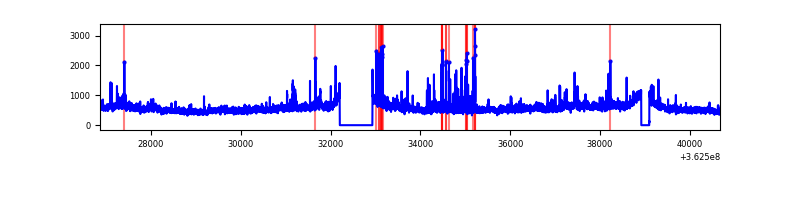 |
Top three noisy pixels from each quadrant. If the there are fewer than three noisy pixels in the level2.evt file, extra rows are filled as -1
| Pixel properties | Quadrant properties | ||||||
|---|---|---|---|---|---|---|---|
| Quadrant | DetID | PixID | Counts | Sigma | Mean | Median | Sigma |
| A | 13 | 254 | 21607 | 61.93 | 1626 | 1596 | 323.1 |
| A | 3 | 137 | 16610 | 46.47 | 1626 | 1596 | 323.1 |
| A | 12 | 96 | 14067 | 38.6 | 1626 | 1596 | 323.1 |
| B | 6 | 159 | 3576893 | 11614.41 | 1602 | 1564 | 307.8 |
| B | 0 | 183 | 163958 | 527.53 | 1602 | 1564 | 307.8 |
| B | 0 | 229 | 51889 | 163.48 | 1602 | 1564 | 307.8 |
| C | 14 | 238 | 251267 | 676.09 | 1569 | 1583 | 369.3 |
| C | 0 | 10 | 242598 | 652.62 | 1569 | 1583 | 369.3 |
| C | 10 | 22 | 72704 | 192.58 | 1569 | 1583 | 369.3 |
| D | 13 | 174 | 840303 | 2240.53 | 1580 | 1542 | 374.4 |
| D | 8 | 195 | 680547 | 1813.79 | 1580 | 1542 | 374.4 |
| D | 2 | 234 | 49294 | 127.56 | 1580 | 1542 | 374.4 |
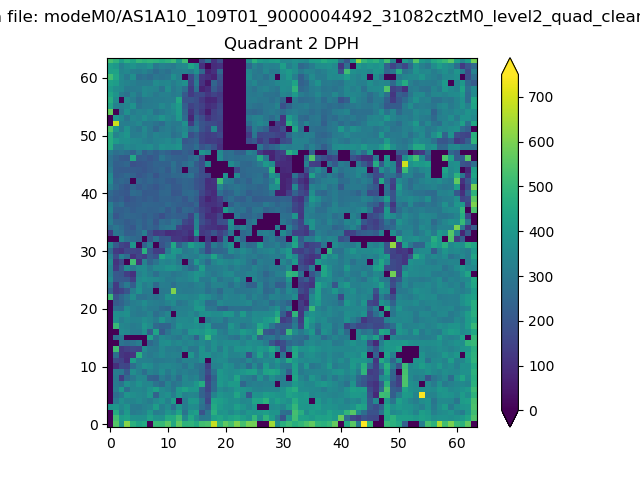
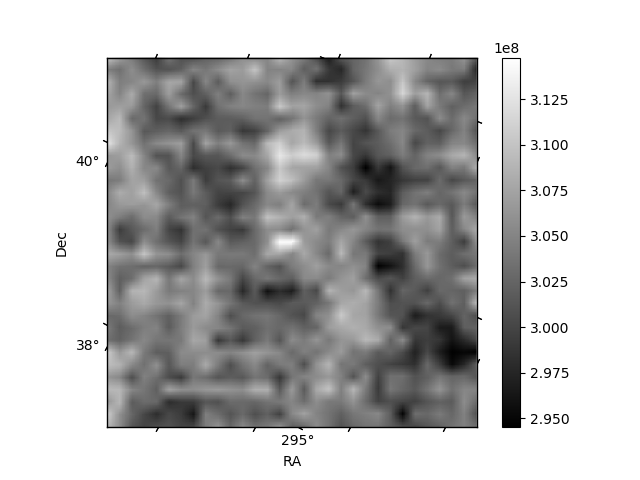
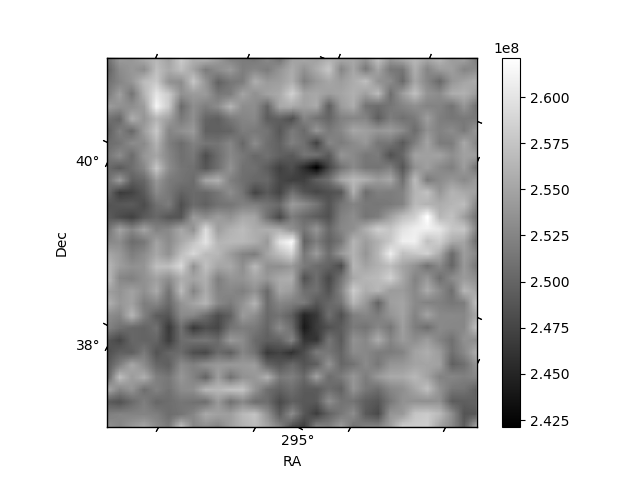
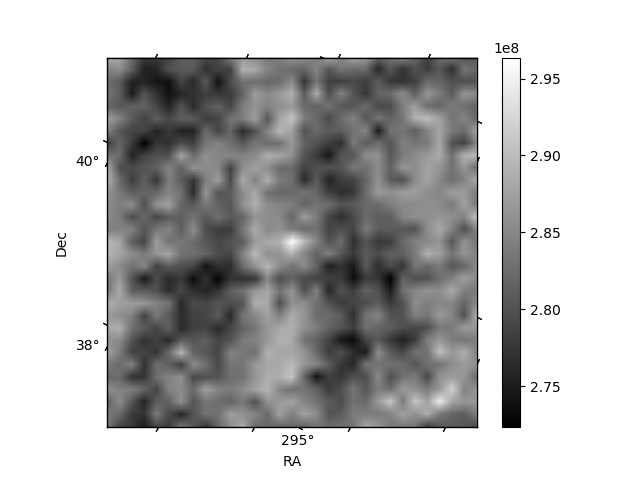
Histogram calculated using DETX and DETY for each event in the final _common_clean file
| Quadrant A | 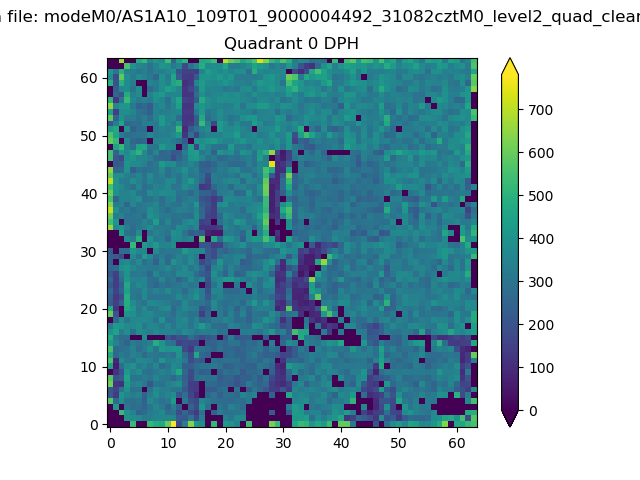 |
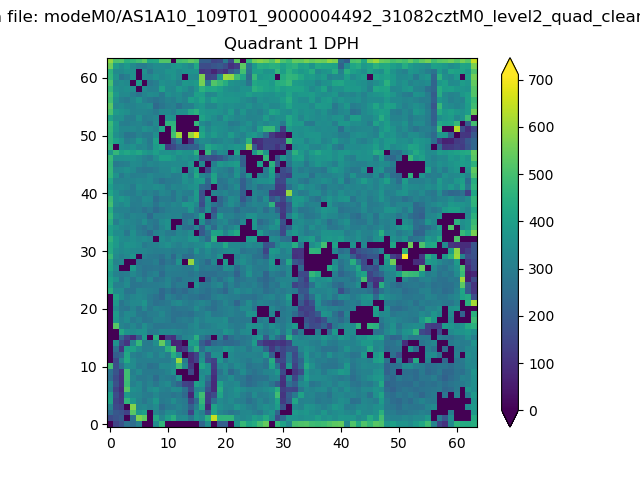 |
Quadrant B |
|---|---|---|---|
| Quadrant D | 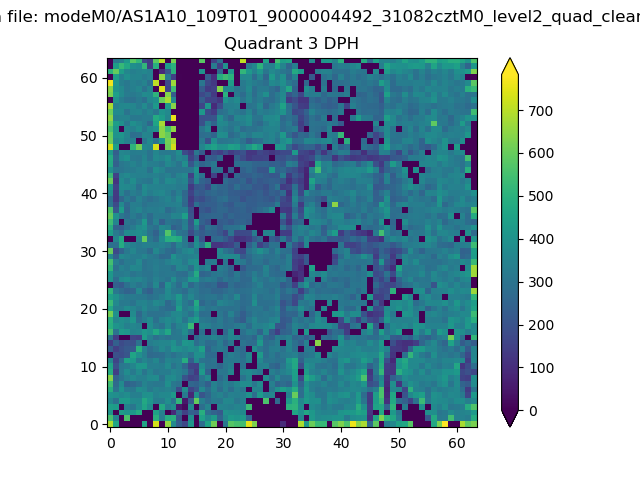 |
 |
Quadrant C |
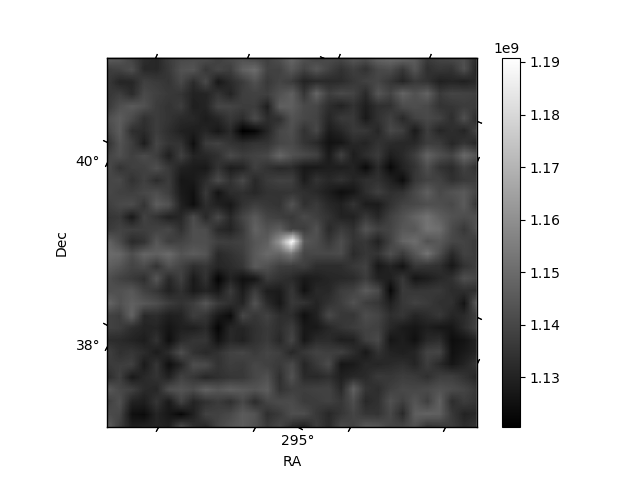
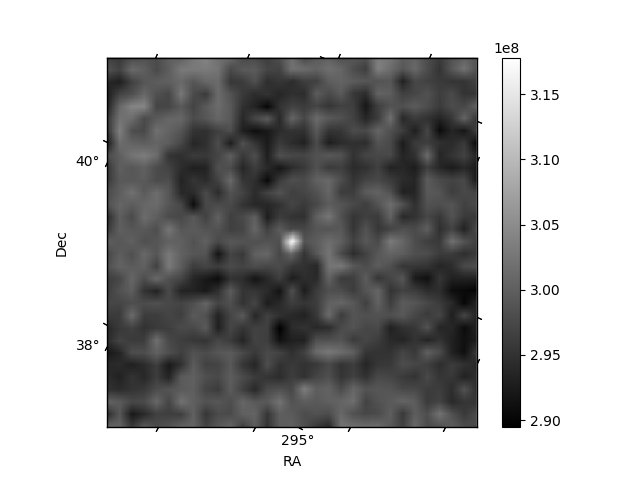
| Plot type | Count rate plots | Images |
|---|---|---|
| Comparison with Poisson distribution Blue bars denote a histogram of data divided into 1 sec bins. Red curve is a Poisson curve with rate = median count rate of data. |
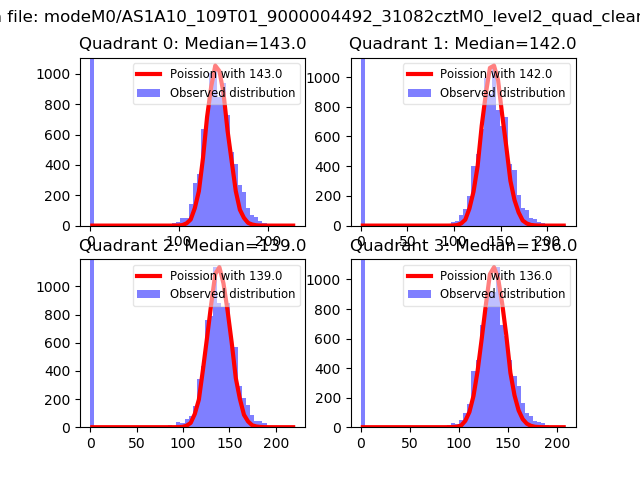 |
 |
| Quadrant-wise count rates Data is divided into 100 sec bins |
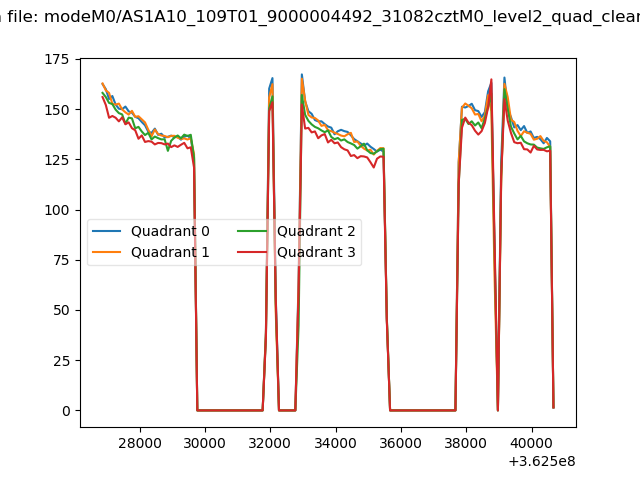 |
|
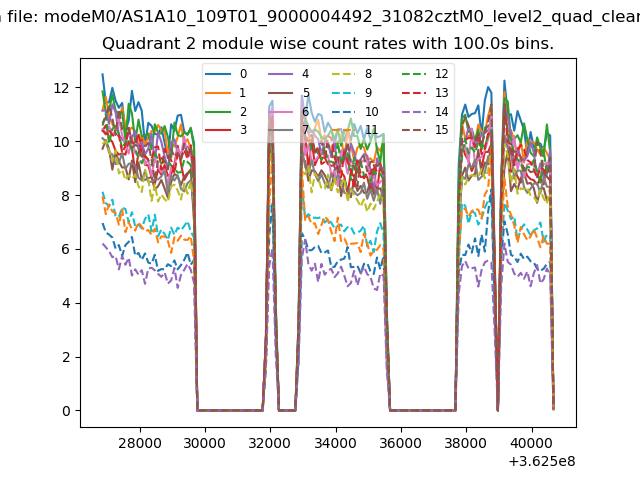
| Module-wise count rates for Quadrant A Data is divided into 100 sec bins |
 |
 |
| Module-wise count rates for Quadrant B Data is divided into 100 sec bins |
 |
 |
| Module-wise count rates for Quadrant C Data is divided into 100 sec bins |
 |
 |
| Module-wise count rates for Quadrant D Data is divided into 100 sec bins |
 |
 |
| Parameter | Plot |
|---|---|
| CZT HV Monitor | 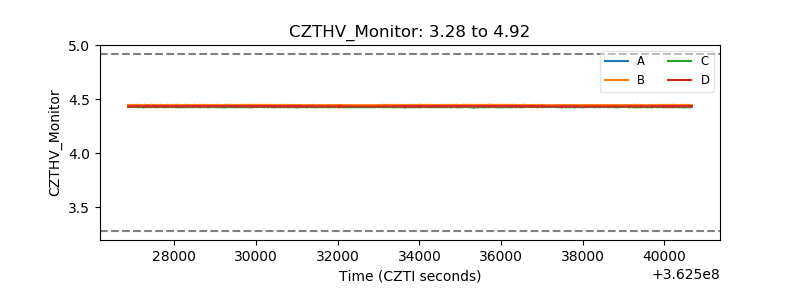 |
| D_VDD | 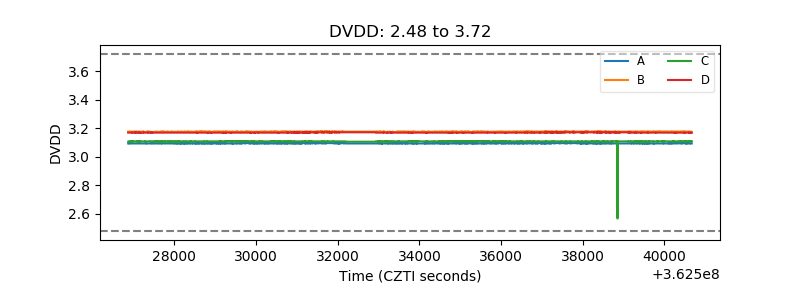 |
| Temperature 1 | 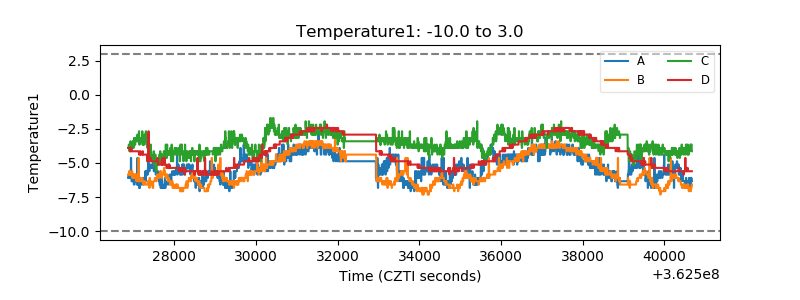 |
| Veto HV Monitor | 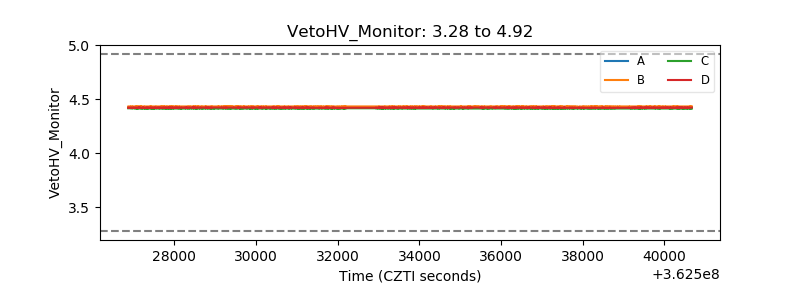 |
| Veto LLD | 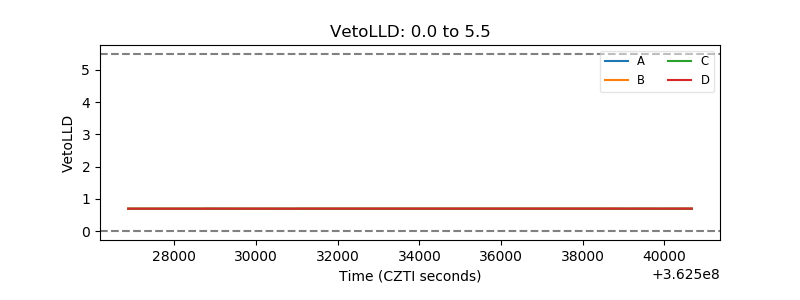 |
| Alpha Counter | 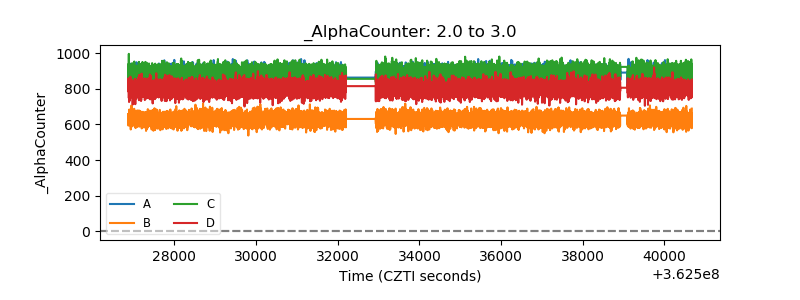 |
| _CPM_Rate | 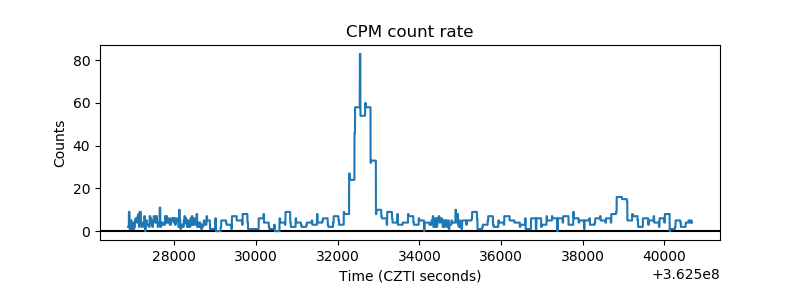 |
| CZT Counter | 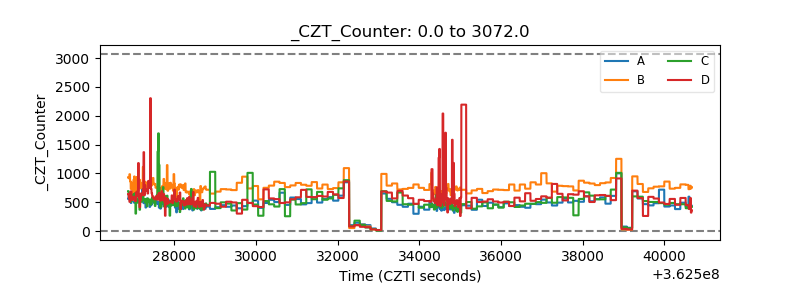 |
| +2.5 Volts monitor | 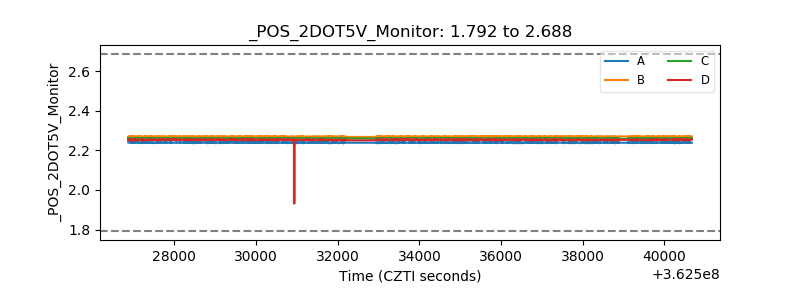 |
| +5 Volts monitor |  |
| _ROLL_ROT |  |
| _Roll_DEC |  |
| _Roll_RA | 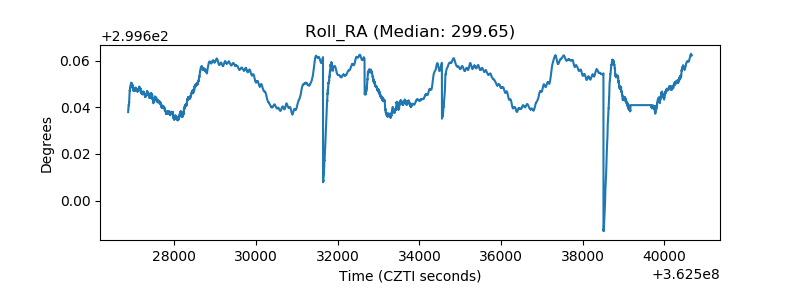 |
| Veto Counter | 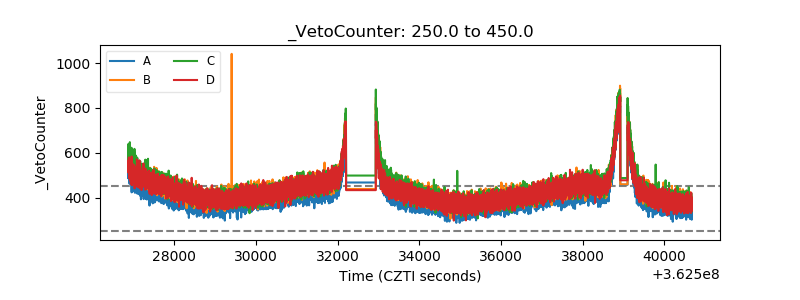 |