| Param | Original file | Final file |
|---|---|---|
| Filename | modeM0/AS1A10_109T01_9000004492_31083cztM0_level2.evt | modeM0/AS1A10_109T01_9000004492_31083cztM0_level2_quad_clean.evt |
| Size (bytes) | 615,093,120 | 110,943,360 |
| Size | 586.6 MB | 105.8 MB |
| Events in quadrant A | 3,521,949 | 730,419 |
| Events in quadrant B | 5,722,971 | 723,582 |
| Events in quadrant C | 3,784,661 | 709,554 |
| Events in quadrant D | 5,095,626 | 679,247 |
| Mode M0 | |||
|---|---|---|---|
| Quadrant | BADHDUFLAG | Total packets | Discarded packets |
| A | 0 | 15311 | 1 |
| B | 0 | 22499 | 1 |
| C | 0 | 16032 | 1 |
| D | 0 | 19983 | 2 |
| Mode SS | |||
|---|---|---|---|
| Quadrant | BADHDUFLAG | Total packets | Discarded packets |
| A | 0 | 152 | 0 |
| B | 0 | 152 | 0 |
| C | 0 | 152 | 0 |
| D | 0 | 152 | 0 |
| Mode M9 | |||
|---|---|---|---|
| Quadrant | BADHDUFLAG | Total packets | Discarded packets |
| A | 0 | 1 | 0 |
| B | 0 | 1 | 0 |
| C | 0 | 1 | 0 |
| D | 0 | 1 | 0 |
| Quadrant | Total seconds | Saturated seconds | Saturation percentage |
|---|---|---|---|
| A | 7420 | 112 | 1.509434% |
| B | 7421 | 240 | 3.234065% |
| C | 7421 | 184 | 2.479450% |
| D | 7420 | 443 | 5.970350% |
Noise dominated data is calculated using 1-second bins in cleaned event files. If a bin has >2000 counts, and if more than 50% of those come from <1% of pixels, then it is considered to be noise-dominated and hence unusable.
| Quadrant | # 1 sec bins | Bins with >0 counts | Bins with >2000 counts | High rate bins dominated by noise | Noise dominated (total time) | Noise dominated (detector-on time) | Marked lightcurve |
|---|---|---|---|---|---|---|---|
| A | 7535 | 7422 | 0 | 0 | 0.00% | 0.00% | 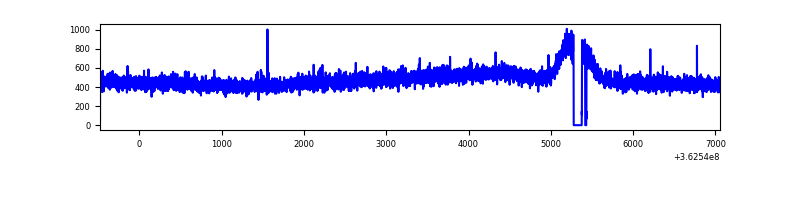 |
| B | 7536 | 7423 | 1 | 1 | 0.01% | 0.01% | 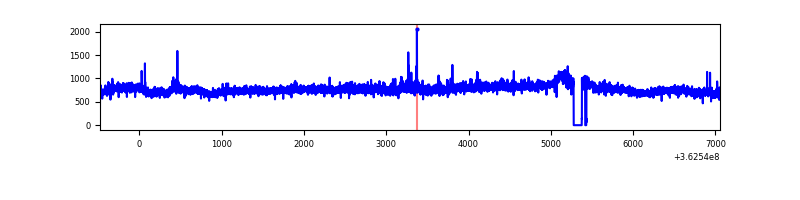 |
| C | 7536 | 7423 | 4 | 4 | 0.05% | 0.05% |  |
| D | 7535 | 7422 | 292 | 292 | 3.88% | 3.93% | 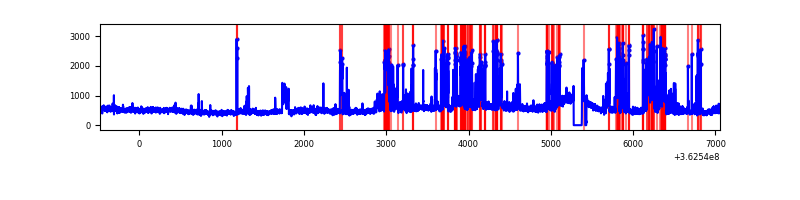 |
Top three noisy pixels from each quadrant. If the there are fewer than three noisy pixels in the level2.evt file, extra rows are filled as -1
| Pixel properties | Quadrant properties | ||||||
|---|---|---|---|---|---|---|---|
| Quadrant | DetID | PixID | Counts | Sigma | Mean | Median | Sigma |
| A | 13 | 254 | 11810 | 59.55 | 911 | 893 | 183.3 |
| A | 3 | 137 | 9604 | 47.51 | 911 | 893 | 183.3 |
| A | 0 | 226 | 7574 | 36.44 | 911 | 893 | 183.3 |
| B | 6 | 159 | 2078302 | 11973.62 | 898 | 873 | 173.5 |
| B | 0 | 183 | 73722 | 419.87 | 898 | 873 | 173.5 |
| B | 12 | 111 | 21980 | 121.65 | 898 | 873 | 173.5 |
| C | 0 | 10 | 156460 | 753.44 | 877 | 884 | 206.5 |
| C | 14 | 238 | 140550 | 676.39 | 877 | 884 | 206.5 |
| C | 10 | 22 | 49229 | 234.13 | 877 | 884 | 206.5 |
| D | 13 | 174 | 1353907 | 6596.96 | 866 | 846 | 205.1 |
| D | 8 | 195 | 381430 | 1855.57 | 866 | 846 | 205.1 |
| D | 6 | 219 | 66479 | 320.0 | 866 | 846 | 205.1 |
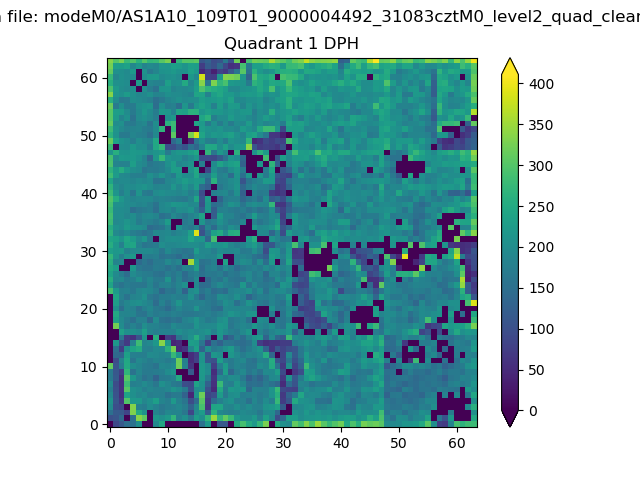
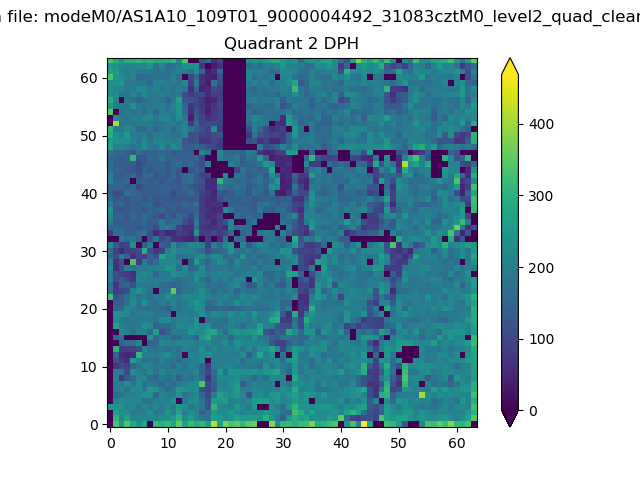
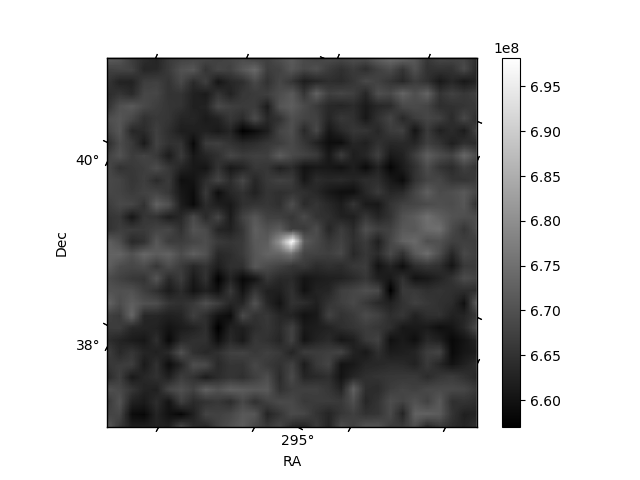
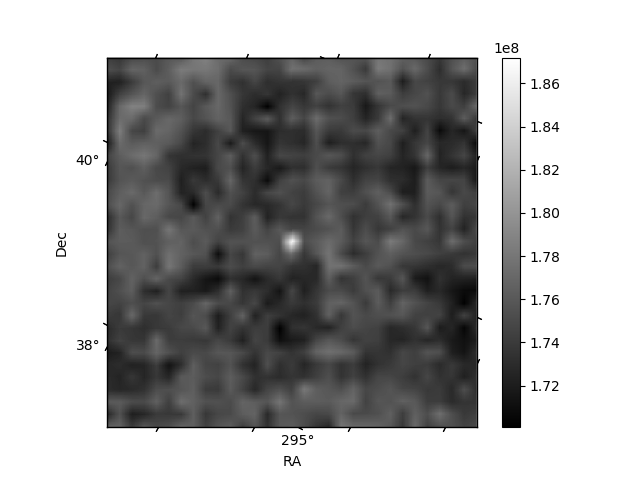
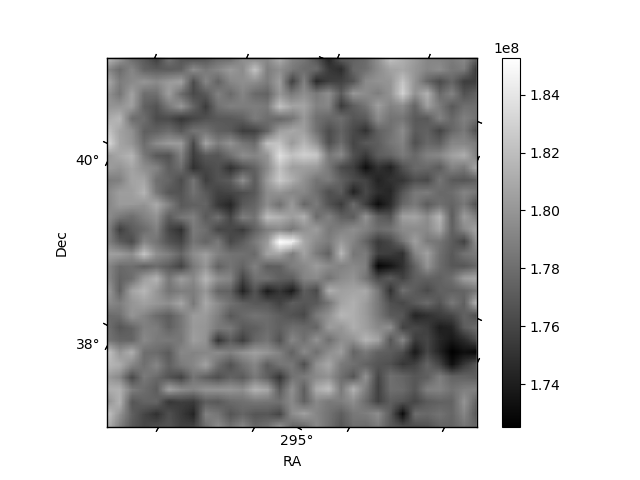
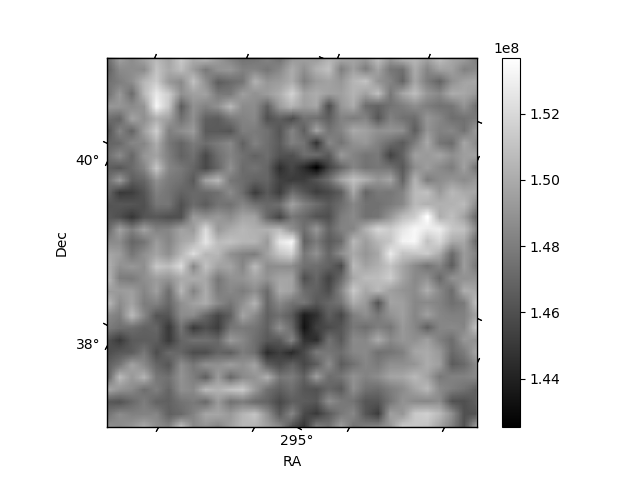
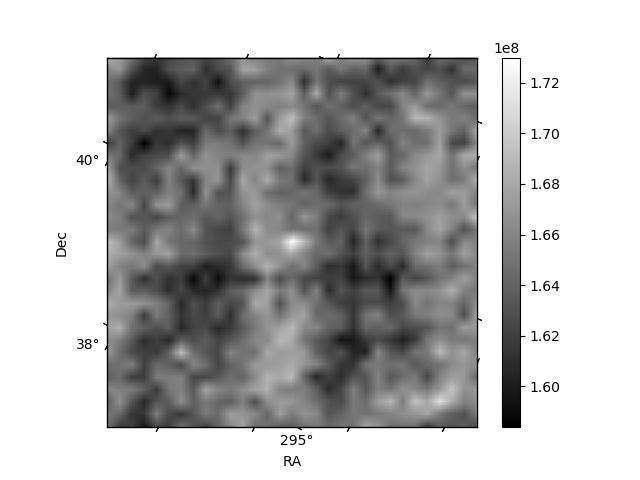
Histogram calculated using DETX and DETY for each event in the final _common_clean file
| Quadrant A | 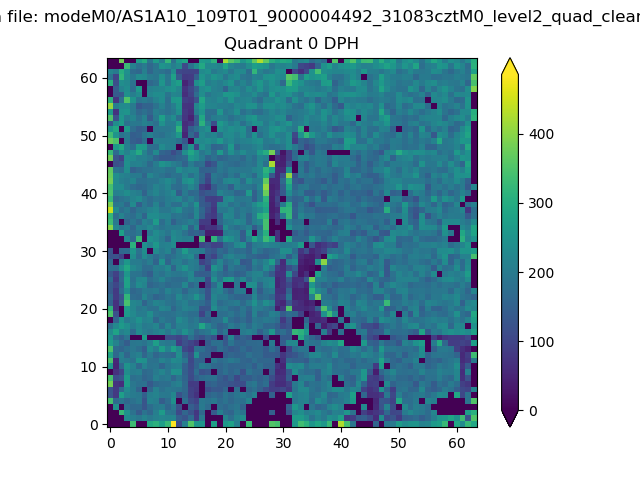 |
 |
Quadrant B |
|---|---|---|---|
| Quadrant D | 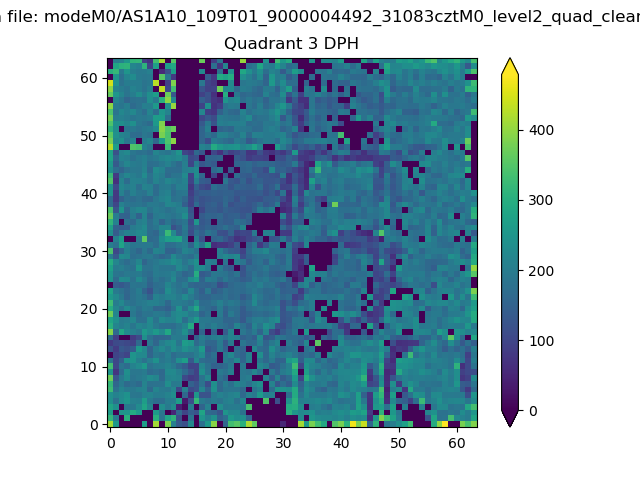 |
 |
Quadrant C |
| Plot type | Count rate plots | Images |
|---|---|---|
| Comparison with Poisson distribution Blue bars denote a histogram of data divided into 1 sec bins. Red curve is a Poisson curve with rate = median count rate of data. |
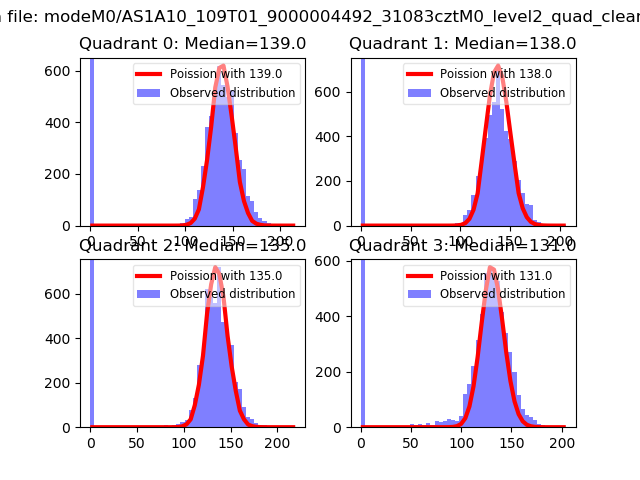 |
 |
| Quadrant-wise count rates Data is divided into 100 sec bins |
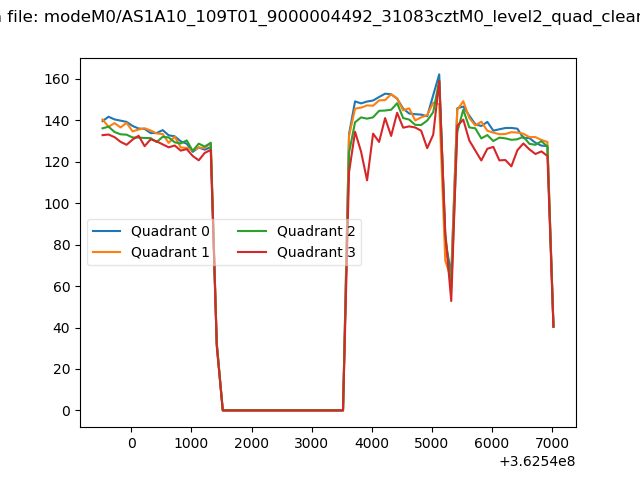 |
|
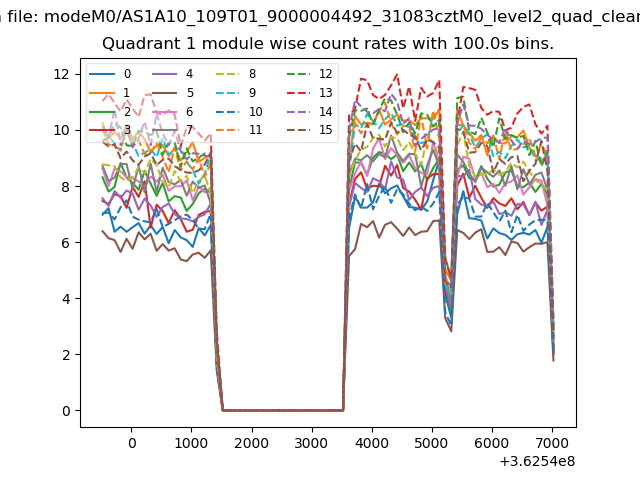
| Module-wise count rates for Quadrant A Data is divided into 100 sec bins |
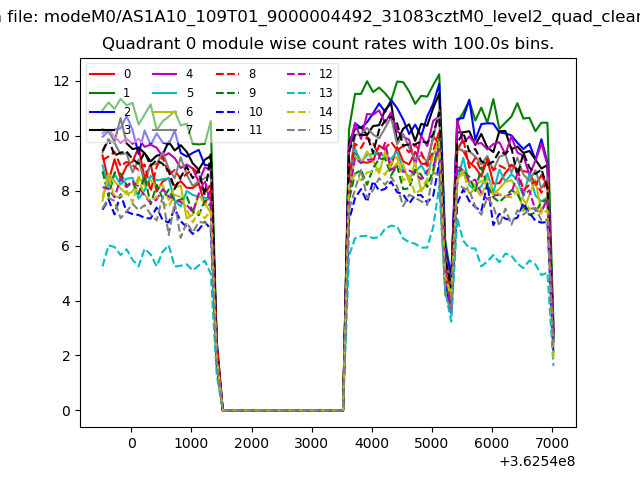 |
 |
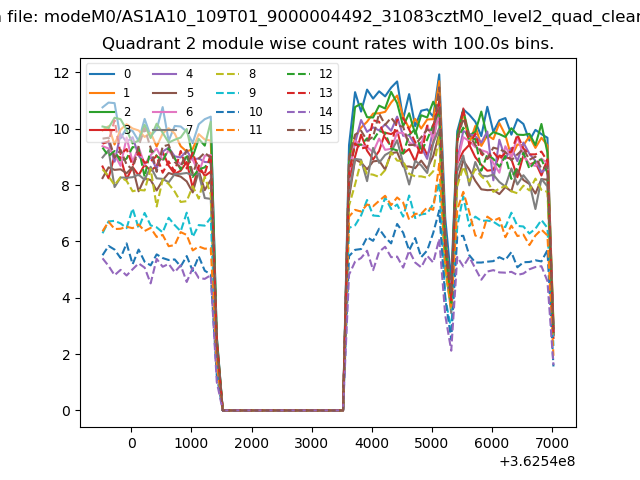
| Module-wise count rates for Quadrant B Data is divided into 100 sec bins |
 |
 |
| Module-wise count rates for Quadrant C Data is divided into 100 sec bins |
 |
 |
| Module-wise count rates for Quadrant D Data is divided into 100 sec bins |
 |
 |
| Parameter | Plot |
|---|---|
| CZT HV Monitor | 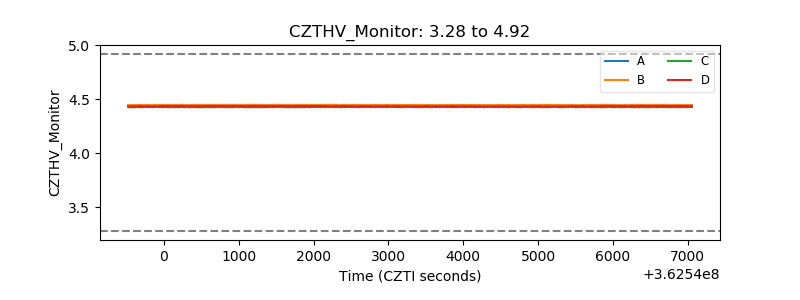 |
| D_VDD | 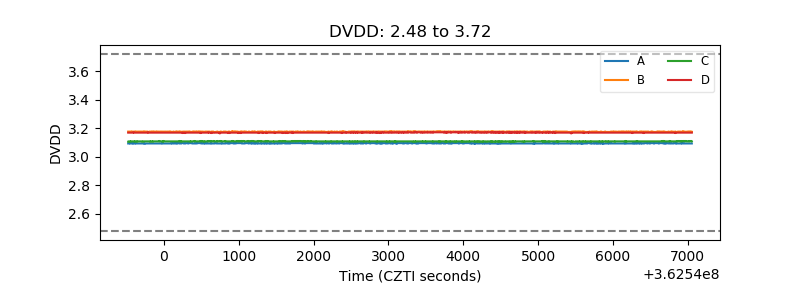 |
| Temperature 1 | 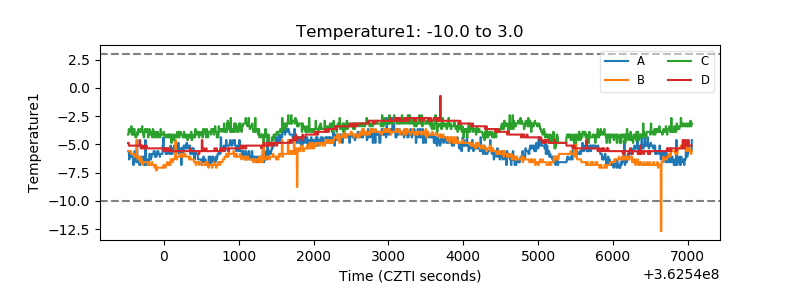 |
| Veto HV Monitor | 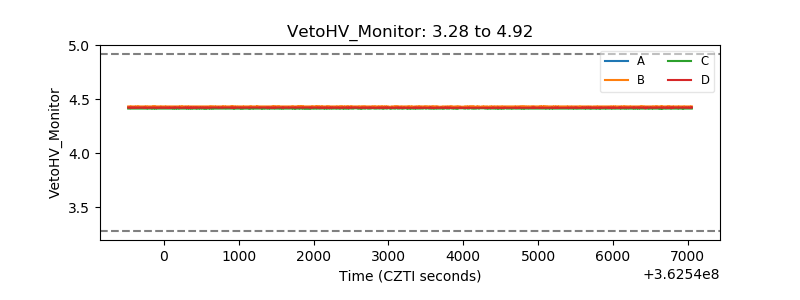 |
| Veto LLD | 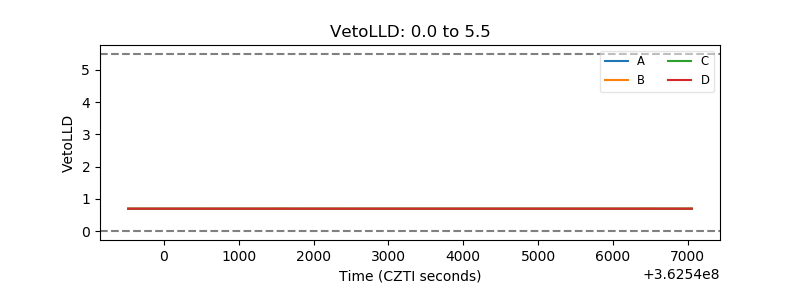 |
| Alpha Counter | 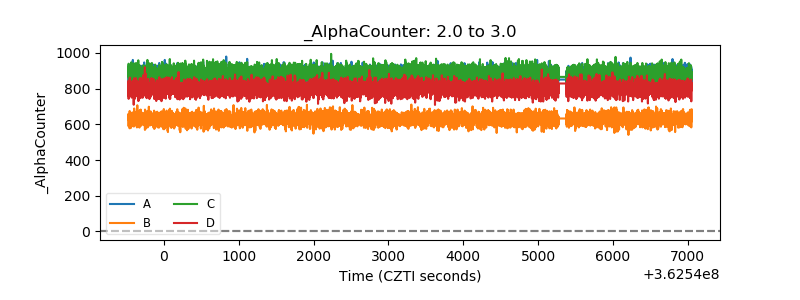 |
| _CPM_Rate | 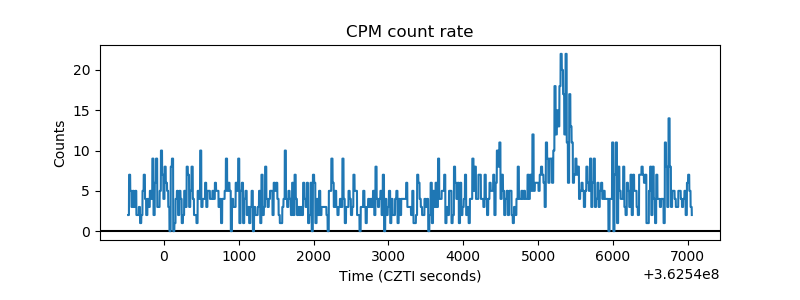 |
| CZT Counter | 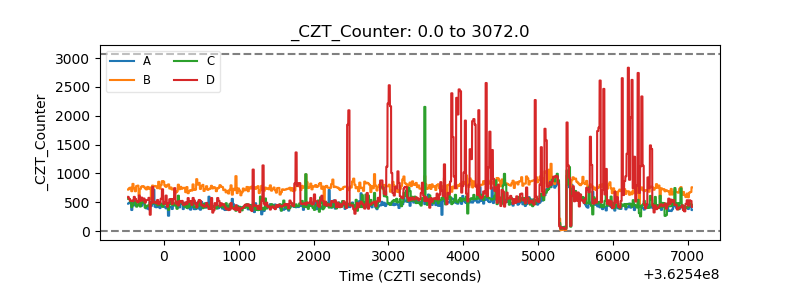 |
| +2.5 Volts monitor |  |
| +5 Volts monitor |  |
| _ROLL_ROT | 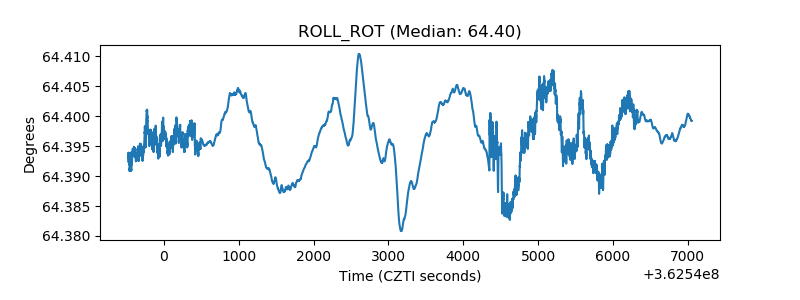 |
| _Roll_DEC | 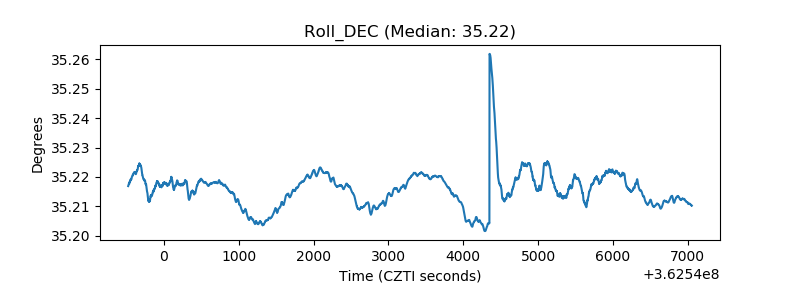 |
| _Roll_RA | 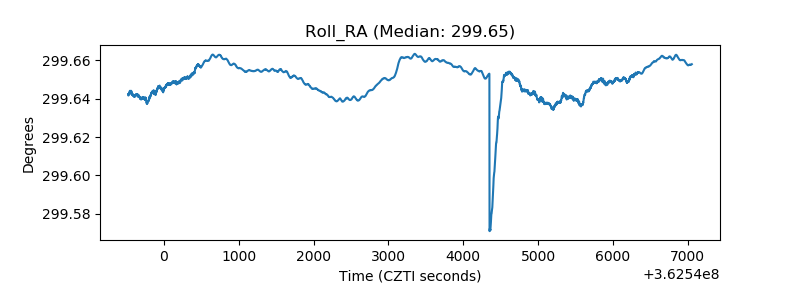 |
| Veto Counter | 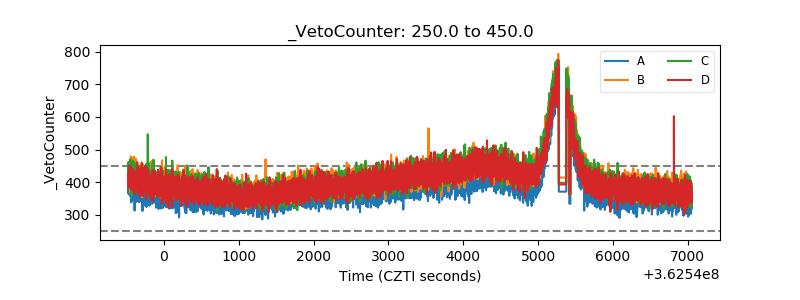 |