| Param | Original file | Final file |
|---|---|---|
| Filename | modeM0/AS1A10_109T01_9000004492_31086cztM0_level2.evt | modeM0/AS1A10_109T01_9000004492_31086cztM0_level2_quad_clean.evt |
| Size (bytes) | 1,473,255,360 | 239,843,520 |
| Size | 1.4 GB | 228.7 MB |
| Events in quadrant A | 8,767,318 | 1,535,485 |
| Events in quadrant B | 14,271,437 | 1,525,384 |
| Events in quadrant C | 9,730,650 | 1,476,218 |
| Events in quadrant D | 10,594,956 | 1,446,223 |
| Mode M0 | |||
|---|---|---|---|
| Quadrant | BADHDUFLAG | Total packets | Discarded packets |
| A | 0 | 37730 | 3 |
| B | 0 | 56060 | 4 |
| C | 0 | 40453 | 3 |
| D | 0 | 42943 | 3 |
| Mode SS | |||
|---|---|---|---|
| Quadrant | BADHDUFLAG | Total packets | Discarded packets |
| A | 0 | 376 | 0 |
| B | 0 | 376 | 0 |
| C | 0 | 376 | 0 |
| D | 0 | 376 | 0 |
| Mode M9 | |||
|---|---|---|---|
| Quadrant | BADHDUFLAG | Total packets | Discarded packets |
| A | 0 | 17 | 0 |
| B | 0 | 17 | 0 |
| C | 0 | 17 | 0 |
| D | 0 | 17 | 0 |
| Quadrant | Total seconds | Saturated seconds | Saturation percentage |
|---|---|---|---|
| A | 18596 | 136 | 0.731340% |
| B | 18596 | 268 | 1.441170% |
| C | 18596 | 331 | 1.779953% |
| D | 18596 | 204 | 1.097010% |
Noise dominated data is calculated using 1-second bins in cleaned event files. If a bin has >2000 counts, and if more than 50% of those come from <1% of pixels, then it is considered to be noise-dominated and hence unusable.
| Quadrant | # 1 sec bins | Bins with >0 counts | Bins with >2000 counts | High rate bins dominated by noise | Noise dominated (total time) | Noise dominated (detector-on time) | Marked lightcurve |
|---|---|---|---|---|---|---|---|
| A | 20287 | 18600 | 0 | 0 | 0.00% | 0.00% |  |
| B | 20287 | 18600 | 5 | 5 | 0.02% | 0.03% |  |
| C | 20287 | 18600 | 36 | 36 | 0.18% | 0.19% |  |
| D | 20287 | 18600 | 116 | 116 | 0.57% | 0.62% |  |
Top three noisy pixels from each quadrant. If the there are fewer than three noisy pixels in the level2.evt file, extra rows are filled as -1
| Pixel properties | Quadrant properties | ||||||
|---|---|---|---|---|---|---|---|
| Quadrant | DetID | PixID | Counts | Sigma | Mean | Median | Sigma |
| A | 13 | 254 | 32031 | 65.91 | 2271 | 2226 | 452.2 |
| A | 3 | 137 | 23792 | 47.69 | 2271 | 2226 | 452.2 |
| A | 0 | 226 | 18640 | 36.3 | 2271 | 2226 | 452.2 |
| B | 6 | 159 | 5182922 | 12068.65 | 2236 | 2176 | 429.3 |
| B | 0 | 183 | 168732 | 388.0 | 2236 | 2176 | 429.3 |
| B | 12 | 111 | 55122 | 123.34 | 2236 | 2176 | 429.3 |
| C | 0 | 10 | 560823 | 1097.73 | 2173 | 2188 | 508.9 |
| C | 14 | 238 | 348660 | 680.82 | 2173 | 2188 | 508.9 |
| C | 10 | 22 | 283706 | 553.19 | 2173 | 2188 | 508.9 |
| D | 13 | 174 | 1240119 | 2383.69 | 2186 | 2130 | 519.4 |
| D | 8 | 195 | 993329 | 1908.51 | 2186 | 2130 | 519.4 |
| D | 2 | 234 | 78107 | 146.29 | 2186 | 2130 | 519.4 |
Histogram calculated using DETX and DETY for each event in the final _common_clean file
| Quadrant A |  |
 |
Quadrant B |
|---|---|---|---|
| Quadrant D |  |
 |
Quadrant C |
| Plot type | Count rate plots | Images |
|---|---|---|
| Comparison with Poisson distribution Blue bars denote a histogram of data divided into 1 sec bins. Red curve is a Poisson curve with rate = median count rate of data. |
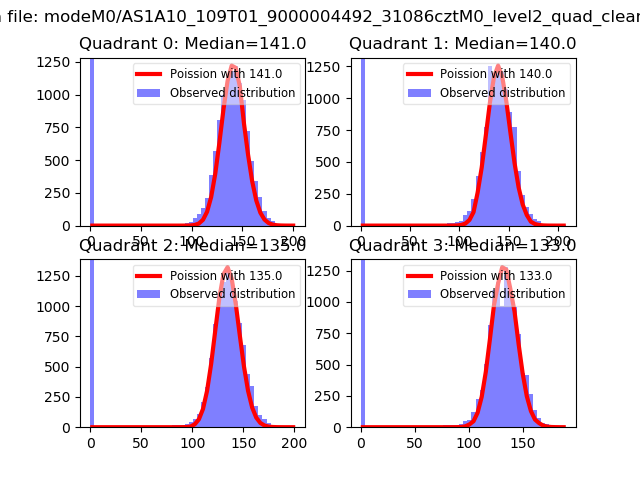 |
 |
| Quadrant-wise count rates Data is divided into 100 sec bins |
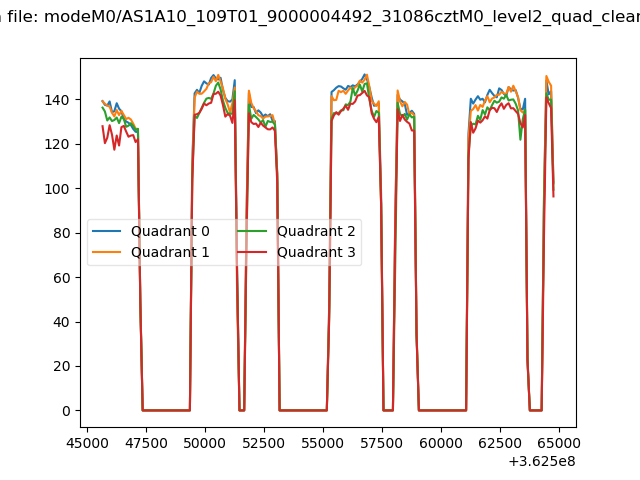 |
|
| Module-wise count rates for Quadrant A Data is divided into 100 sec bins |
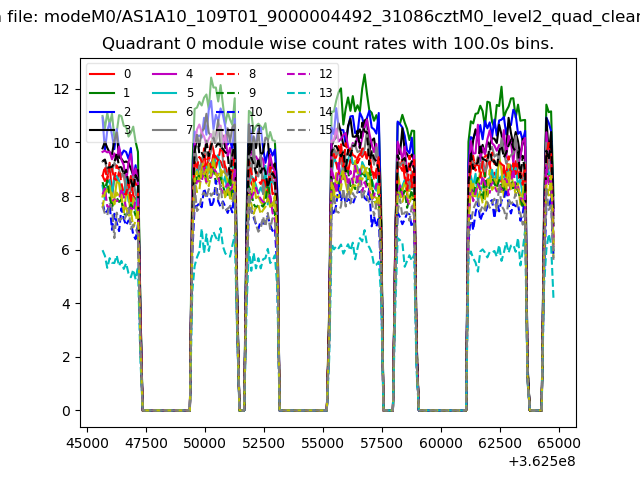 |
 |
| Module-wise count rates for Quadrant B Data is divided into 100 sec bins |
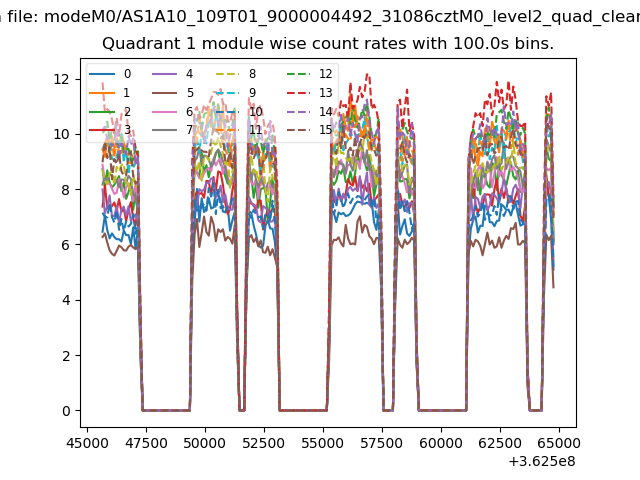 |
 |
| Module-wise count rates for Quadrant C Data is divided into 100 sec bins |
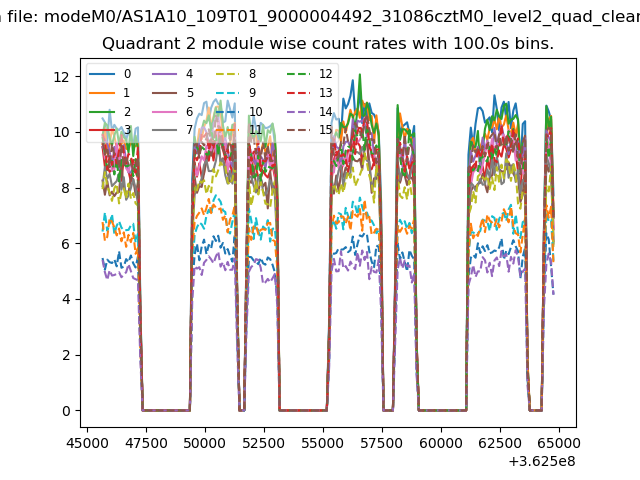 |
 |
| Module-wise count rates for Quadrant D Data is divided into 100 sec bins |
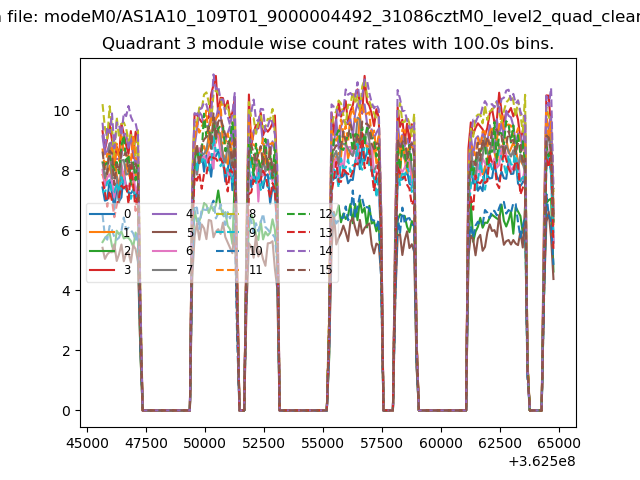 |
 |
| Parameter | Plot |
|---|---|
| CZT HV Monitor | 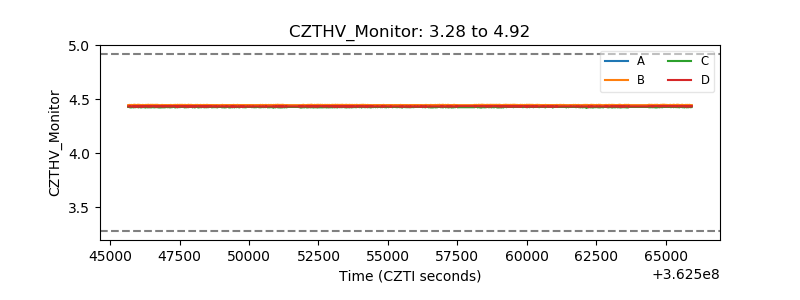 |
| D_VDD |  |
| Temperature 1 |  |
| Veto HV Monitor |  |
| Veto LLD |  |
| Alpha Counter | 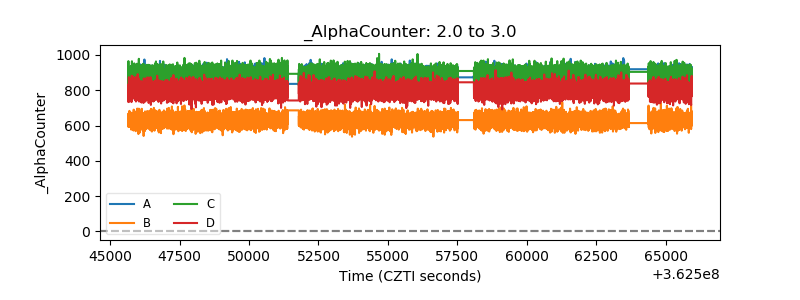 |
| _CPM_Rate | 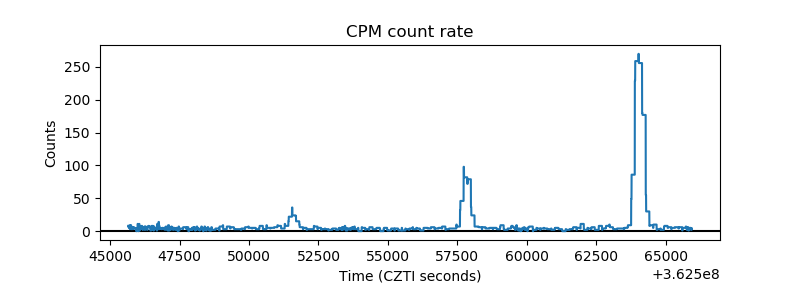 |
| CZT Counter |  |
| +2.5 Volts monitor |  |
| +5 Volts monitor |  |
| _ROLL_ROT | 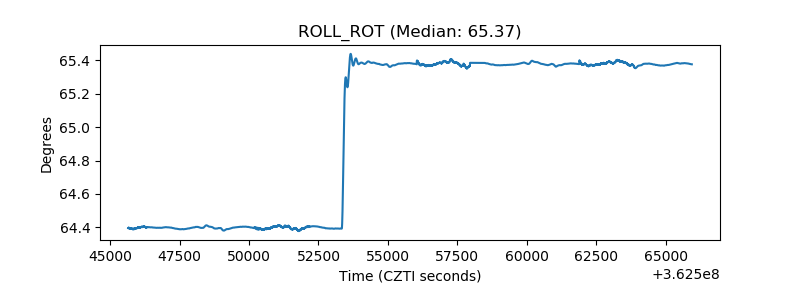 |
| _Roll_DEC | 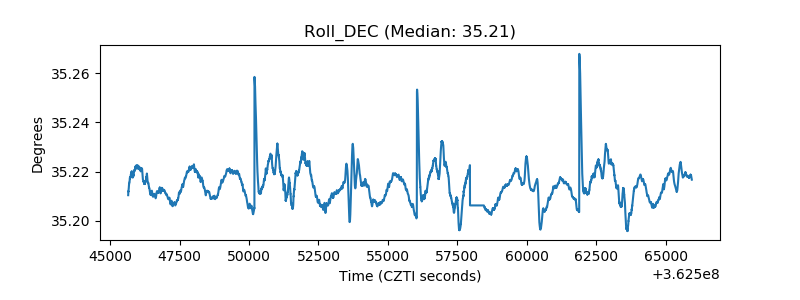 |
| _Roll_RA |  |
| Veto Counter | 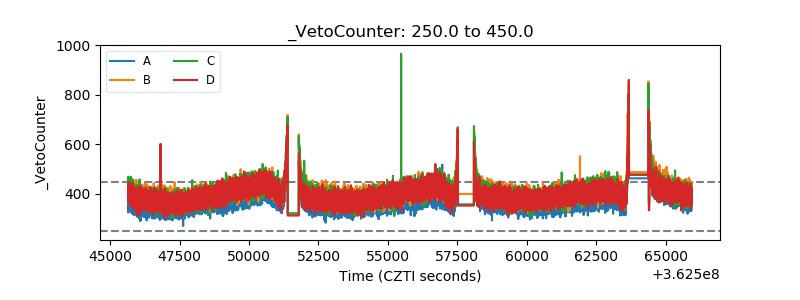 |