| Param | Original file | Final file |
|---|---|---|
| Filename | modeM0/AS1A10_109T01_9000004492_31087cztM0_level2.evt | modeM0/AS1A10_109T01_9000004492_31087cztM0_level2_quad_clean.evt |
| Size (bytes) | 539,061,120 | 71,804,160 |
| Size | 514.1 MB | 68.5 MB |
| Events in quadrant A | 3,303,282 | 437,604 |
| Events in quadrant B | 5,176,956 | 434,487 |
| Events in quadrant C | 3,572,386 | 418,329 |
| Events in quadrant D | 3,814,416 | 412,091 |
| Mode M0 | |||
|---|---|---|---|
| Quadrant | BADHDUFLAG | Total packets | Discarded packets |
| A | 0 | 13849 | 1 |
| B | 0 | 20362 | 1 |
| C | 0 | 14522 | 1 |
| D | 0 | 15398 | 1 |
| Mode SS | |||
|---|---|---|---|
| Quadrant | BADHDUFLAG | Total packets | Discarded packets |
| A | 0 | 138 | 0 |
| B | 0 | 138 | 0 |
| C | 0 | 138 | 0 |
| D | 0 | 138 | 0 |
| Mode M9 | |||
|---|---|---|---|
| Quadrant | BADHDUFLAG | Total packets | Discarded packets |
| A | 0 | 9 | 0 |
| B | 0 | 9 | 0 |
| C | 0 | 9 | 0 |
| D | 0 | 9 | 0 |
| Quadrant | Total seconds | Saturated seconds | Saturation percentage |
|---|---|---|---|
| A | 6763 | 50 | 0.739317% |
| B | 6764 | 98 | 1.448847% |
| C | 6763 | 112 | 1.656070% |
| D | 6763 | 39 | 0.576667% |
Noise dominated data is calculated using 1-second bins in cleaned event files. If a bin has >2000 counts, and if more than 50% of those come from <1% of pixels, then it is considered to be noise-dominated and hence unusable.
| Quadrant | # 1 sec bins | Bins with >0 counts | Bins with >2000 counts | High rate bins dominated by noise | Noise dominated (total time) | Noise dominated (detector-on time) | Marked lightcurve |
|---|---|---|---|---|---|---|---|
| A | 7653 | 6764 | 0 | 0 | 0.00% | 0.00% | 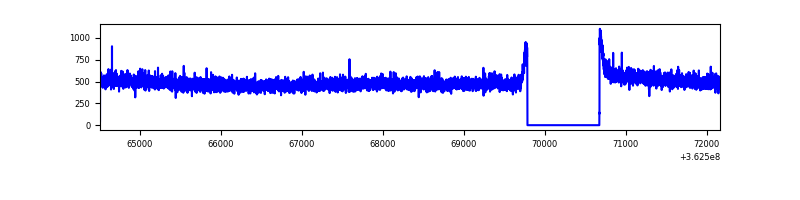 |
| B | 7654 | 6765 | 0 | 0 | 0.00% | 0.00% | 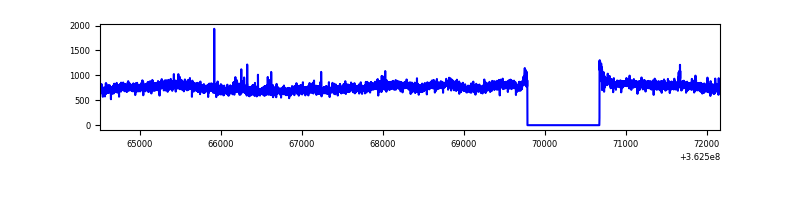 |
| C | 7653 | 6764 | 2 | 2 | 0.03% | 0.03% | 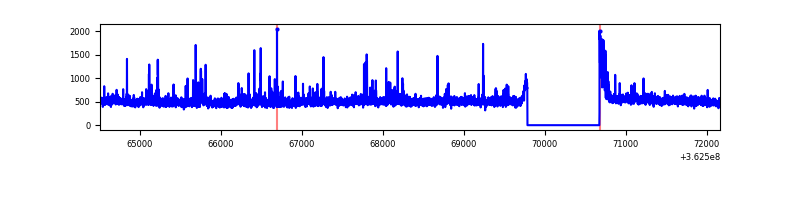 |
| D | 7653 | 6764 | 3 | 3 | 0.04% | 0.04% | 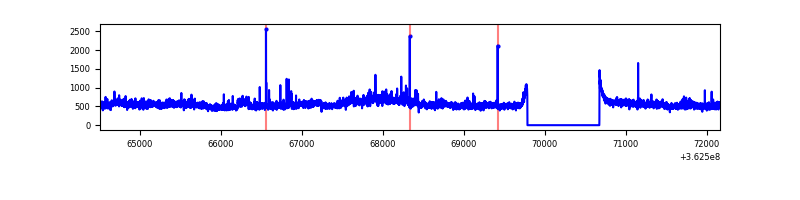 |
Top three noisy pixels from each quadrant. If the there are fewer than three noisy pixels in the level2.evt file, extra rows are filled as -1
| Pixel properties | Quadrant properties | ||||||
|---|---|---|---|---|---|---|---|
| Quadrant | DetID | PixID | Counts | Sigma | Mean | Median | Sigma |
| A | 13 | 254 | 12012 | 65.46 | 855 | 839 | 170.7 |
| A | 3 | 137 | 8727 | 46.21 | 855 | 839 | 170.7 |
| A | 0 | 226 | 7088 | 36.61 | 855 | 839 | 170.7 |
| B | 6 | 159 | 1819430 | 11205.35 | 838 | 817 | 162.3 |
| B | 12 | 111 | 20674 | 122.35 | 838 | 817 | 162.3 |
| B | 0 | 230 | 19697 | 116.33 | 838 | 817 | 162.3 |
| C | 0 | 10 | 197160 | 1030.27 | 808 | 815 | 190.6 |
| C | 14 | 238 | 129496 | 675.22 | 808 | 815 | 190.6 |
| C | 10 | 22 | 63088 | 326.76 | 808 | 815 | 190.6 |
| D | 8 | 195 | 496728 | 2535.72 | 820 | 799 | 195.6 |
| D | 13 | 174 | 195519 | 995.62 | 820 | 799 | 195.6 |
| D | 2 | 234 | 29502 | 146.76 | 820 | 799 | 195.6 |
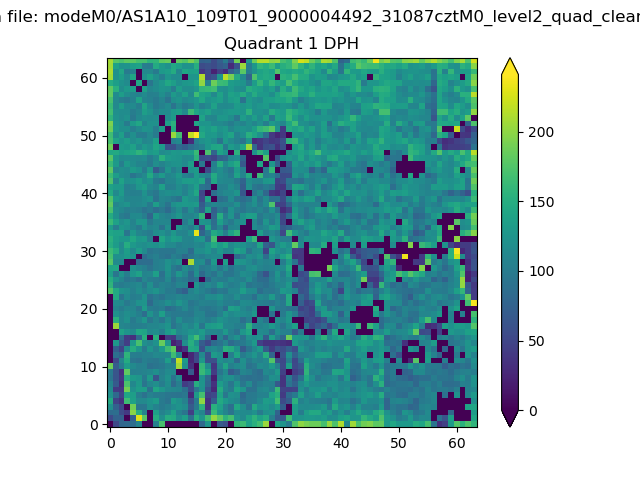
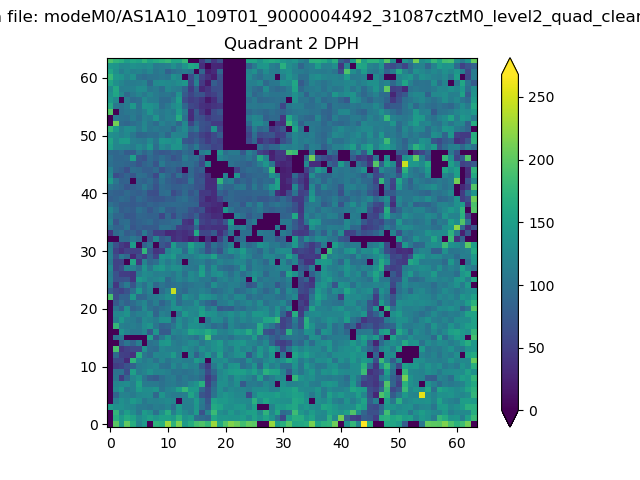
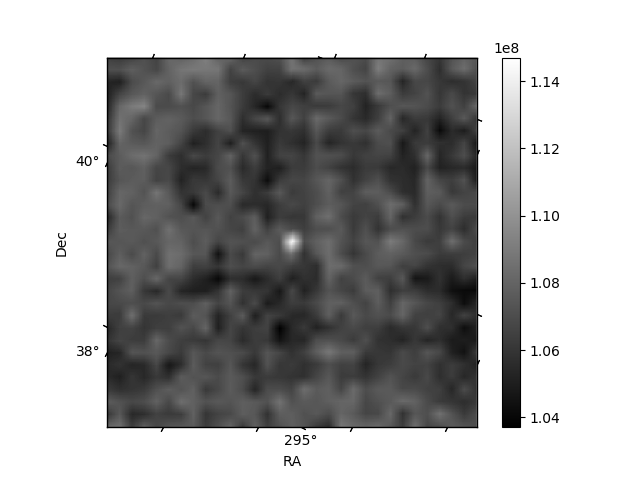
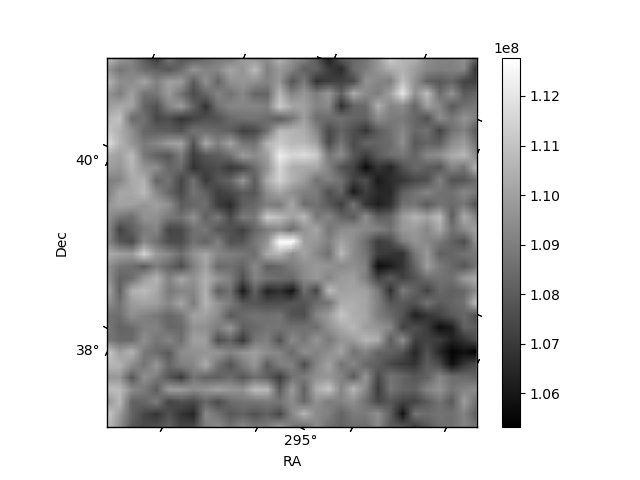
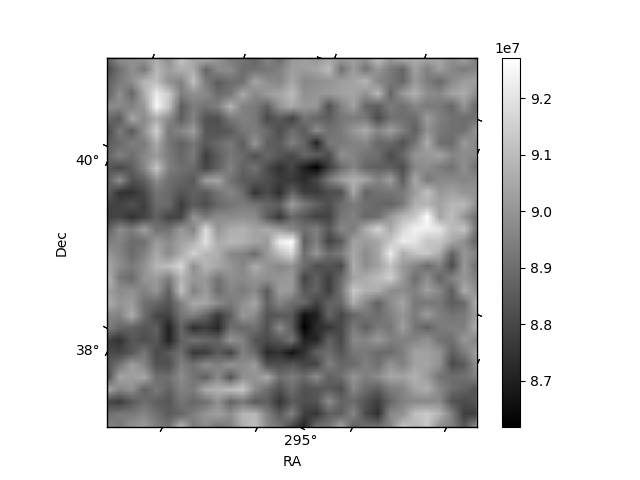
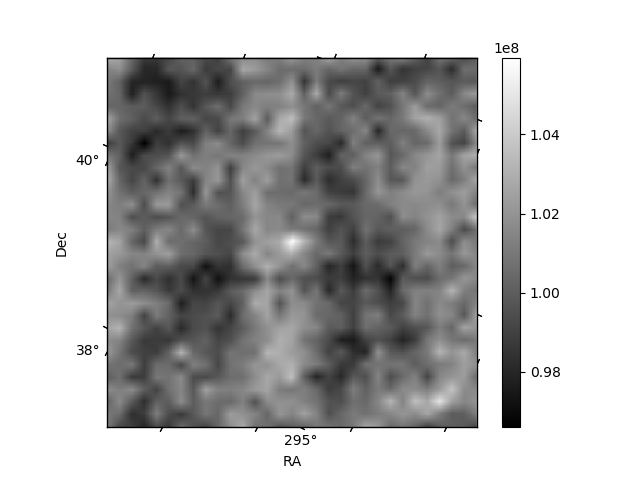
Histogram calculated using DETX and DETY for each event in the final _common_clean file
| Quadrant A |  |
 |
Quadrant B |
|---|---|---|---|
| Quadrant D |  |
 |
Quadrant C |
| Plot type | Count rate plots | Images |
|---|---|---|
| Comparison with Poisson distribution Blue bars denote a histogram of data divided into 1 sec bins. Red curve is a Poisson curve with rate = median count rate of data. |
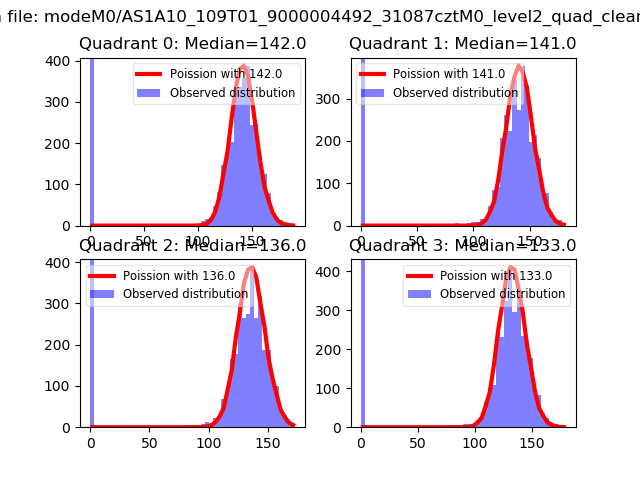 |
 |
| Quadrant-wise count rates Data is divided into 100 sec bins |
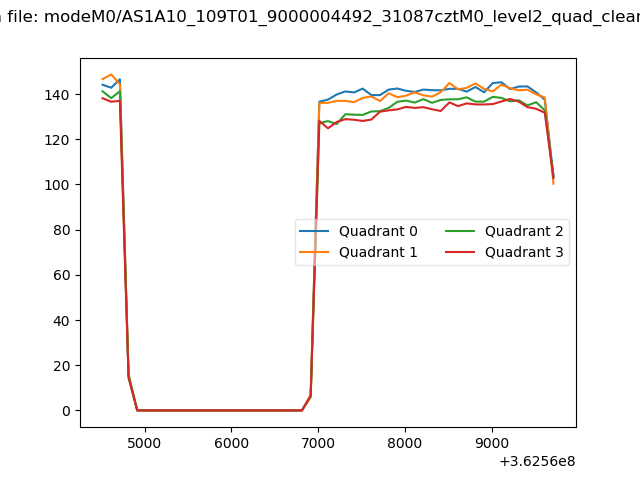 |
|
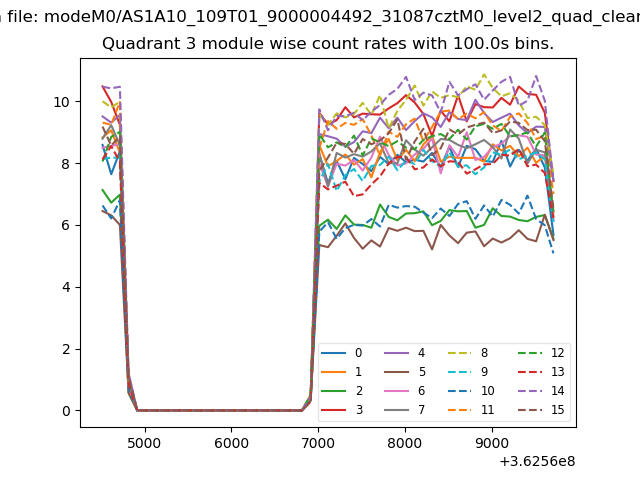
| Module-wise count rates for Quadrant A Data is divided into 100 sec bins |
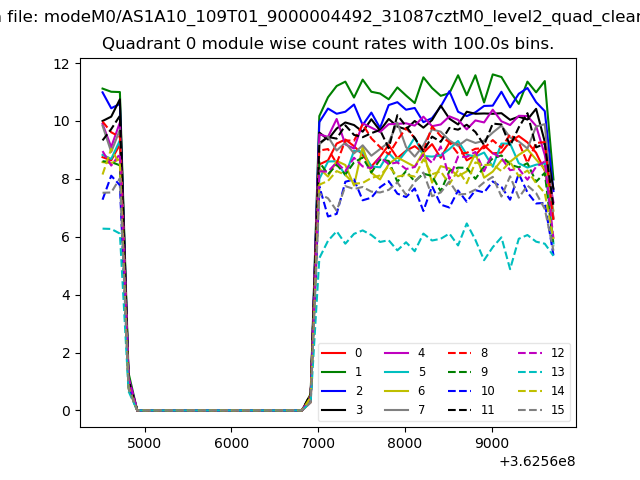 |
 |
| Module-wise count rates for Quadrant B Data is divided into 100 sec bins |
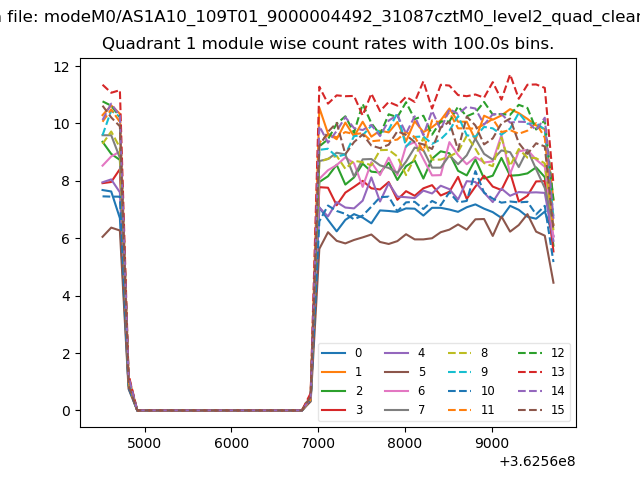 |
 |
| Module-wise count rates for Quadrant C Data is divided into 100 sec bins |
 |
 |
| Module-wise count rates for Quadrant D Data is divided into 100 sec bins |
 |
 |
| Parameter | Plot |
|---|---|
| CZT HV Monitor | 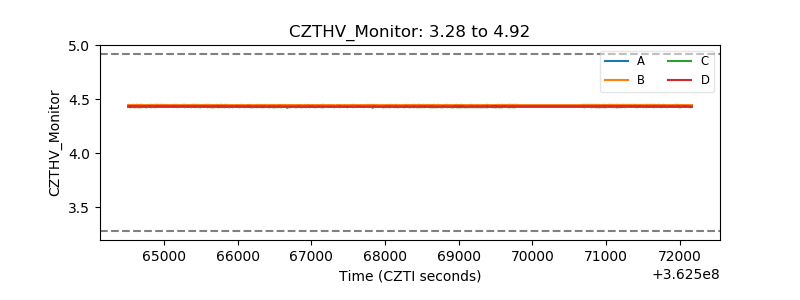 |
| D_VDD | 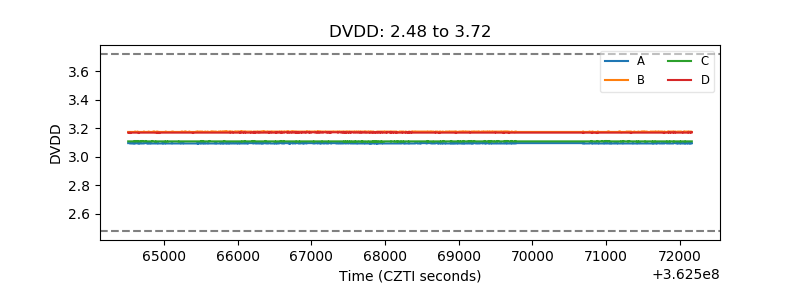 |
| Temperature 1 | 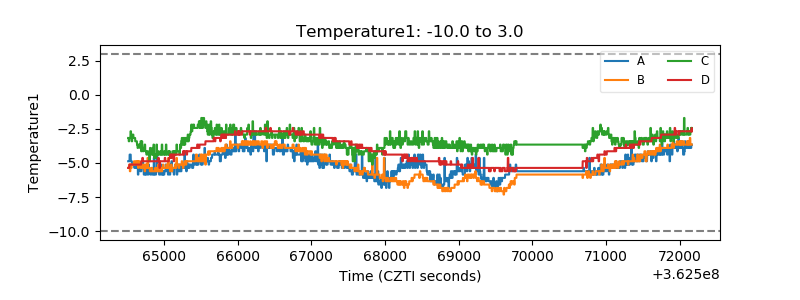 |
| Veto HV Monitor | 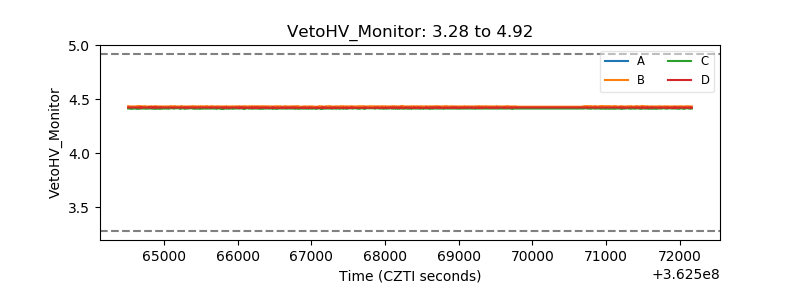 |
| Veto LLD | 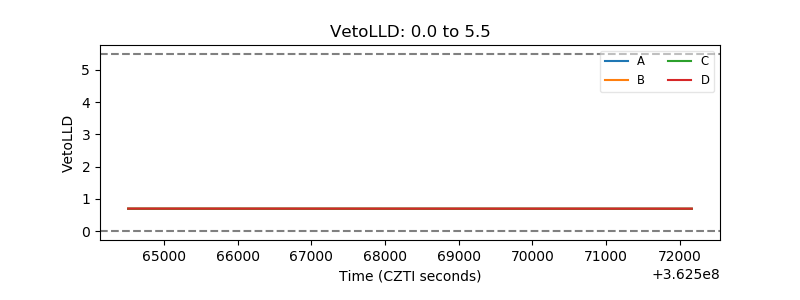 |
| Alpha Counter | 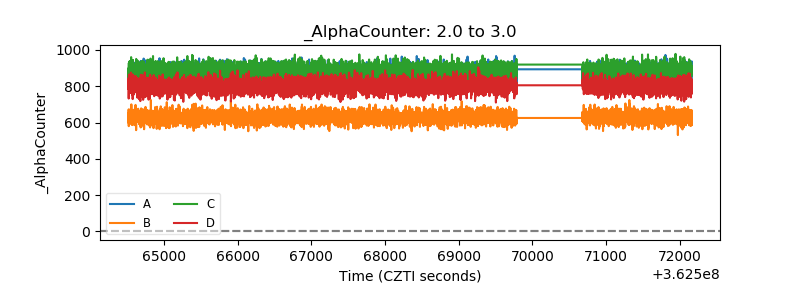 |
| _CPM_Rate | 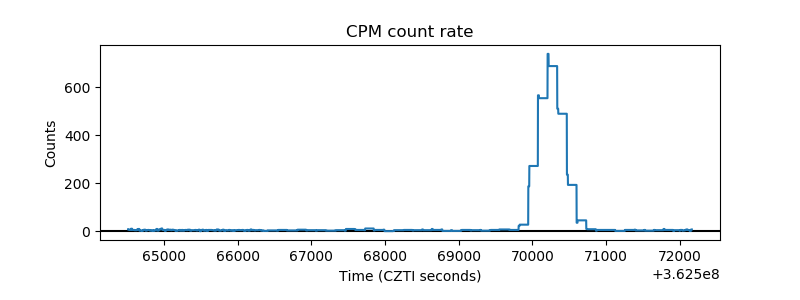 |
| CZT Counter | 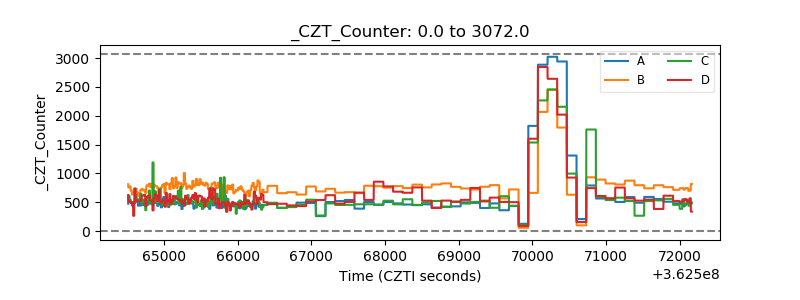 |
| +2.5 Volts monitor |  |
| +5 Volts monitor | 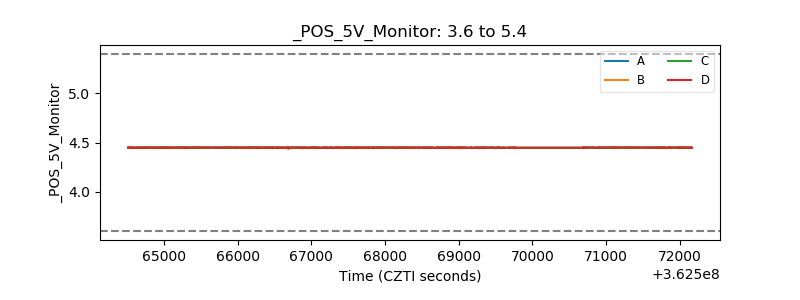 |
| _ROLL_ROT | 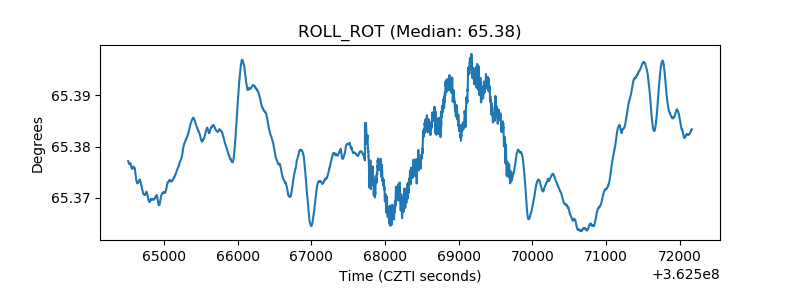 |
| _Roll_DEC | 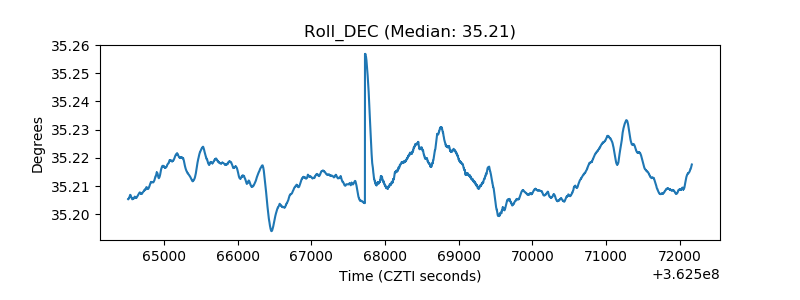 |
| _Roll_RA | 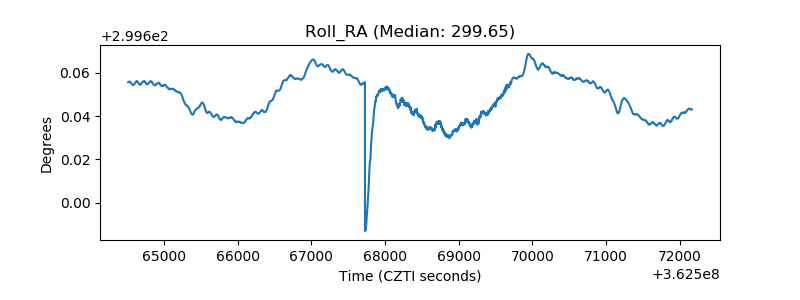 |
| Veto Counter |  |