| Param | Original file | Final file |
|---|---|---|
| Filename | modeM0/AS1A10_109T01_9000004492_31088cztM0_level2.evt | modeM0/AS1A10_109T01_9000004492_31088cztM0_level2_quad_clean.evt |
| Size (bytes) | 571,645,440 | 79,839,360 |
| Size | 545.2 MB | 76.1 MB |
| Events in quadrant A | 3,538,166 | 499,506 |
| Events in quadrant B | 5,418,975 | 492,540 |
| Events in quadrant C | 3,904,538 | 475,885 |
| Events in quadrant D | 3,985,290 | 470,905 |
| Mode M0 | |||
|---|---|---|---|
| Quadrant | BADHDUFLAG | Total packets | Discarded packets |
| A | 0 | 14701 | 2 |
| B | 0 | 20951 | 2 |
| C | 0 | 15759 | 2 |
| D | 0 | 16158 | 2 |
| Mode SS | |||
|---|---|---|---|
| Quadrant | BADHDUFLAG | Total packets | Discarded packets |
| A | 0 | 140 | 0 |
| B | 0 | 140 | 0 |
| C | 0 | 140 | 0 |
| D | 0 | 140 | 0 |
| Mode M9 | |||
|---|---|---|---|
| Quadrant | BADHDUFLAG | Total packets | Discarded packets |
| A | 0 | 20 | 0 |
| B | 0 | 20 | 0 |
| C | 0 | 20 | 0 |
| D | 0 | 20 | 0 |
| Quadrant | Total seconds | Saturated seconds | Saturation percentage |
|---|---|---|---|
| A | 6876 | 124 | 1.803374% |
| B | 6877 | 204 | 2.966410% |
| C | 6877 | 238 | 3.460811% |
| D | 6877 | 96 | 1.395958% |
Noise dominated data is calculated using 1-second bins in cleaned event files. If a bin has >2000 counts, and if more than 50% of those come from <1% of pixels, then it is considered to be noise-dominated and hence unusable.
| Quadrant | # 1 sec bins | Bins with >0 counts | Bins with >2000 counts | High rate bins dominated by noise | Noise dominated (total time) | Noise dominated (detector-on time) | Marked lightcurve |
|---|---|---|---|---|---|---|---|
| A | 8791 | 6878 | 0 | 0 | 0.00% | 0.00% | 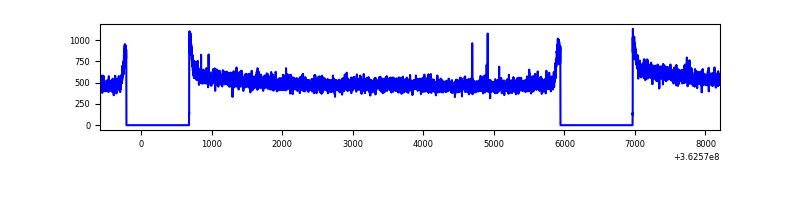 |
| B | 8792 | 6879 | 0 | 0 | 0.00% | 0.00% | 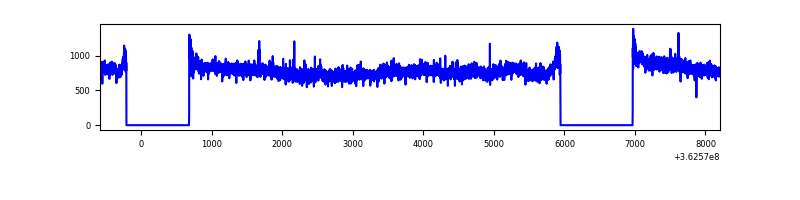 |
| C | 8792 | 6879 | 16 | 16 | 0.18% | 0.23% | 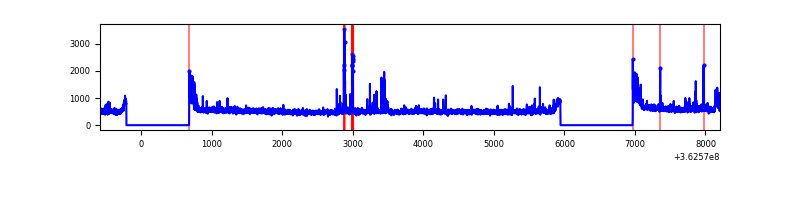 |
| D | 8792 | 6879 | 2 | 2 | 0.02% | 0.03% | 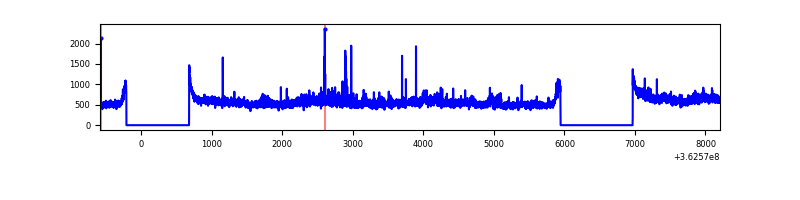 |
Top three noisy pixels from each quadrant. If the there are fewer than three noisy pixels in the level2.evt file, extra rows are filled as -1
| Pixel properties | Quadrant properties | ||||||
|---|---|---|---|---|---|---|---|
| Quadrant | DetID | PixID | Counts | Sigma | Mean | Median | Sigma |
| A | 13 | 254 | 12321 | 63.21 | 915 | 900 | 180.7 |
| A | 3 | 137 | 9246 | 46.19 | 915 | 900 | 180.7 |
| A | 0 | 226 | 7757 | 37.95 | 915 | 900 | 180.7 |
| B | 6 | 159 | 1853092 | 10781.58 | 894 | 874 | 171.8 |
| B | 12 | 111 | 21528 | 120.22 | 894 | 874 | 171.8 |
| B | 0 | 230 | 21477 | 119.93 | 894 | 874 | 171.8 |
| C | 0 | 10 | 209614 | 1034.18 | 864 | 872 | 201.8 |
| C | 10 | 22 | 147945 | 728.65 | 864 | 872 | 201.8 |
| C | 14 | 238 | 140451 | 691.52 | 864 | 872 | 201.8 |
| D | 8 | 195 | 378564 | 1831.2 | 882 | 861 | 206.3 |
| D | 13 | 174 | 216490 | 1045.42 | 882 | 861 | 206.3 |
| D | 2 | 234 | 29688 | 139.76 | 882 | 861 | 206.3 |
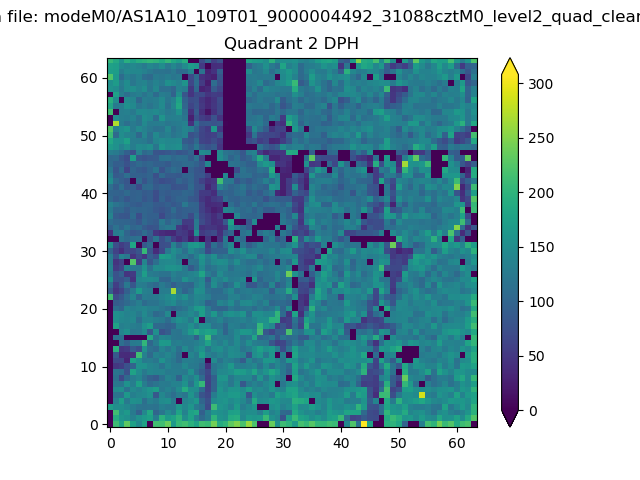
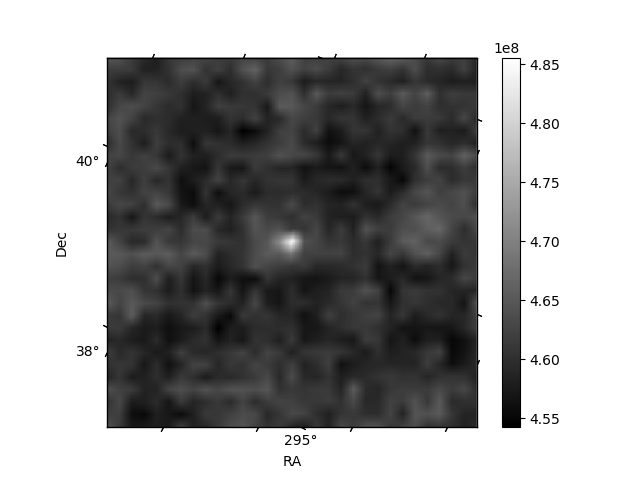
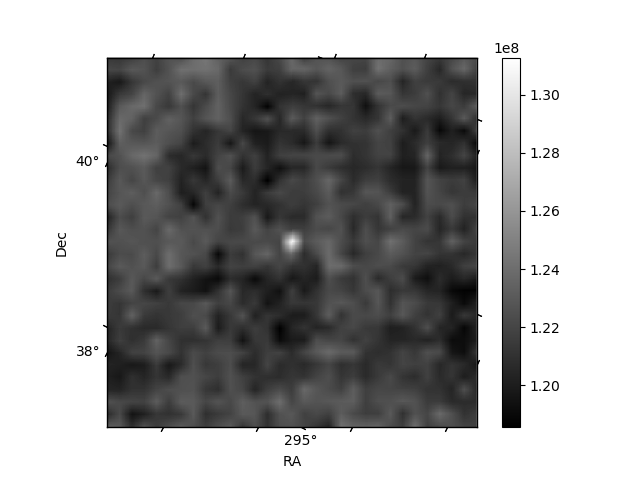
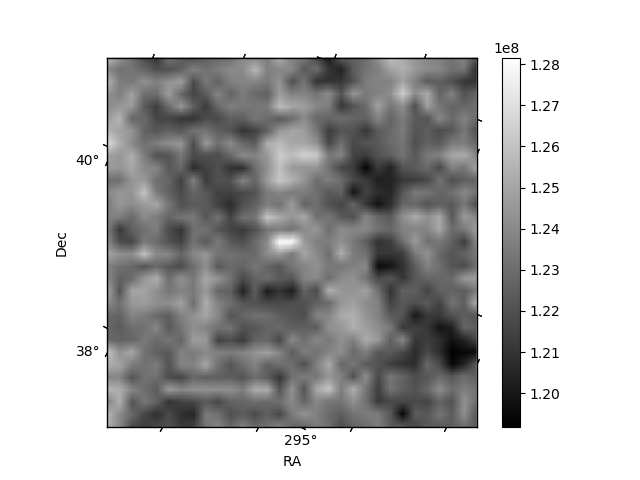
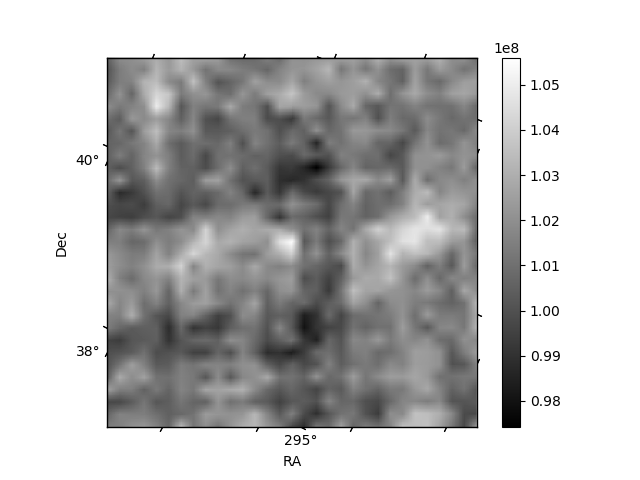
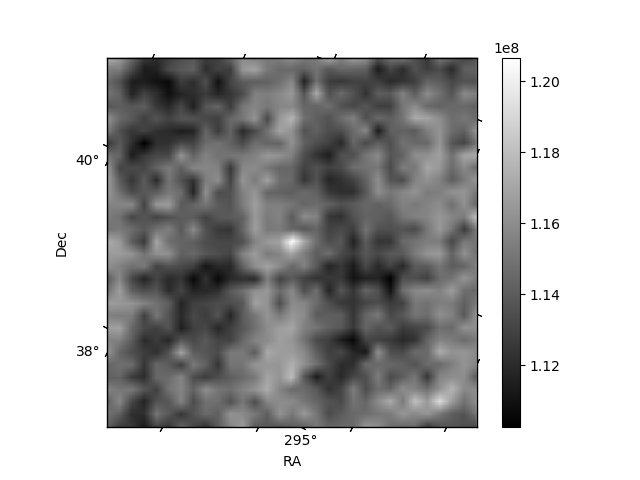
Histogram calculated using DETX and DETY for each event in the final _common_clean file
| Quadrant A | 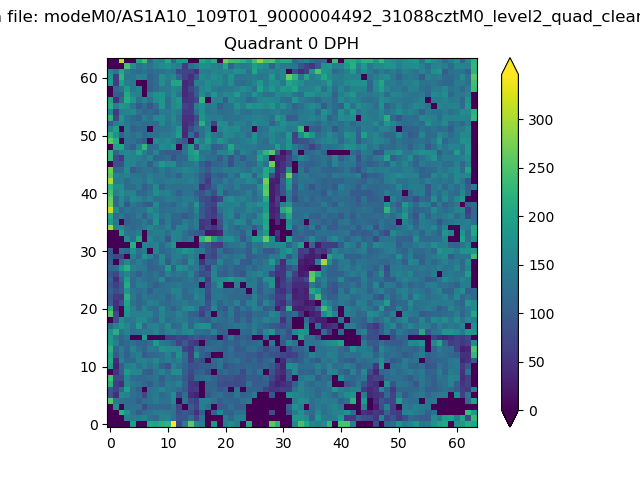 |
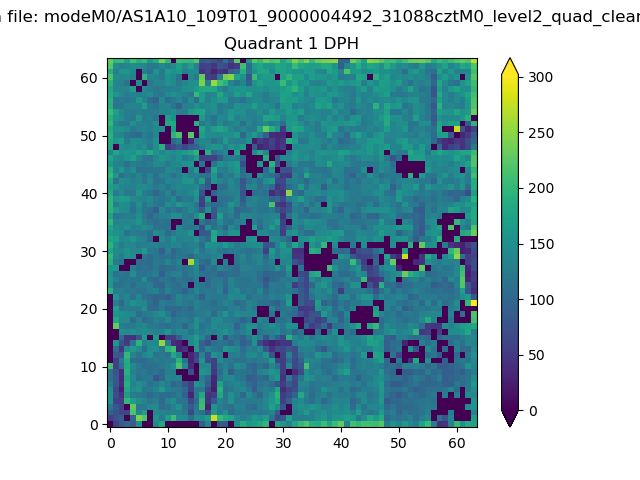 |
Quadrant B |
|---|---|---|---|
| Quadrant D | 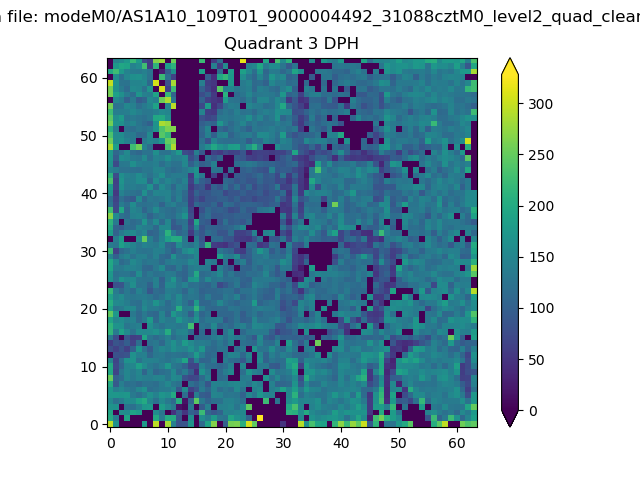 |
 |
Quadrant C |
| Plot type | Count rate plots | Images |
|---|---|---|
| Comparison with Poisson distribution Blue bars denote a histogram of data divided into 1 sec bins. Red curve is a Poisson curve with rate = median count rate of data. |
 |
 |
| Quadrant-wise count rates Data is divided into 100 sec bins |
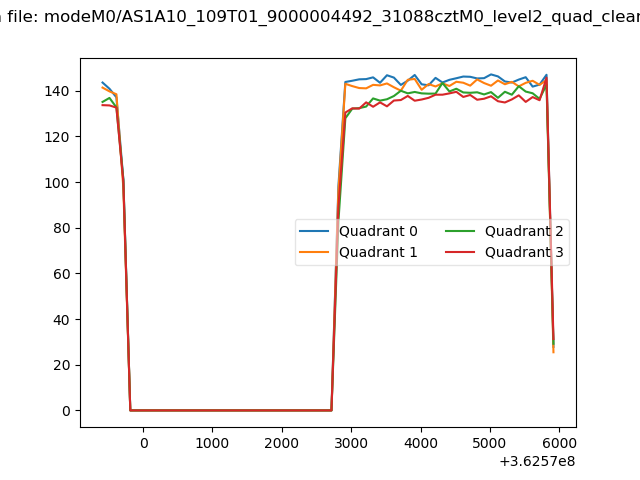 |
|
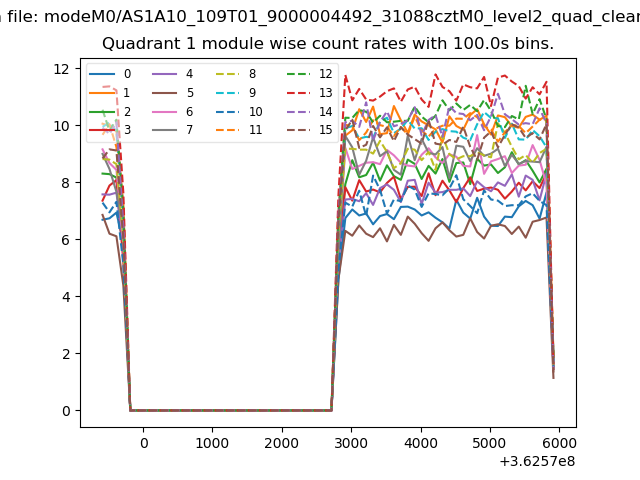
| Module-wise count rates for Quadrant A Data is divided into 100 sec bins |
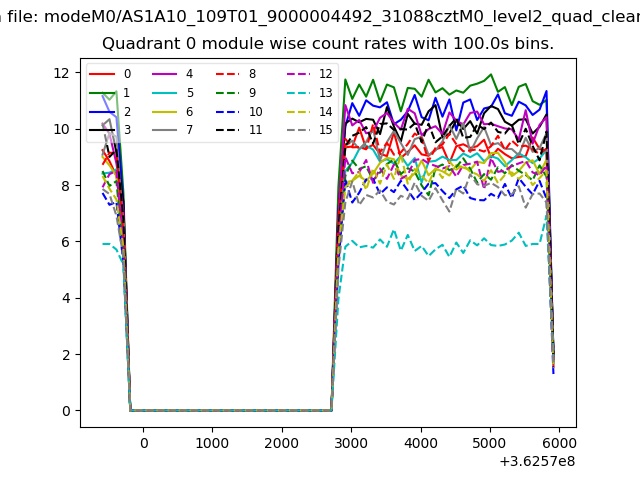 |
 |
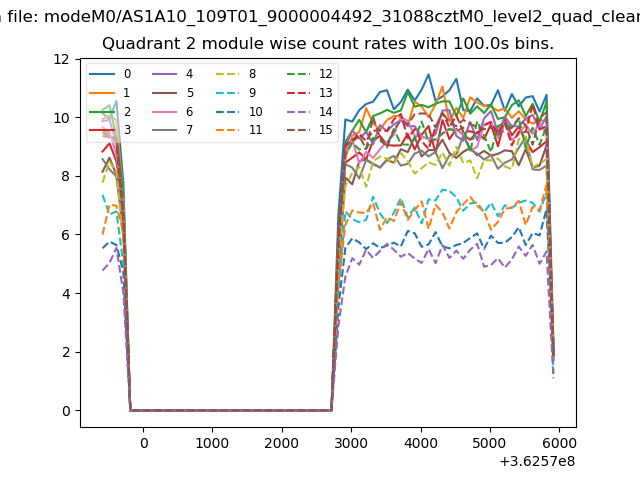
| Module-wise count rates for Quadrant B Data is divided into 100 sec bins |
 |
 |
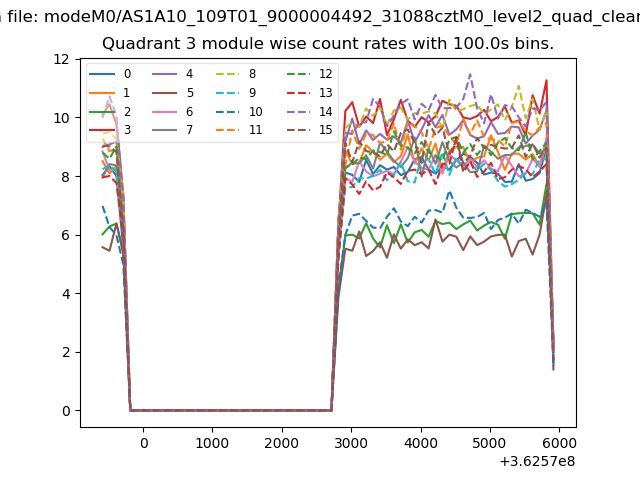
| Module-wise count rates for Quadrant C Data is divided into 100 sec bins |
 |
 |
| Module-wise count rates for Quadrant D Data is divided into 100 sec bins |
 |
 |
| Parameter | Plot |
|---|---|
| CZT HV Monitor | 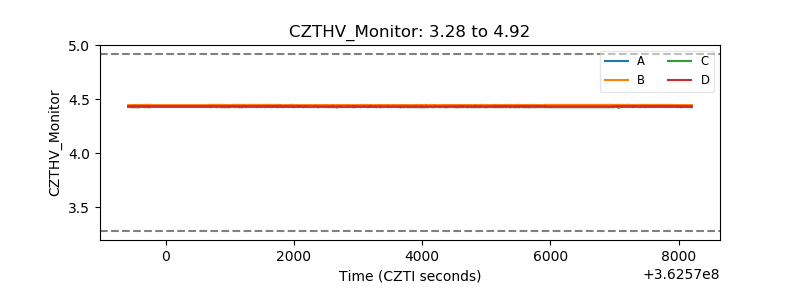 |
| D_VDD | 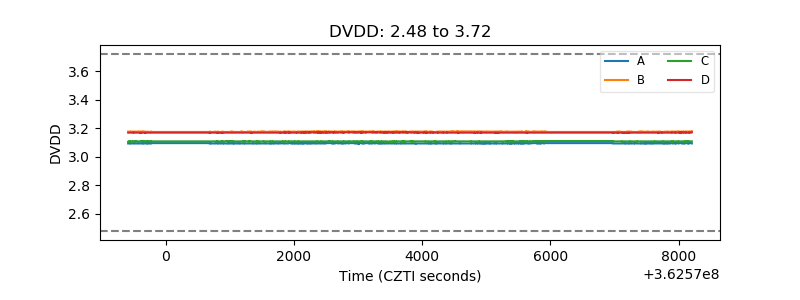 |
| Temperature 1 | 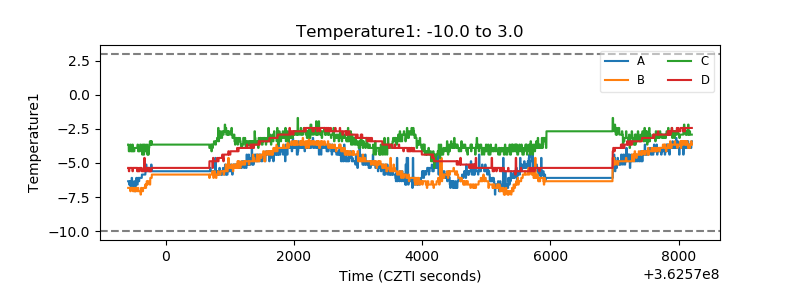 |
| Veto HV Monitor | 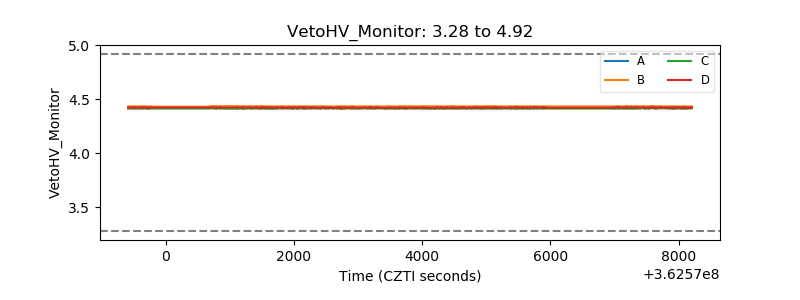 |
| Veto LLD | 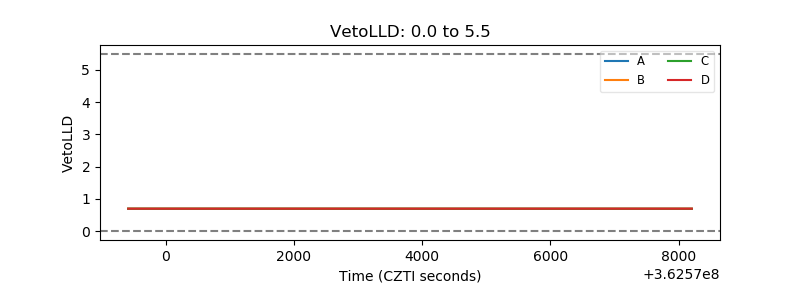 |
| Alpha Counter | 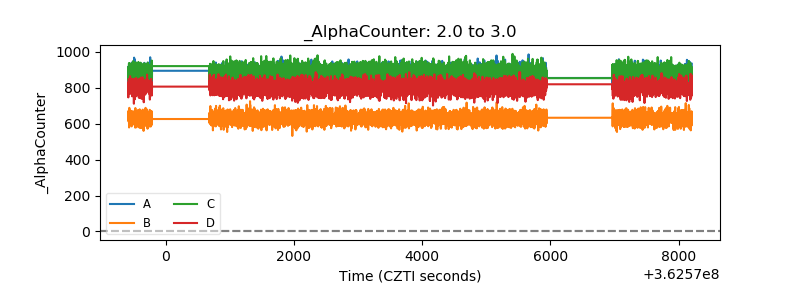 |
| _CPM_Rate | 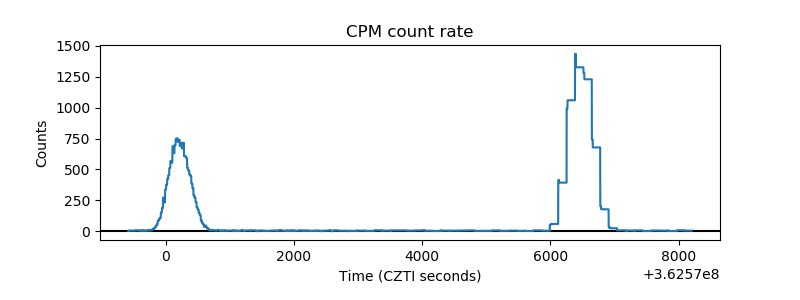 |
| CZT Counter | 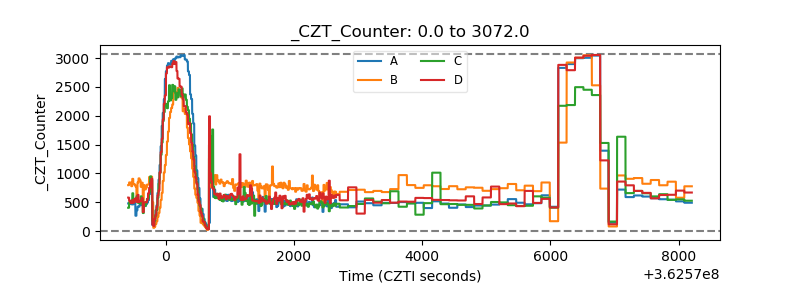 |
| +2.5 Volts monitor |  |
| +5 Volts monitor |  |
| _ROLL_ROT | 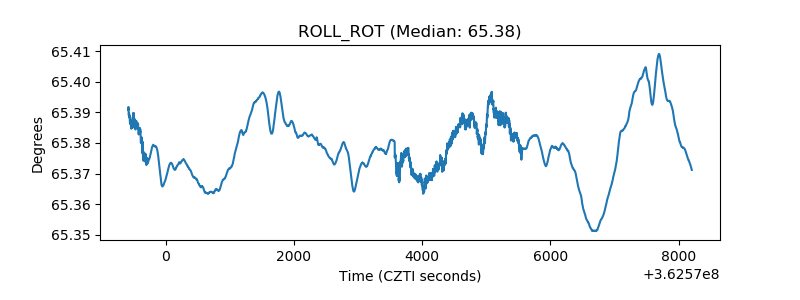 |
| _Roll_DEC | 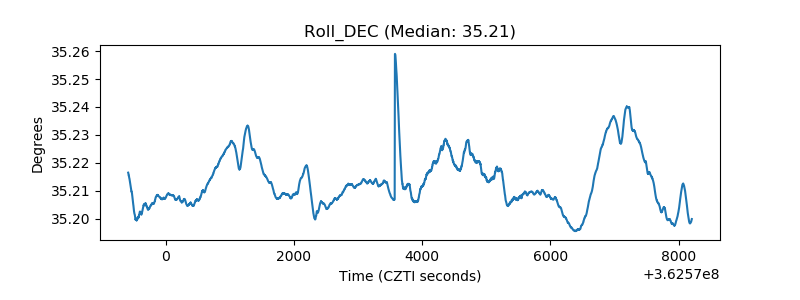 |
| _Roll_RA | 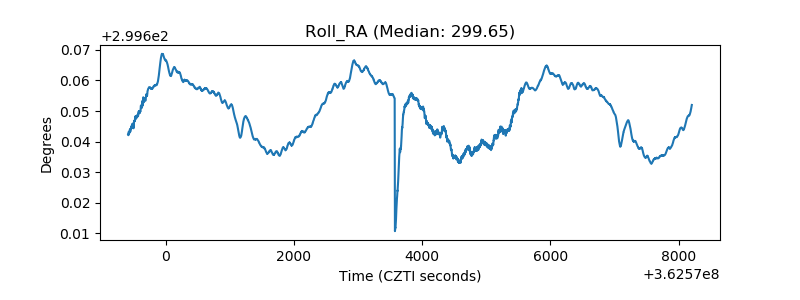 |
| Veto Counter | 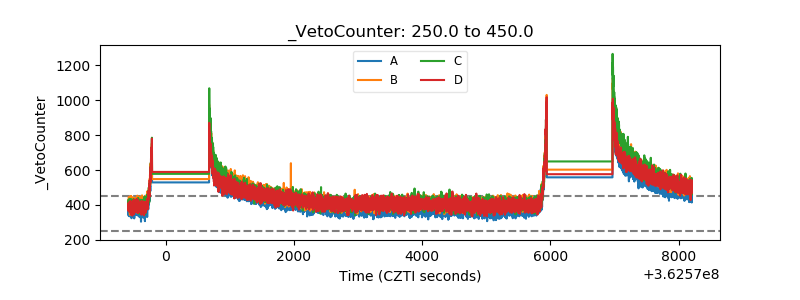 |