| Param | Original file | Final file |
|---|---|---|
| Filename | modeM0/AS1A10_109T01_9000004492_31091cztM0_level2.evt | modeM0/AS1A10_109T01_9000004492_31091cztM0_level2_quad_clean.evt |
| Size (bytes) | 590,754,240 | 102,240,000 |
| Size | 563.4 MB | 97.5 MB |
| Events in quadrant A | 3,628,418 | 678,246 |
| Events in quadrant B | 5,383,194 | 673,935 |
| Events in quadrant C | 4,122,692 | 654,745 |
| Events in quadrant D | 4,321,773 | 640,960 |
| Mode M0 | |||
|---|---|---|---|
| Quadrant | BADHDUFLAG | Total packets | Discarded packets |
| A | 0 | 15057 | 2 |
| B | 0 | 20053 | 2 |
| C | 0 | 16508 | 2 |
| D | 0 | 17237 | 2 |
| Mode SS | |||
|---|---|---|---|
| Quadrant | BADHDUFLAG | Total packets | Discarded packets |
| A | 0 | 132 | 0 |
| B | 0 | 132 | 0 |
| C | 0 | 132 | 0 |
| D | 0 | 132 | 0 |
| Mode M9 | |||
|---|---|---|---|
| Quadrant | BADHDUFLAG | Total packets | Discarded packets |
| A | 0 | 24 | 0 |
| B | 0 | 24 | 0 |
| C | 0 | 24 | 0 |
| D | 0 | 24 | 0 |
| Quadrant | Total seconds | Saturated seconds | Saturation percentage |
|---|---|---|---|
| A | 6423 | 129 | 2.008407% |
| B | 6423 | 212 | 3.300638% |
| C | 6423 | 364 | 5.667134% |
| D | 6423 | 136 | 2.117391% |
Noise dominated data is calculated using 1-second bins in cleaned event files. If a bin has >2000 counts, and if more than 50% of those come from <1% of pixels, then it is considered to be noise-dominated and hence unusable.
| Quadrant | # 1 sec bins | Bins with >0 counts | Bins with >2000 counts | High rate bins dominated by noise | Noise dominated (total time) | Noise dominated (detector-on time) | Marked lightcurve |
|---|---|---|---|---|---|---|---|
| A | 8878 | 6425 | 0 | 0 | 0.00% | 0.00% | 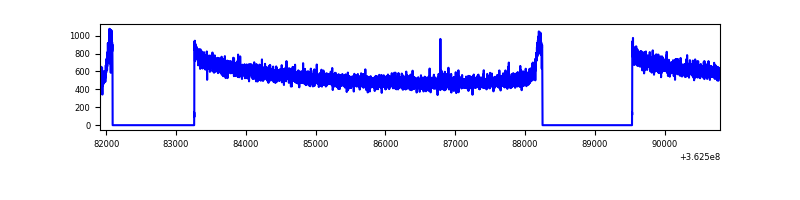 |
| B | 8878 | 6425 | 0 | 0 | 0.00% | 0.00% | 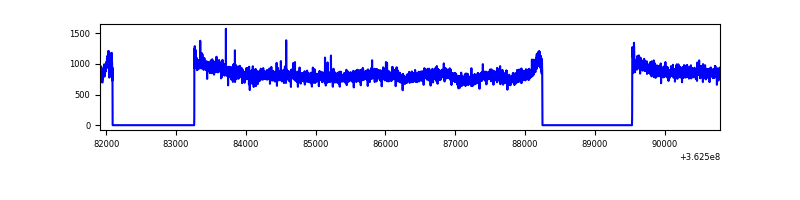 |
| C | 8878 | 6425 | 68 | 68 | 0.77% | 1.06% | 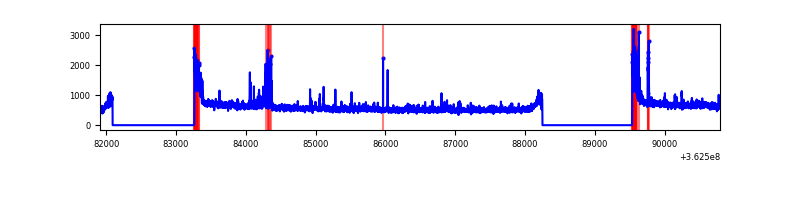 |
| D | 8878 | 6425 | 22 | 22 | 0.25% | 0.34% | 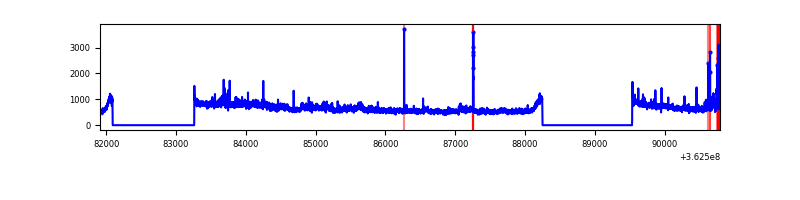 |
Top three noisy pixels from each quadrant. If the there are fewer than three noisy pixels in the level2.evt file, extra rows are filled as -1
| Pixel properties | Quadrant properties | ||||||
|---|---|---|---|---|---|---|---|
| Quadrant | DetID | PixID | Counts | Sigma | Mean | Median | Sigma |
| A | 13 | 254 | 12726 | 64.06 | 941 | 929 | 184.2 |
| A | 3 | 137 | 8810 | 42.79 | 941 | 929 | 184.2 |
| A | 0 | 226 | 7815 | 37.39 | 941 | 929 | 184.2 |
| B | 6 | 159 | 1713780 | 9955.7 | 922 | 903 | 172.0 |
| B | 0 | 183 | 26455 | 148.51 | 922 | 903 | 172.0 |
| B | 12 | 111 | 20755 | 115.39 | 922 | 903 | 172.0 |
| C | 0 | 10 | 322584 | 1554.9 | 897 | 908 | 206.9 |
| C | 14 | 238 | 146224 | 702.42 | 897 | 908 | 206.9 |
| C | 10 | 22 | 121503 | 582.93 | 897 | 908 | 206.9 |
| D | 13 | 174 | 399421 | 1870.57 | 917 | 896 | 213.0 |
| D | 8 | 195 | 335887 | 1572.36 | 917 | 896 | 213.0 |
| D | 1 | 52 | 57020 | 263.43 | 917 | 896 | 213.0 |
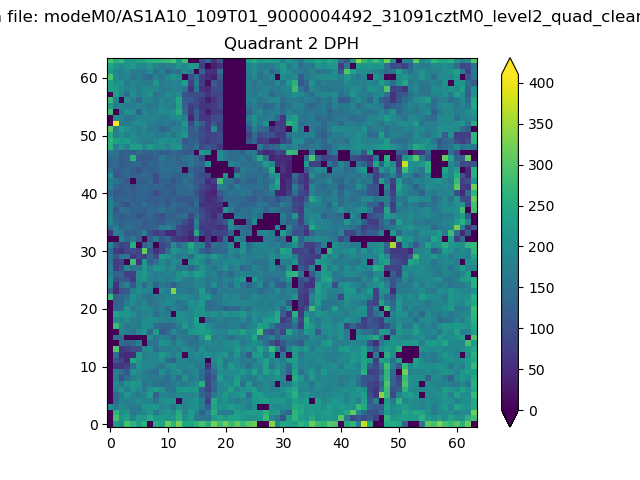
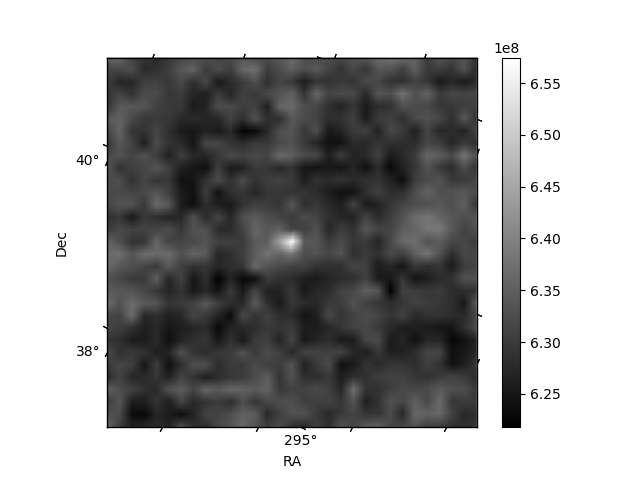
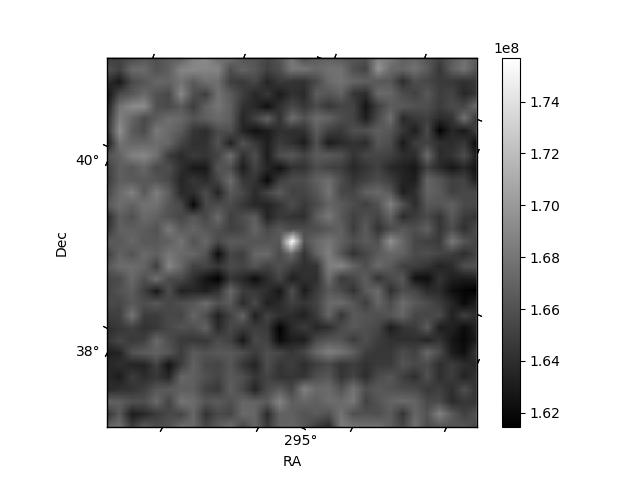
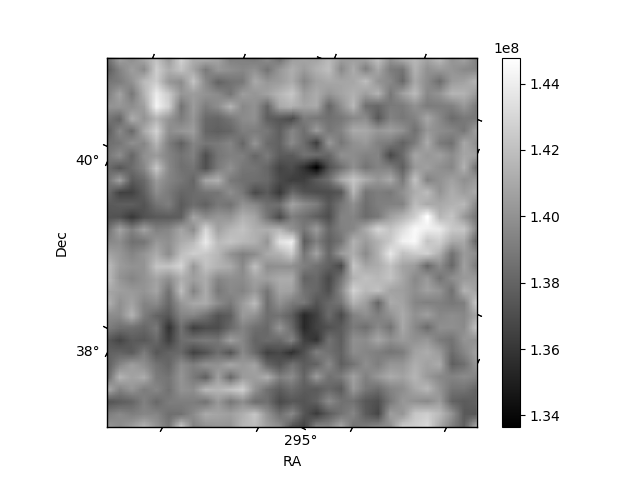
Histogram calculated using DETX and DETY for each event in the final _common_clean file
| Quadrant A | 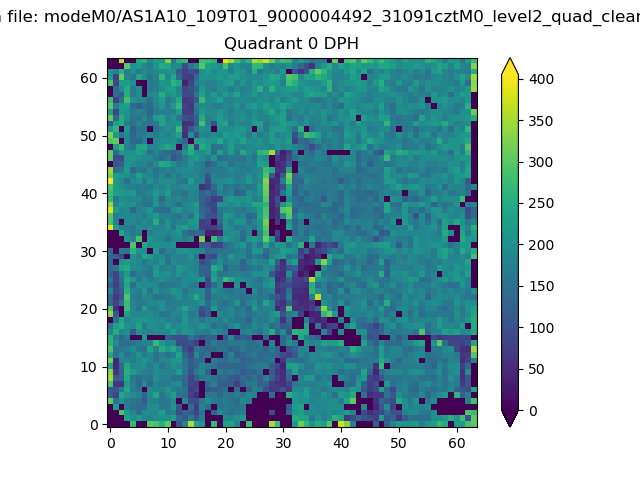 |
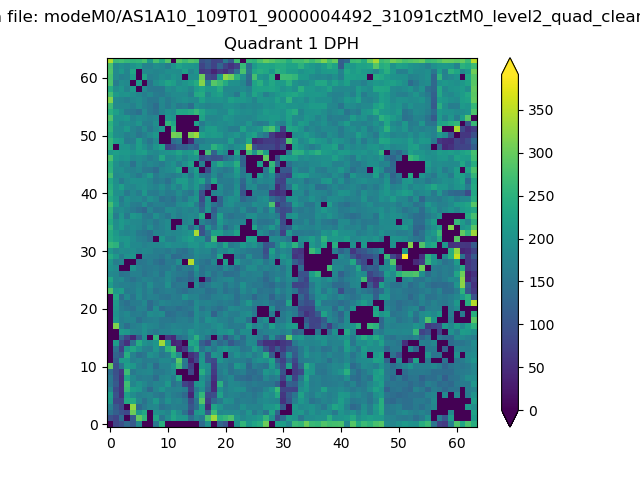 |
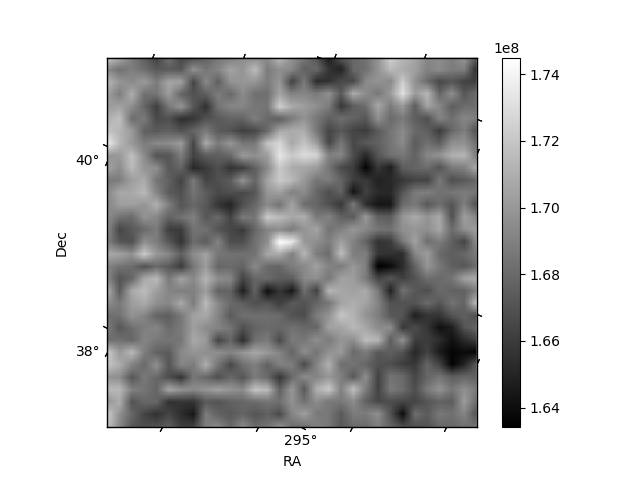
Quadrant B |
|---|---|---|---|
| Quadrant D | 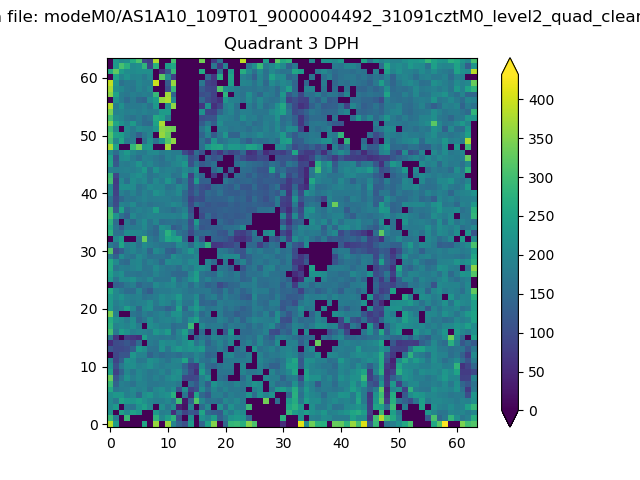 |
 |
Quadrant C |
| Plot type | Count rate plots | Images |
|---|---|---|
| Comparison with Poisson distribution Blue bars denote a histogram of data divided into 1 sec bins. Red curve is a Poisson curve with rate = median count rate of data. |
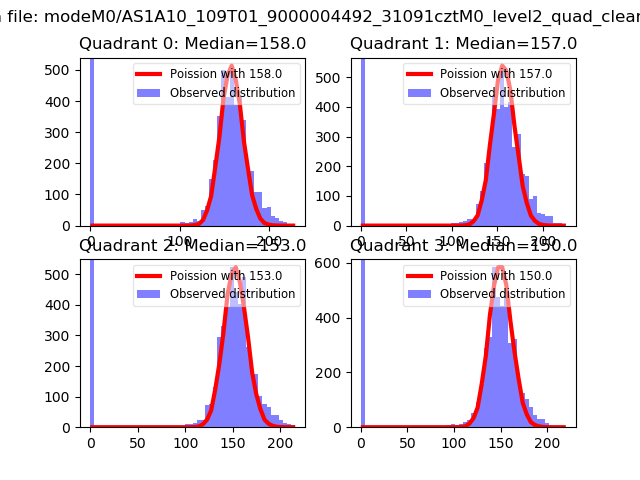 |
 |
| Quadrant-wise count rates Data is divided into 100 sec bins |
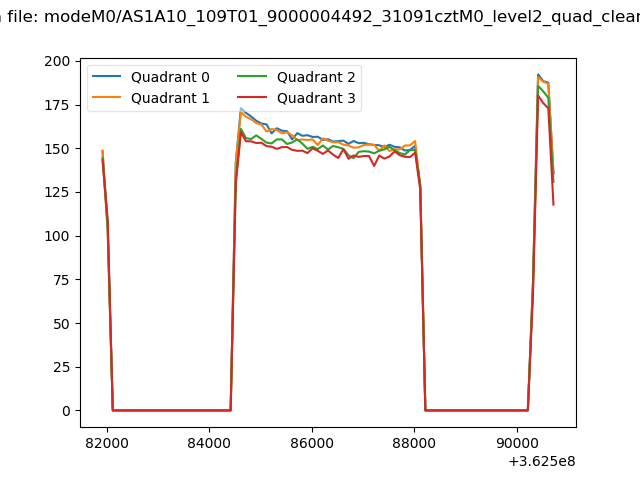 |
|
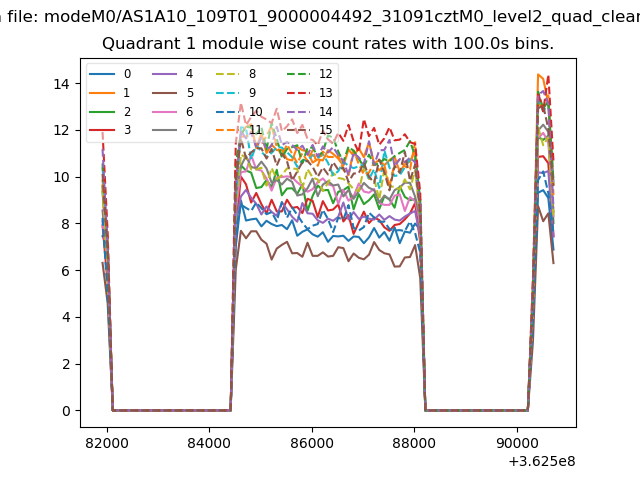
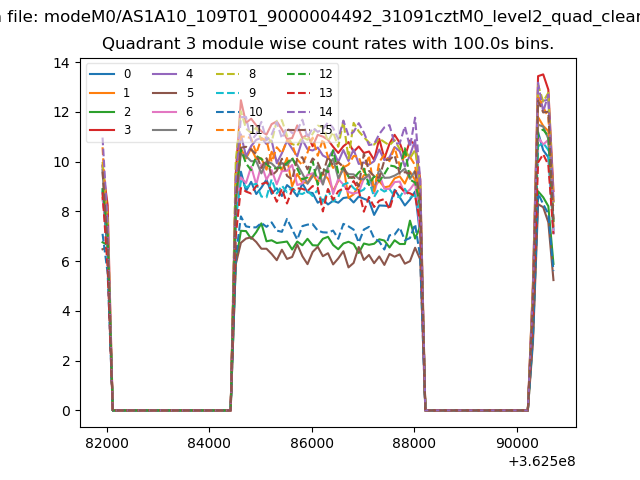
| Module-wise count rates for Quadrant A Data is divided into 100 sec bins |
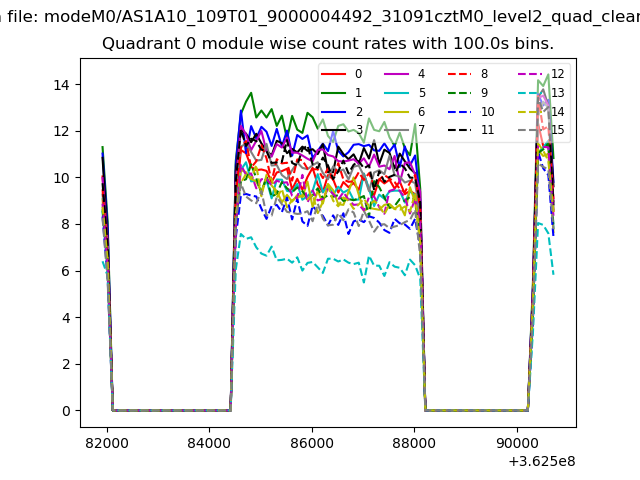 |
 |
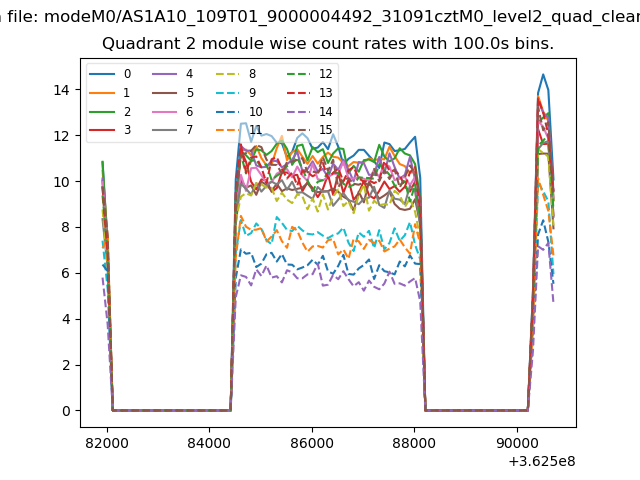
| Module-wise count rates for Quadrant B Data is divided into 100 sec bins |
 |
 |
| Module-wise count rates for Quadrant C Data is divided into 100 sec bins |
 |
 |
| Module-wise count rates for Quadrant D Data is divided into 100 sec bins |
 |
 |
| Parameter | Plot |
|---|---|
| CZT HV Monitor | 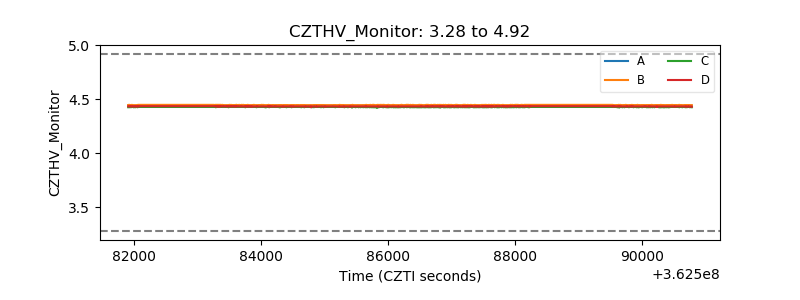 |
| D_VDD | 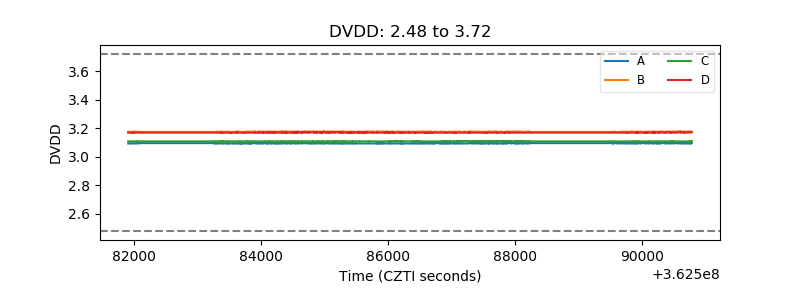 |
| Temperature 1 | 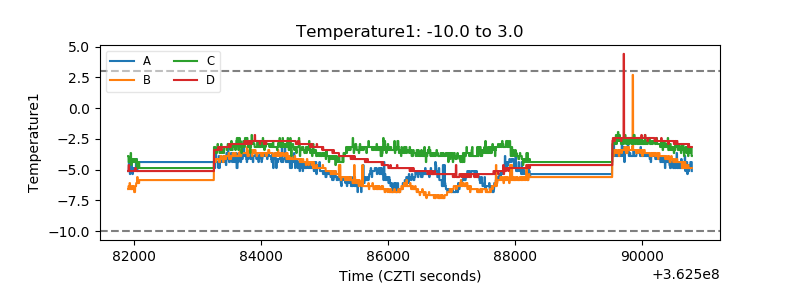 |
| Veto HV Monitor | 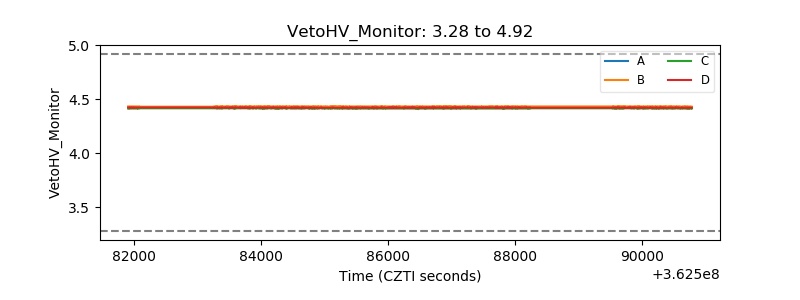 |
| Veto LLD | 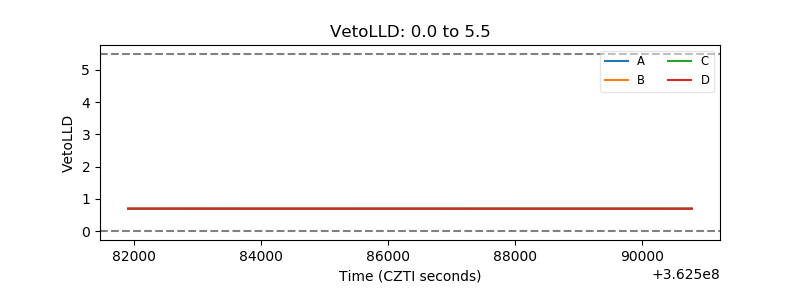 |
| Alpha Counter | 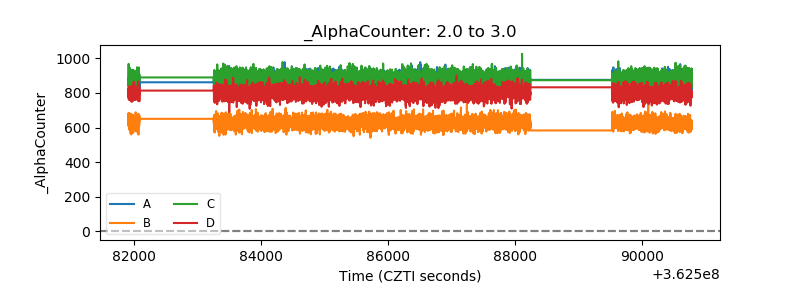 |
| _CPM_Rate | 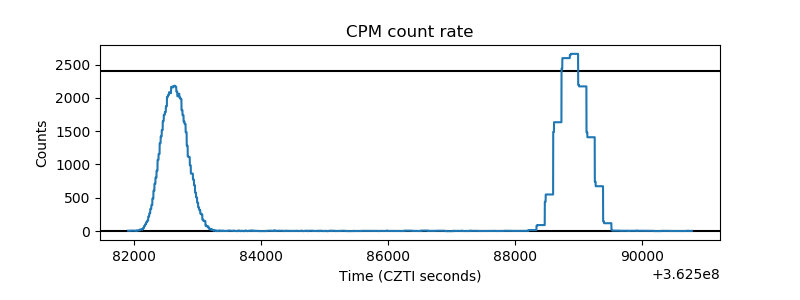 |
| CZT Counter | 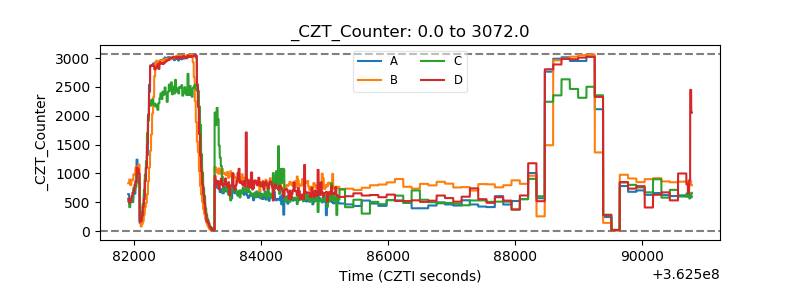 |
| +2.5 Volts monitor |  |
| +5 Volts monitor |  |
| _ROLL_ROT | 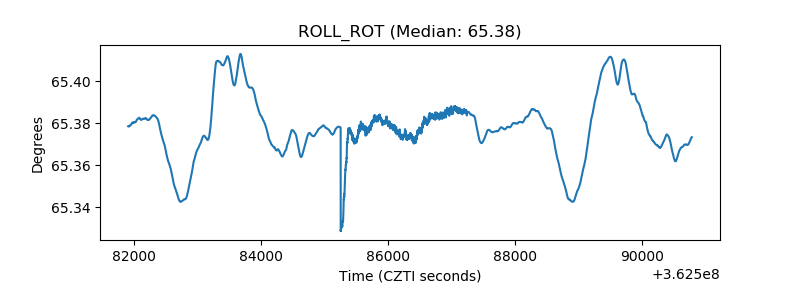 |
| _Roll_DEC | 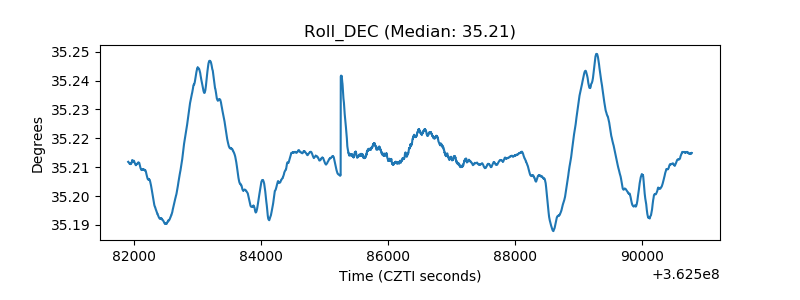 |
| _Roll_RA | 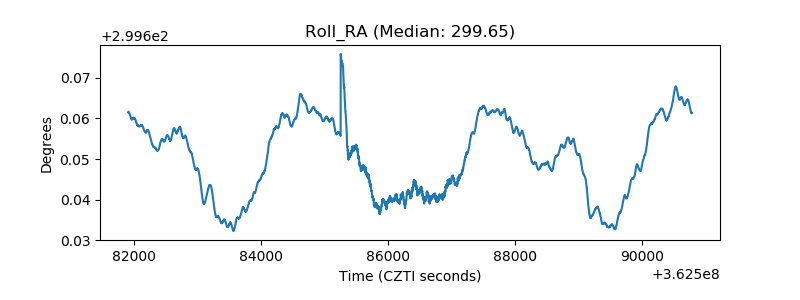 |
| Veto Counter | 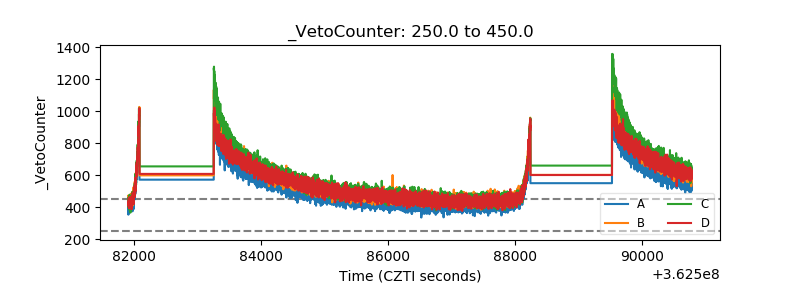 |