| Param | Original file | Final file |
|---|---|---|
| Filename | modeM0/AS1A10_109T01_9000004492_31093cztM0_level2.evt | modeM0/AS1A10_109T01_9000004492_31093cztM0_level2_quad_clean.evt |
| Size (bytes) | 576,388,800 | 124,044,480 |
| Size | 549.7 MB | 118.3 MB |
| Events in quadrant A | 3,451,756 | 843,370 |
| Events in quadrant B | 5,293,432 | 848,996 |
| Events in quadrant C | 3,969,061 | 826,936 |
| Events in quadrant D | 4,320,641 | 803,117 |
| Mode M0 | |||
|---|---|---|---|
| Quadrant | BADHDUFLAG | Total packets | Discarded packets |
| A | 0 | 14280 | 2 |
| B | 0 | 19556 | 2 |
| C | 0 | 16000 | 2 |
| D | 0 | 17574 | 2 |
| Mode SS | |||
|---|---|---|---|
| Quadrant | BADHDUFLAG | Total packets | Discarded packets |
| A | 0 | 128 | 0 |
| B | 0 | 128 | 0 |
| C | 0 | 128 | 0 |
| D | 0 | 128 | 0 |
| Mode M9 | |||
|---|---|---|---|
| Quadrant | BADHDUFLAG | Total packets | Discarded packets |
| A | 0 | 21 | 0 |
| B | 0 | 22 | 0 |
| C | 0 | 22 | 0 |
| D | 0 | 22 | 0 |
| Quadrant | Total seconds | Saturated seconds | Saturation percentage |
|---|---|---|---|
| A | 6222 | 76 | 1.221472% |
| B | 6222 | 195 | 3.134041% |
| C | 6222 | 327 | 5.255545% |
| D | 6222 | 92 | 1.478624% |
Noise dominated data is calculated using 1-second bins in cleaned event files. If a bin has >2000 counts, and if more than 50% of those come from <1% of pixels, then it is considered to be noise-dominated and hence unusable.
| Quadrant | # 1 sec bins | Bins with >0 counts | Bins with >2000 counts | High rate bins dominated by noise | Noise dominated (total time) | Noise dominated (detector-on time) | Marked lightcurve |
|---|---|---|---|---|---|---|---|
| A | 7582 | 6223 | 2 | 2 | 0.03% | 0.03% | 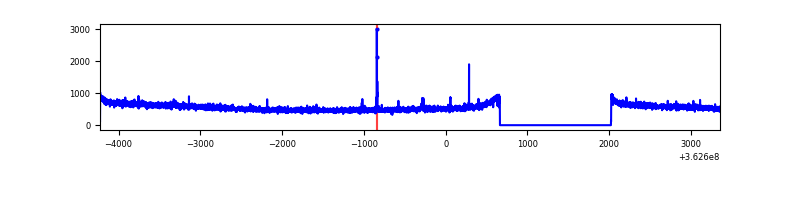 |
| B | 7582 | 6223 | 3 | 3 | 0.04% | 0.05% | 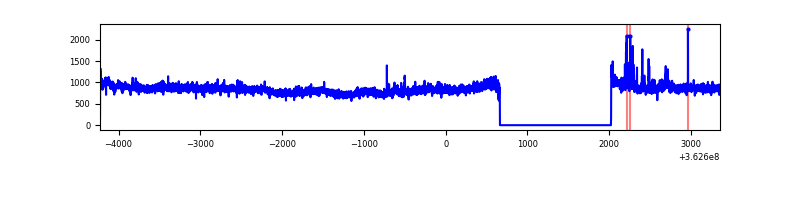 |
| C | 7582 | 6223 | 64 | 64 | 0.84% | 1.03% | 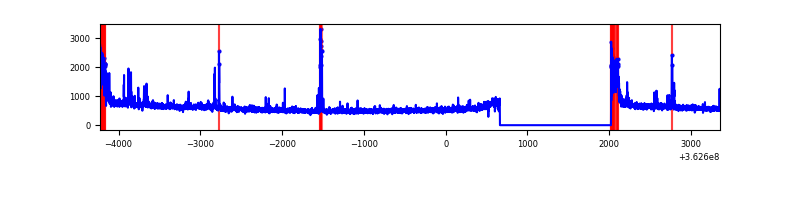 |
| D | 7582 | 6223 | 6 | 6 | 0.08% | 0.10% | 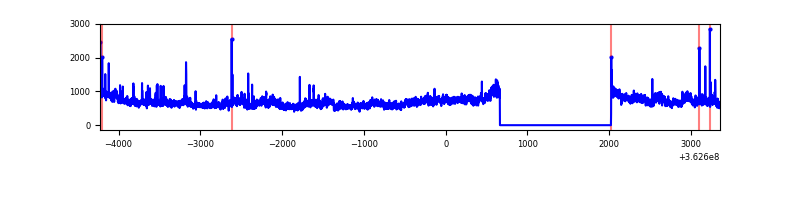 |
Top three noisy pixels from each quadrant. If the there are fewer than three noisy pixels in the level2.evt file, extra rows are filled as -1
| Pixel properties | Quadrant properties | ||||||
|---|---|---|---|---|---|---|---|
| Quadrant | DetID | PixID | Counts | Sigma | Mean | Median | Sigma |
| A | 13 | 254 | 12881 | 68.5 | 889 | 876 | 175.2 |
| A | 15 | 174 | 12004 | 63.5 | 889 | 876 | 175.2 |
| A | 12 | 96 | 10334 | 53.97 | 889 | 876 | 175.2 |
| B | 6 | 159 | 1705616 | 10350.69 | 880 | 860 | 164.7 |
| B | 0 | 229 | 55783 | 333.47 | 880 | 860 | 164.7 |
| B | 0 | 230 | 36975 | 219.28 | 880 | 860 | 164.7 |
| C | 0 | 10 | 327891 | 1645.56 | 864 | 876 | 198.7 |
| C | 14 | 238 | 141885 | 709.57 | 864 | 876 | 198.7 |
| C | 10 | 22 | 105255 | 525.24 | 864 | 876 | 198.7 |
| D | 13 | 174 | 502393 | 2442.17 | 877 | 859 | 205.4 |
| D | 8 | 195 | 437854 | 2127.9 | 877 | 859 | 205.4 |
| D | 2 | 250 | 35300 | 167.71 | 877 | 859 | 205.4 |
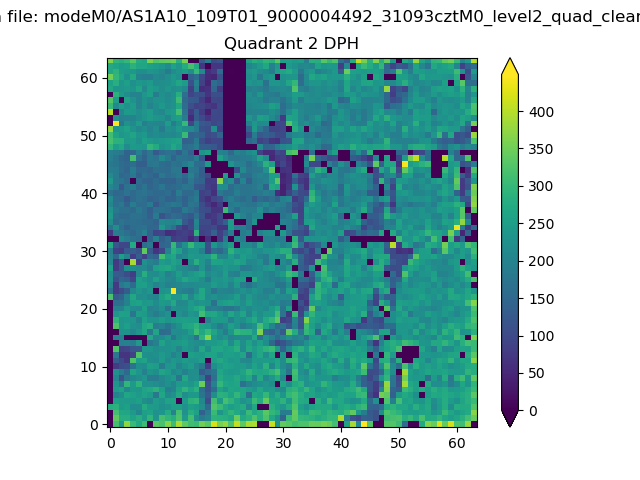
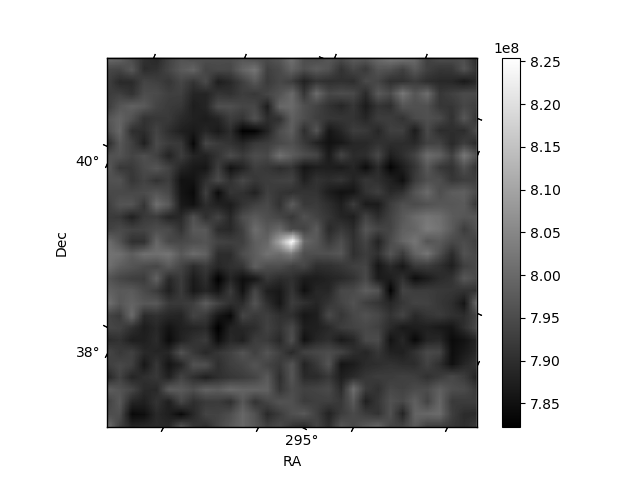
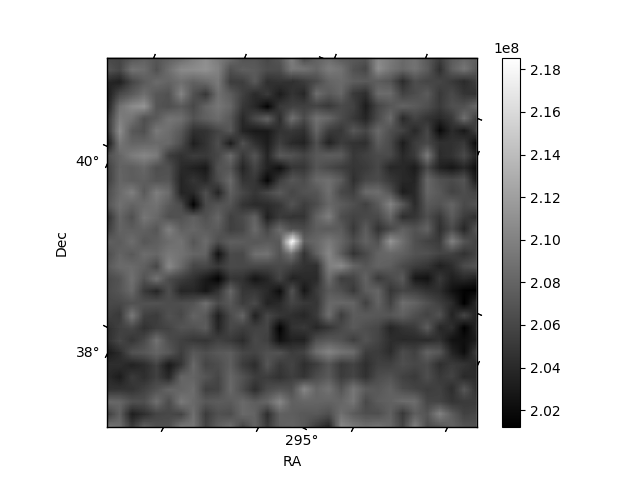
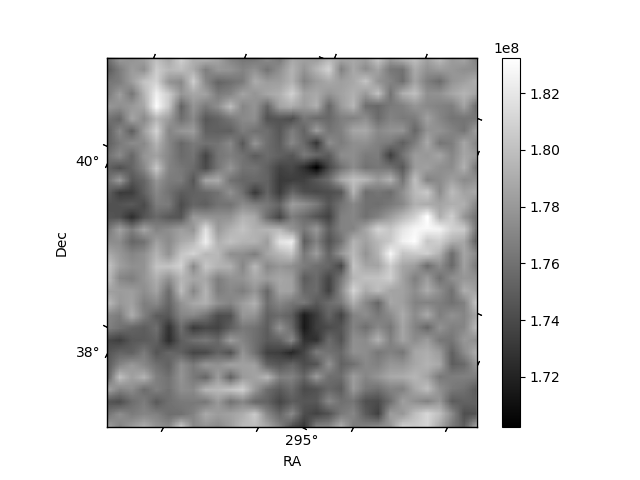
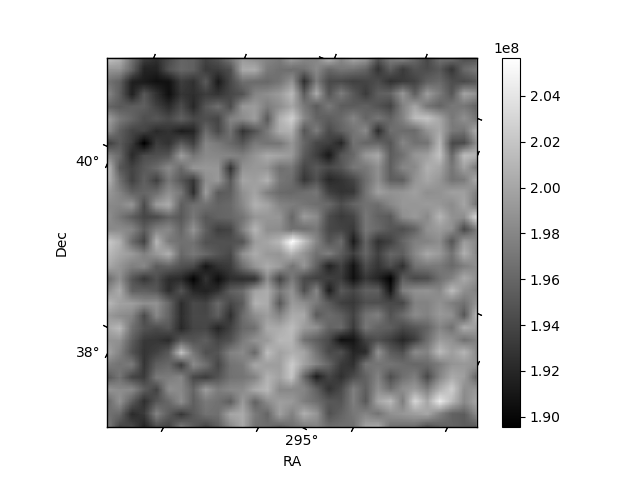
Histogram calculated using DETX and DETY for each event in the final _common_clean file
| Quadrant A | 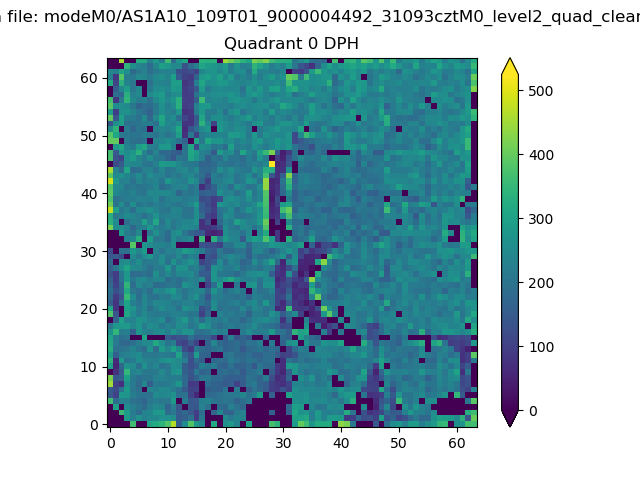 |
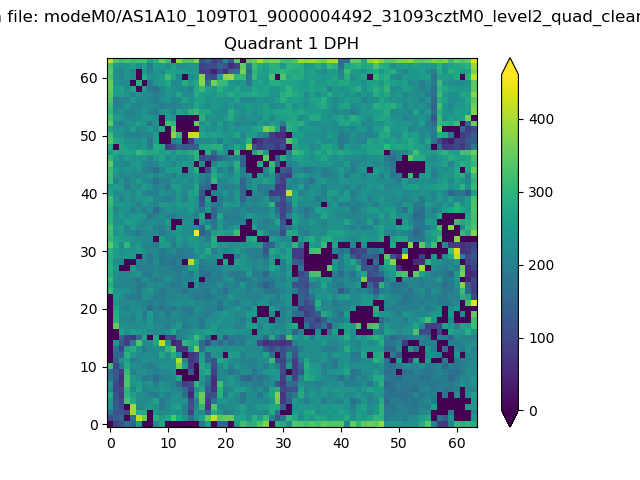 |
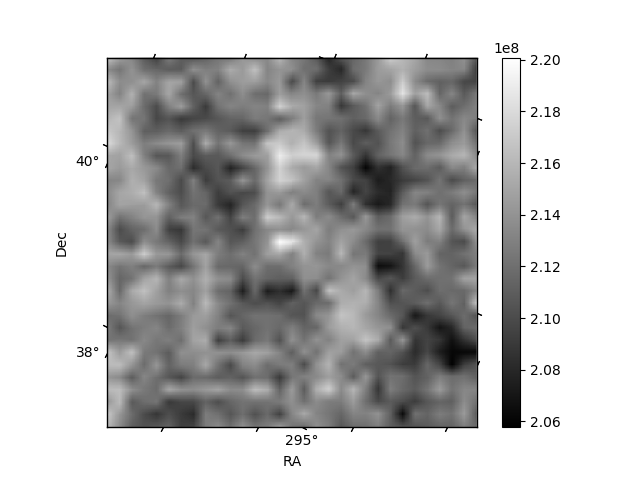
Quadrant B |
|---|---|---|---|
| Quadrant D | 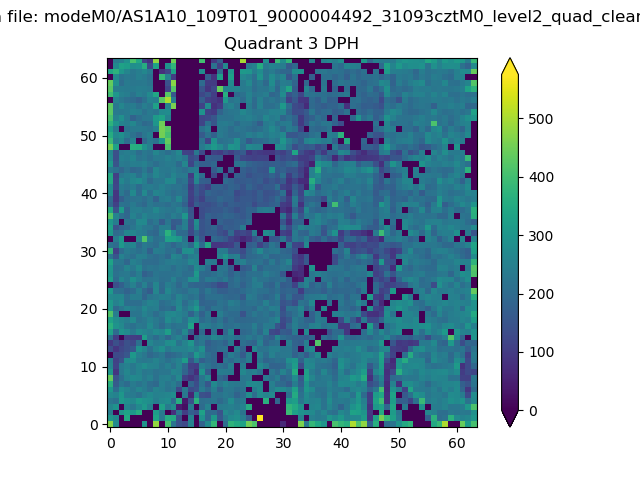 |
 |
Quadrant C |
| Plot type | Count rate plots | Images |
|---|---|---|
| Comparison with Poisson distribution Blue bars denote a histogram of data divided into 1 sec bins. Red curve is a Poisson curve with rate = median count rate of data. |
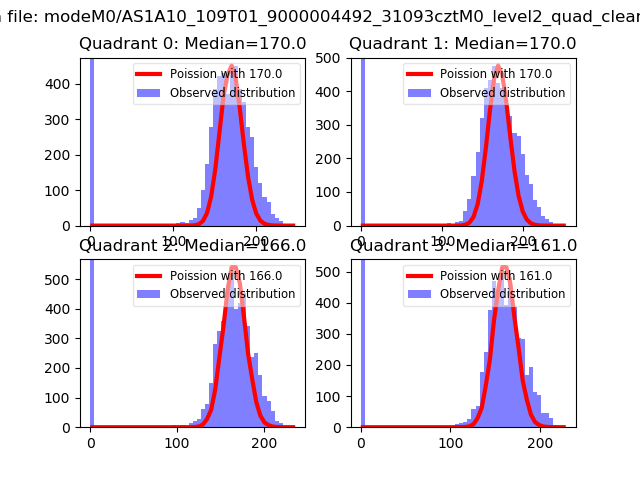 |
 |
| Quadrant-wise count rates Data is divided into 100 sec bins |
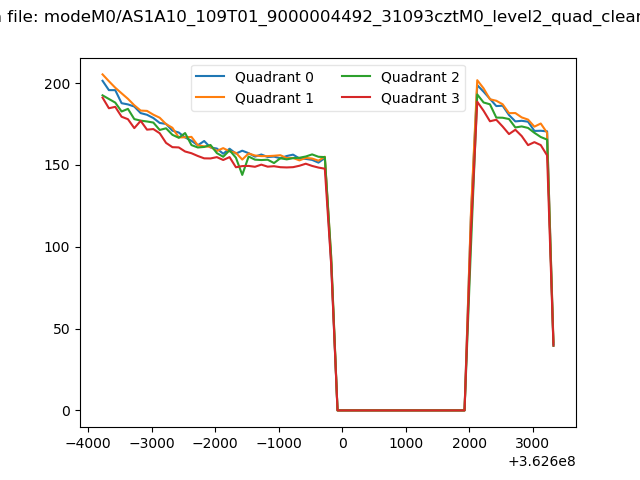 |
|
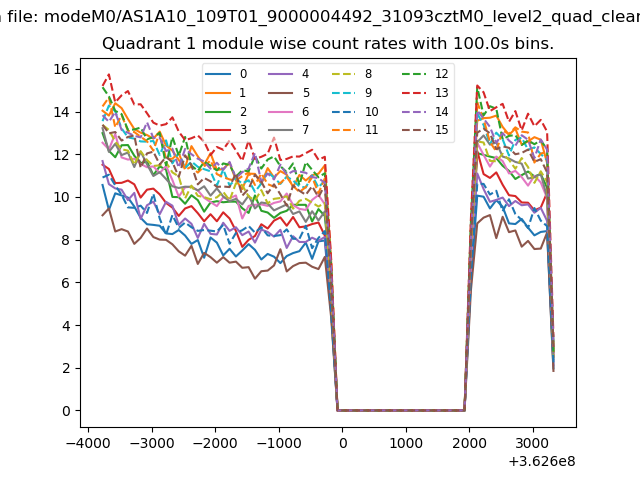
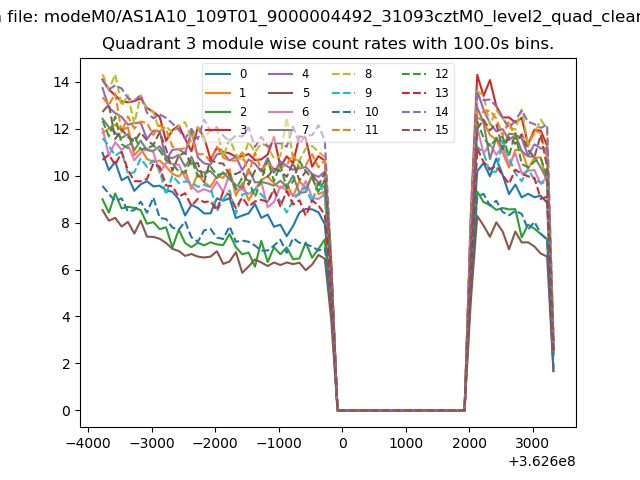
| Module-wise count rates for Quadrant A Data is divided into 100 sec bins |
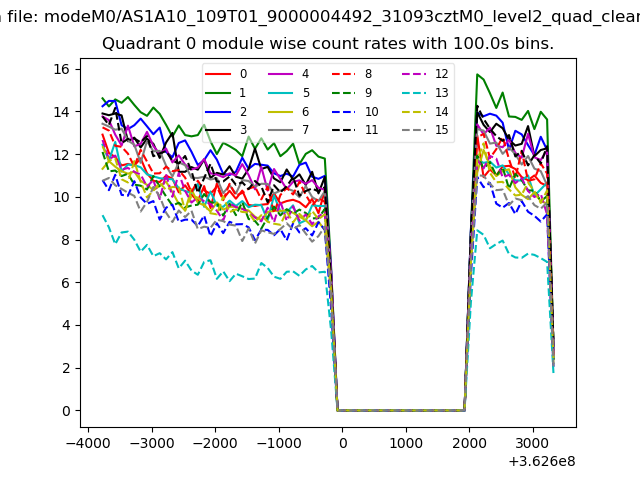 |
 |
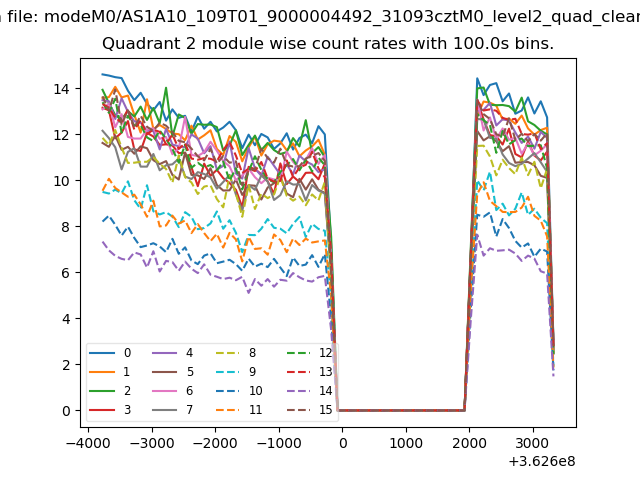
| Module-wise count rates for Quadrant B Data is divided into 100 sec bins |
 |
 |
| Module-wise count rates for Quadrant C Data is divided into 100 sec bins |
 |
 |
| Module-wise count rates for Quadrant D Data is divided into 100 sec bins |
 |
 |
| Parameter | Plot |
|---|---|
| CZT HV Monitor | 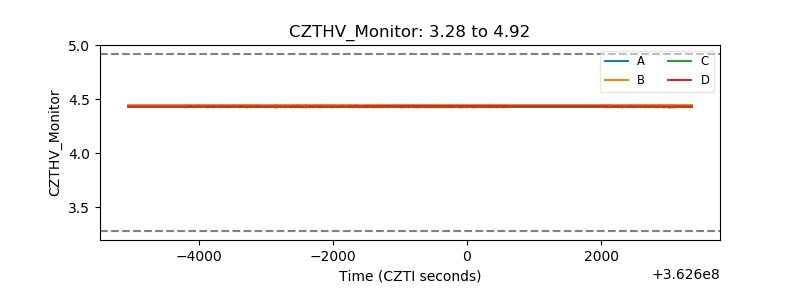 |
| D_VDD | 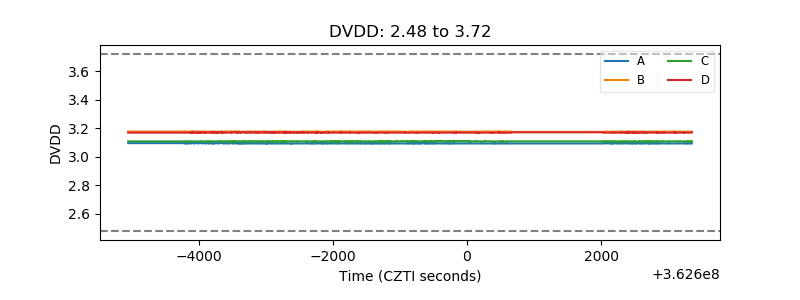 |
| Temperature 1 | 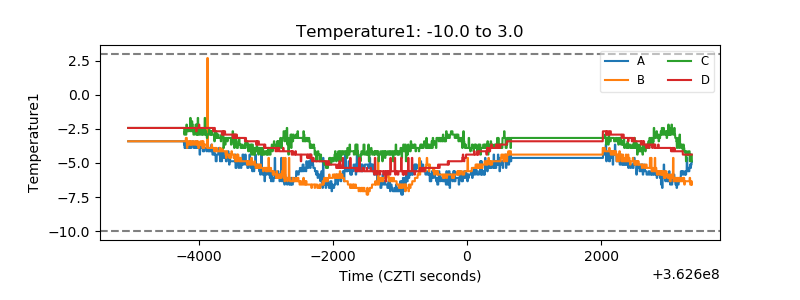 |
| Veto HV Monitor | 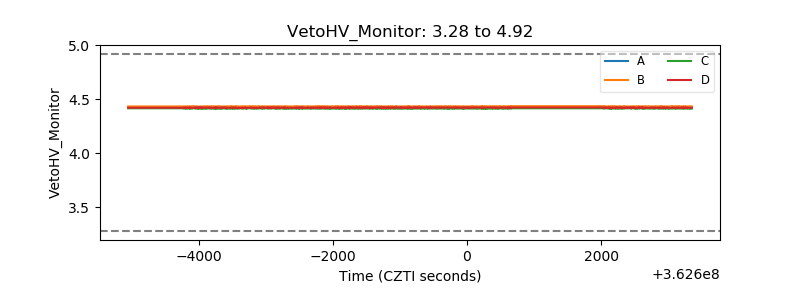 |
| Veto LLD |  |
| Alpha Counter | 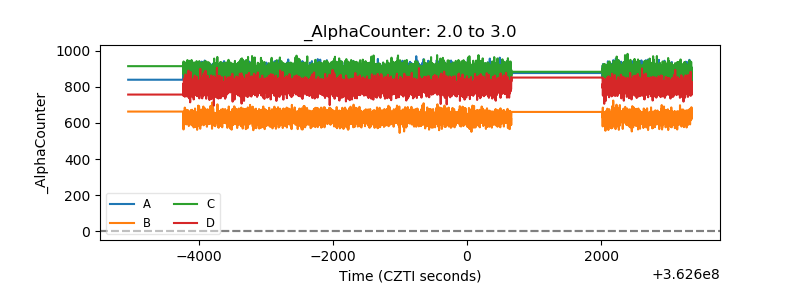 |
| _CPM_Rate | 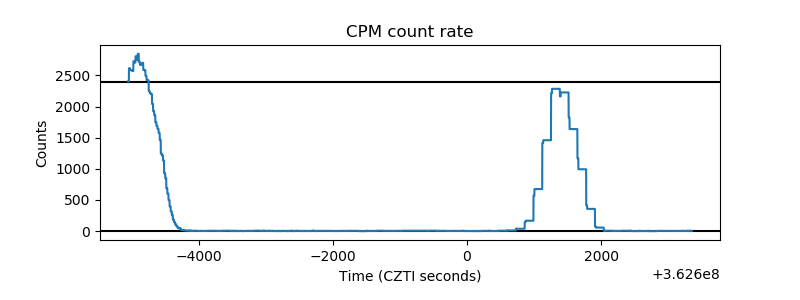 |
| CZT Counter | 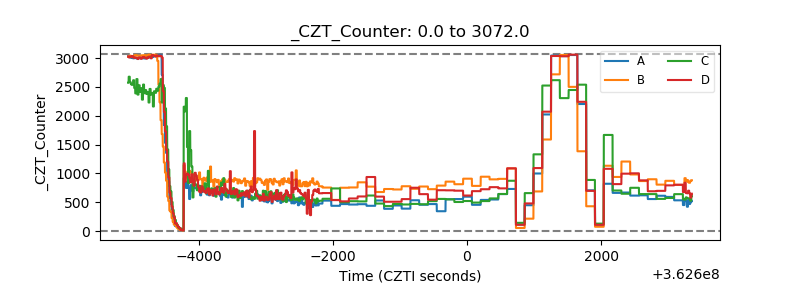 |
| +2.5 Volts monitor |  |
| +5 Volts monitor |  |
| _ROLL_ROT | 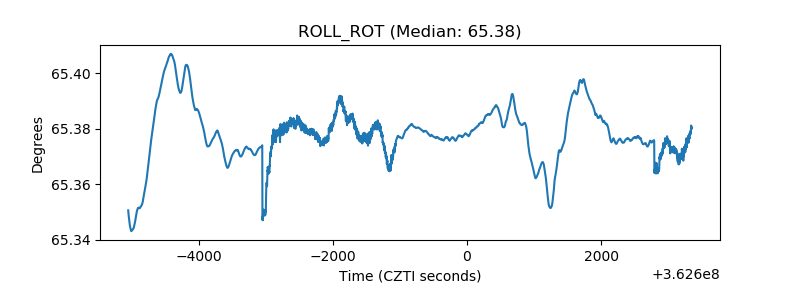 |
| _Roll_DEC | 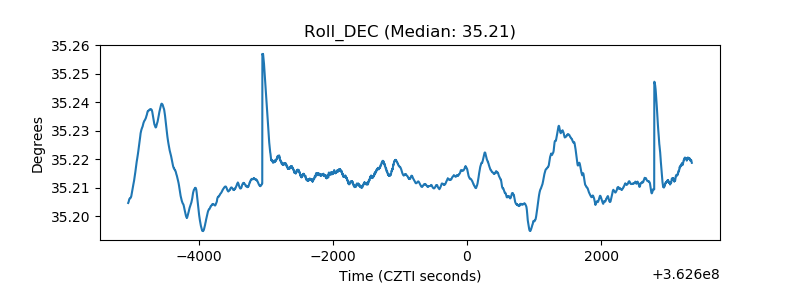 |
| _Roll_RA | 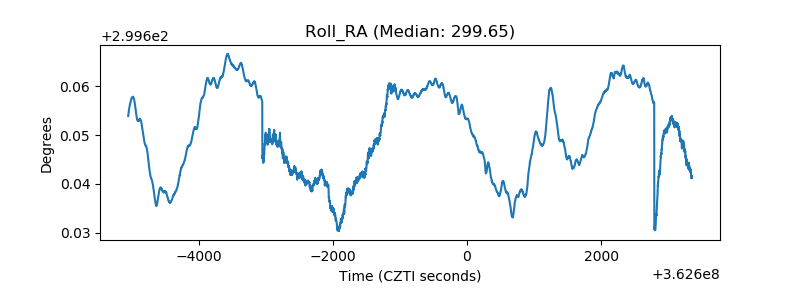 |
| Veto Counter | 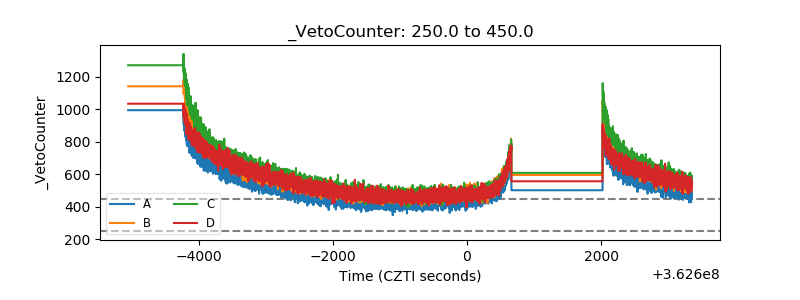 |