| Param | Original file | Final file |
|---|---|---|
| Filename | modeM0/AS1A10_109T01_9000004492_31094cztM0_level2.evt | modeM0/AS1A10_109T01_9000004492_31094cztM0_level2_quad_clean.evt |
| Size (bytes) | 549,336,960 | 118,857,600 |
| Size | 523.9 MB | 113.4 MB |
| Events in quadrant A | 3,257,624 | 806,426 |
| Events in quadrant B | 5,169,996 | 808,031 |
| Events in quadrant C | 3,661,424 | 785,260 |
| Events in quadrant D | 4,125,947 | 765,270 |
| Mode M0 | |||
|---|---|---|---|
| Quadrant | BADHDUFLAG | Total packets | Discarded packets |
| A | 0 | 13529 | 2 |
| B | 0 | 19335 | 2 |
| C | 0 | 14820 | 2 |
| D | 0 | 16816 | 2 |
| Mode SS | |||
|---|---|---|---|
| Quadrant | BADHDUFLAG | Total packets | Discarded packets |
| A | 0 | 126 | 0 |
| B | 0 | 126 | 0 |
| C | 0 | 126 | 0 |
| D | 0 | 126 | 0 |
| Mode M9 | |||
|---|---|---|---|
| Quadrant | BADHDUFLAG | Total packets | Discarded packets |
| A | 0 | 16 | 0 |
| B | 0 | 17 | 0 |
| C | 0 | 17 | 0 |
| D | 0 | 17 | 0 |
| Quadrant | Total seconds | Saturated seconds | Saturation percentage |
|---|---|---|---|
| A | 6234 | 36 | 0.577478% |
| B | 6234 | 172 | 2.759063% |
| C | 6234 | 291 | 4.667950% |
| D | 6234 | 69 | 1.106833% |
Noise dominated data is calculated using 1-second bins in cleaned event files. If a bin has >2000 counts, and if more than 50% of those come from <1% of pixels, then it is considered to be noise-dominated and hence unusable.
| Quadrant | # 1 sec bins | Bins with >0 counts | Bins with >2000 counts | High rate bins dominated by noise | Noise dominated (total time) | Noise dominated (detector-on time) | Marked lightcurve |
|---|---|---|---|---|---|---|---|
| A | 7494 | 6235 | 0 | 0 | 0.00% | 0.00% | 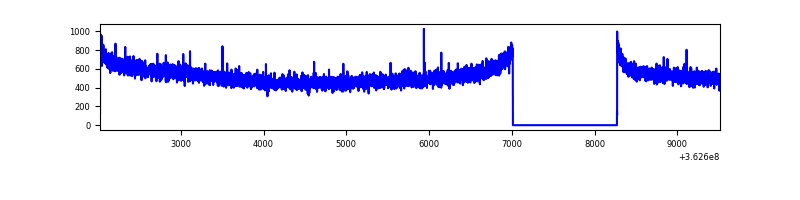 |
| B | 7494 | 6235 | 3 | 3 | 0.04% | 0.05% | 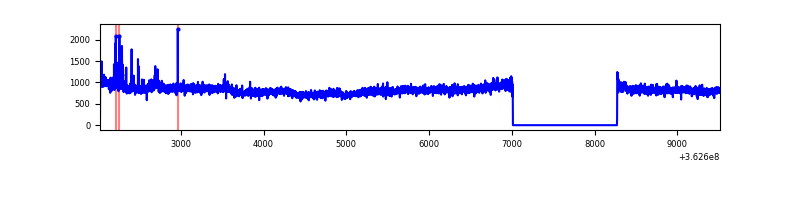 |
| C | 7494 | 6235 | 46 | 46 | 0.61% | 0.74% | 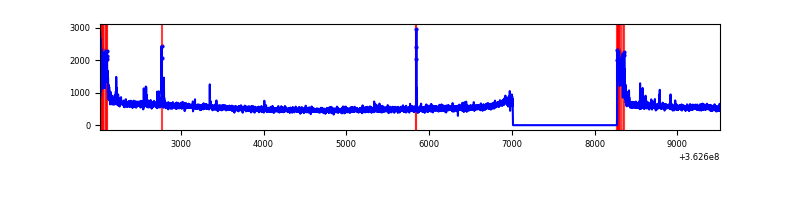 |
| D | 7494 | 6235 | 9 | 9 | 0.12% | 0.14% | 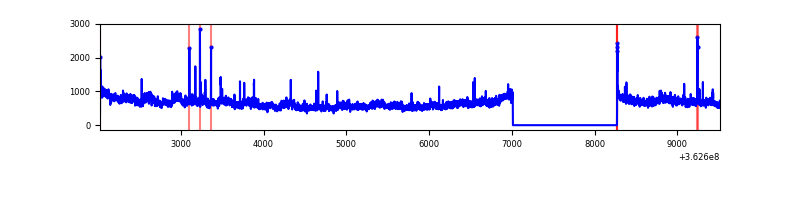 |
Top three noisy pixels from each quadrant. If the there are fewer than three noisy pixels in the level2.evt file, extra rows are filled as -1
| Pixel properties | Quadrant properties | ||||||
|---|---|---|---|---|---|---|---|
| Quadrant | DetID | PixID | Counts | Sigma | Mean | Median | Sigma |
| A | 13 | 254 | 12861 | 71.66 | 844 | 830 | 167.9 |
| A | 3 | 137 | 8040 | 42.95 | 844 | 830 | 167.9 |
| A | 0 | 226 | 6969 | 36.57 | 844 | 830 | 167.9 |
| B | 6 | 159 | 1775265 | 11246.5 | 837 | 816 | 157.8 |
| B | 0 | 229 | 45428 | 282.75 | 837 | 816 | 157.8 |
| B | 0 | 230 | 28153 | 173.26 | 837 | 816 | 157.8 |
| C | 0 | 10 | 236647 | 1235.08 | 821 | 831 | 190.9 |
| C | 14 | 238 | 133949 | 697.2 | 821 | 831 | 190.9 |
| C | 10 | 22 | 70350 | 364.1 | 821 | 831 | 190.9 |
| D | 13 | 174 | 525064 | 2691.11 | 829 | 809 | 194.8 |
| D | 8 | 195 | 427415 | 2189.85 | 829 | 809 | 194.8 |
| D | 2 | 234 | 23248 | 115.18 | 829 | 809 | 194.8 |
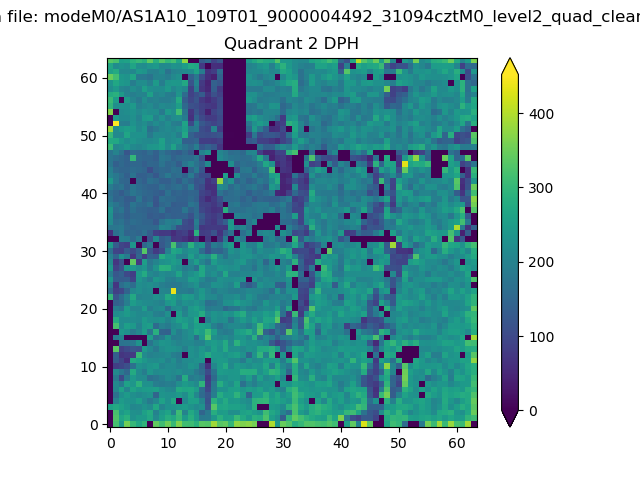
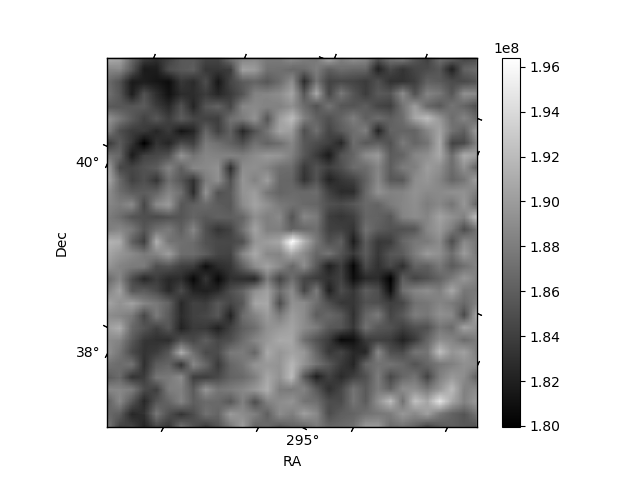
Histogram calculated using DETX and DETY for each event in the final _common_clean file
| Quadrant A | 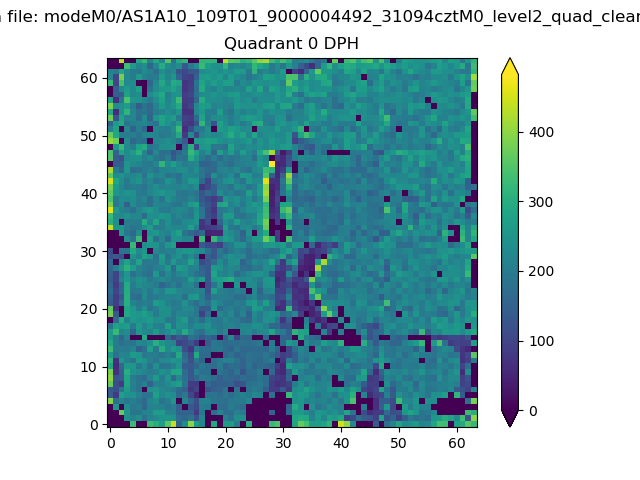 |
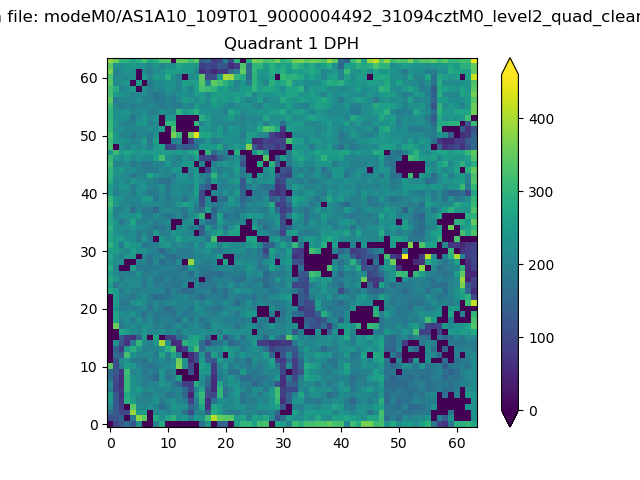 |
Quadrant B |
|---|---|---|---|
| Quadrant D | 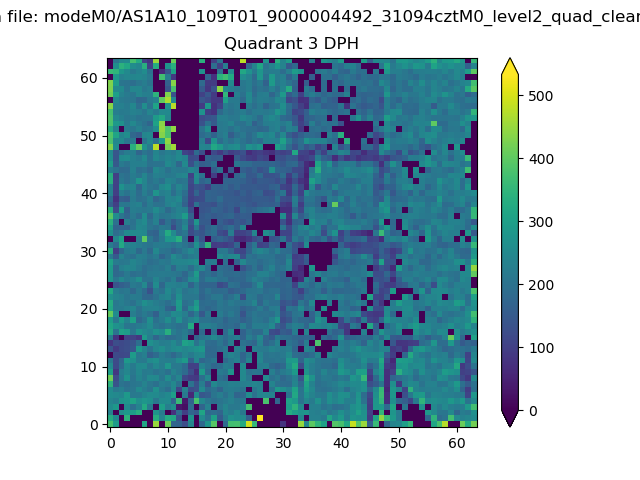 |
 |
Quadrant C |
| Plot type | Count rate plots | Images |
|---|---|---|
| Comparison with Poisson distribution Blue bars denote a histogram of data divided into 1 sec bins. Red curve is a Poisson curve with rate = median count rate of data. |
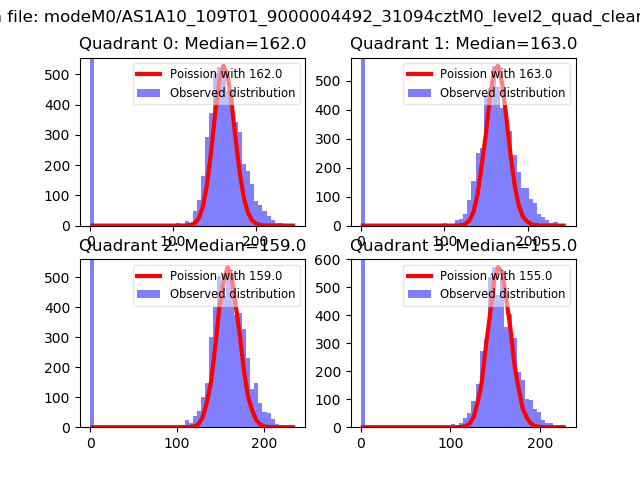 |
 |
| Quadrant-wise count rates Data is divided into 100 sec bins |
 |
|
| Module-wise count rates for Quadrant A Data is divided into 100 sec bins |
 |
 |
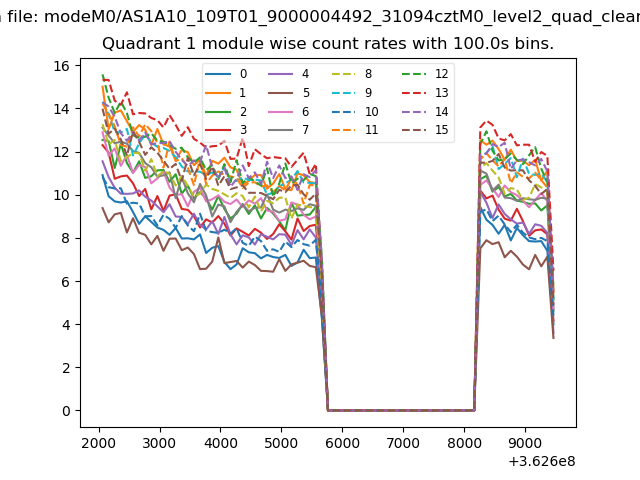
| Module-wise count rates for Quadrant B Data is divided into 100 sec bins |
 |
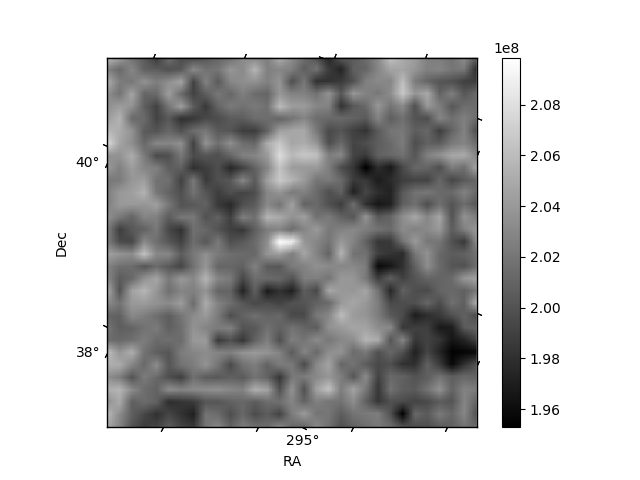 |
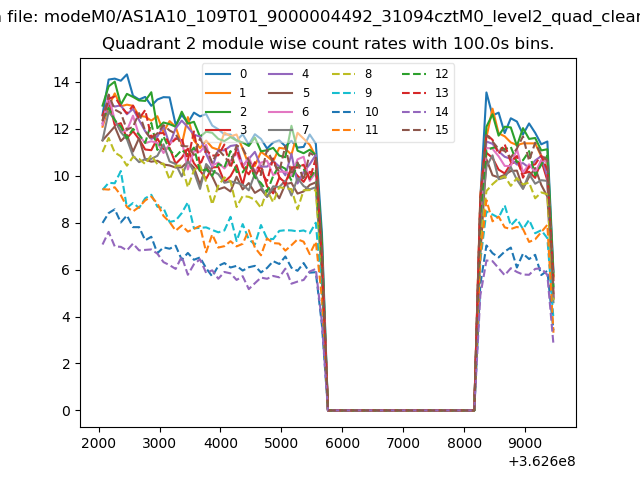
| Module-wise count rates for Quadrant C Data is divided into 100 sec bins |
 |
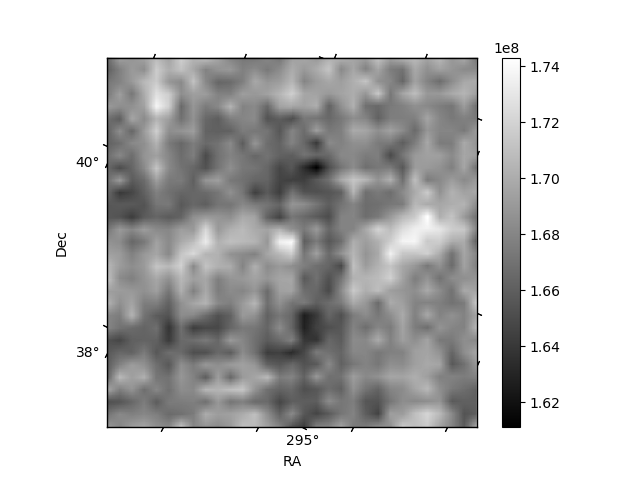 |
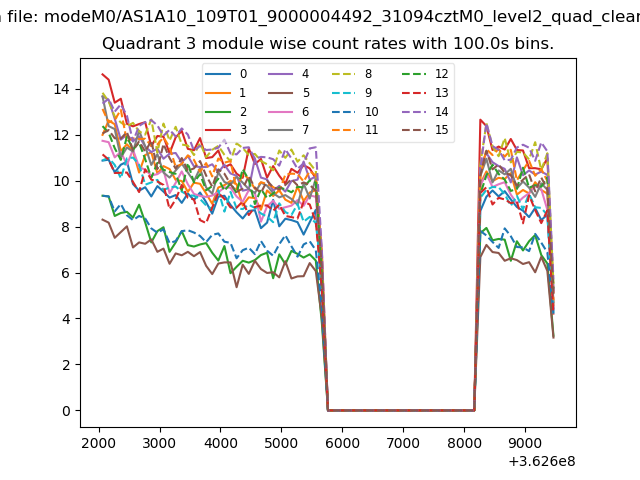
| Module-wise count rates for Quadrant D Data is divided into 100 sec bins |
 |
 |
| Parameter | Plot |
|---|---|
| CZT HV Monitor | 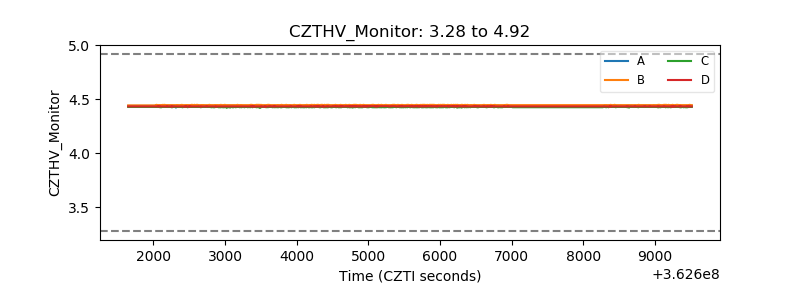 |
| D_VDD | 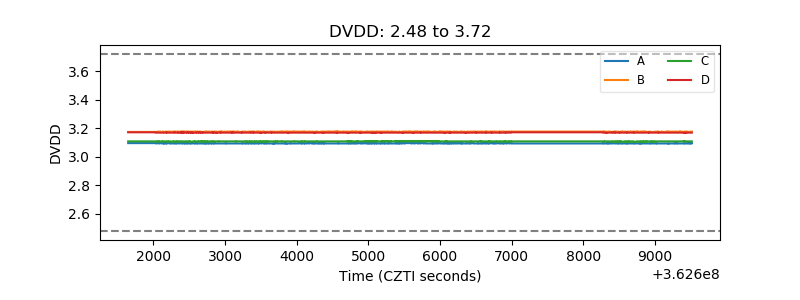 |
| Temperature 1 | 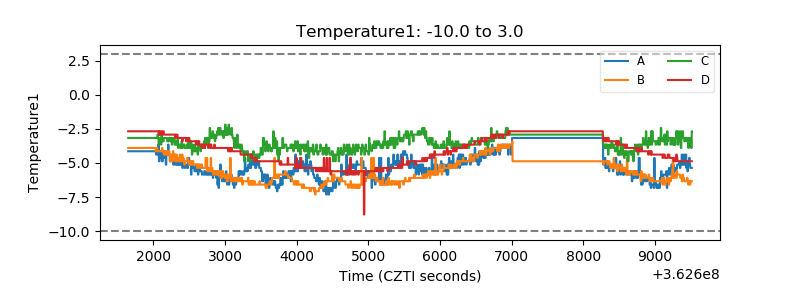 |
| Veto HV Monitor | 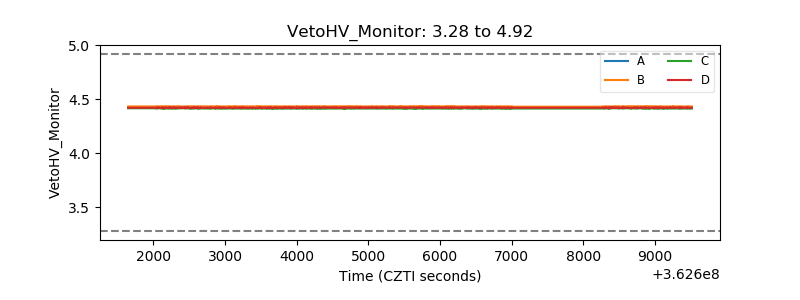 |
| Veto LLD | 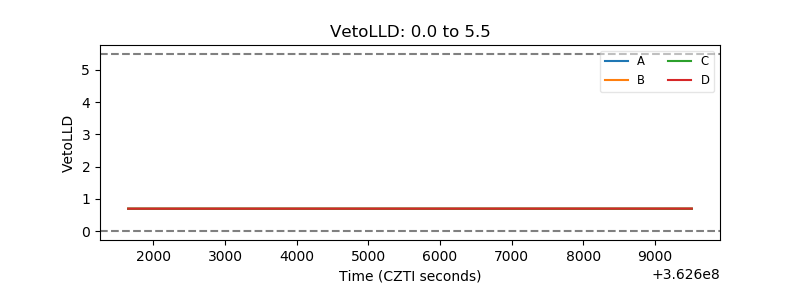 |
| Alpha Counter | 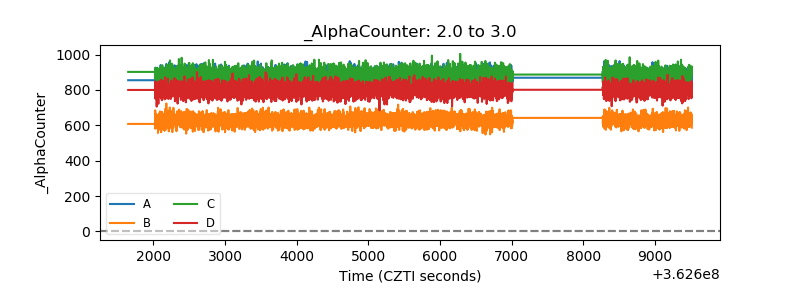 |
| _CPM_Rate | 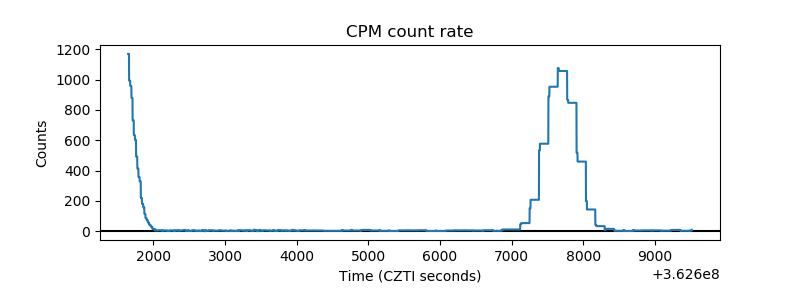 |
| CZT Counter | 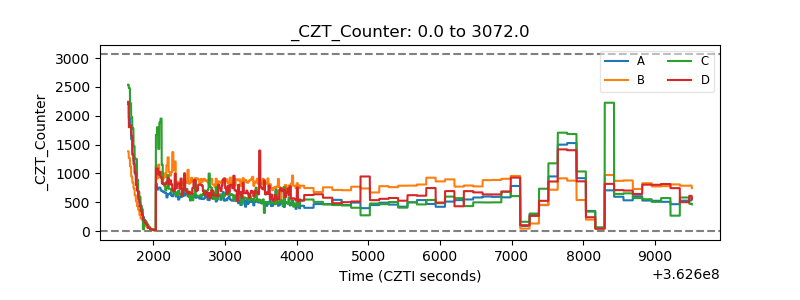 |
| +2.5 Volts monitor |  |
| +5 Volts monitor |  |
| _ROLL_ROT | 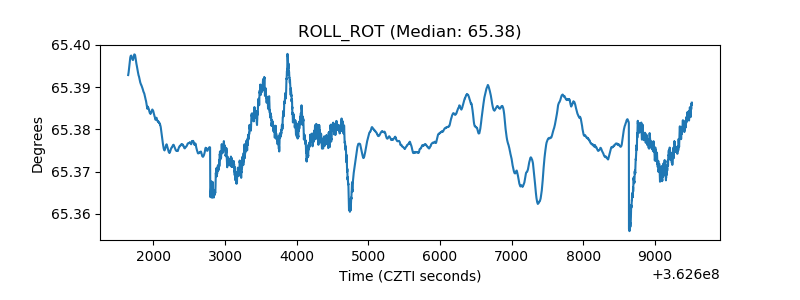 |
| _Roll_DEC | 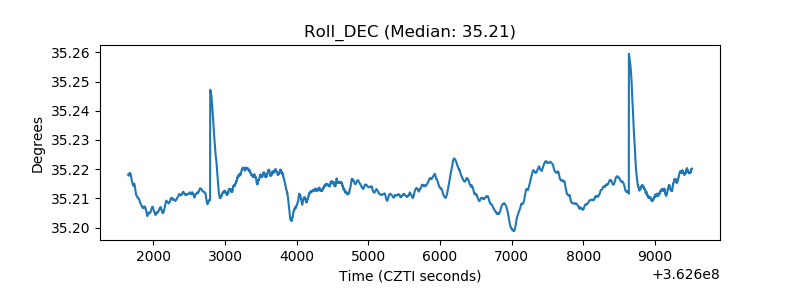 |
| _Roll_RA | 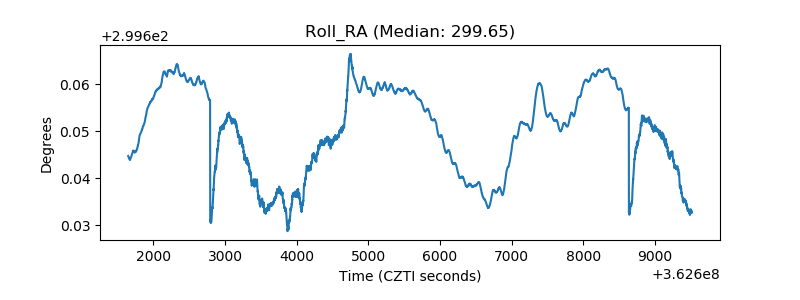 |
| Veto Counter | 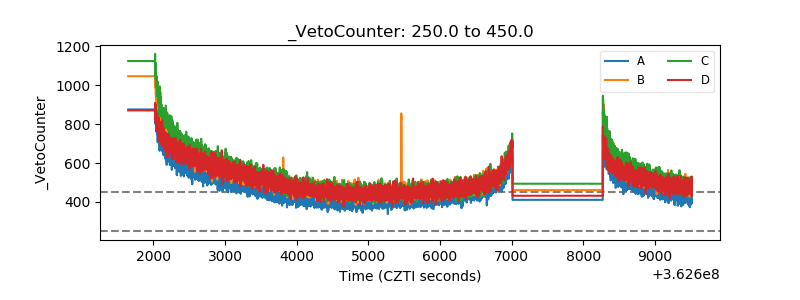 |