| Param | Original file | Final file |
|---|---|---|
| Filename | modeM0/AS1A10_109T01_9000004492_31096cztM0_level2.evt | modeM0/AS1A10_109T01_9000004492_31096cztM0_level2_quad_clean.evt |
| Size (bytes) | 585,354,240 | 110,430,720 |
| Size | 558.2 MB | 105.3 MB |
| Events in quadrant A | 3,525,863 | 728,040 |
| Events in quadrant B | 5,552,086 | 723,971 |
| Events in quadrant C | 3,885,132 | 700,466 |
| Events in quadrant D | 4,278,252 | 691,945 |
| Mode M0 | |||
|---|---|---|---|
| Quadrant | BADHDUFLAG | Total packets | Discarded packets |
| A | 0 | 15114 | 2 |
| B | 0 | 21818 | 4 |
| C | 0 | 16067 | 2 |
| D | 0 | 17395 | 2 |
| Mode SS | |||
|---|---|---|---|
| Quadrant | BADHDUFLAG | Total packets | Discarded packets |
| A | 0 | 144 | 0 |
| B | 0 | 144 | 0 |
| C | 0 | 144 | 0 |
| D | 0 | 144 | 0 |
| Mode M9 | |||
|---|---|---|---|
| Quadrant | BADHDUFLAG | Total packets | Discarded packets |
| A | 0 | 7 | 0 |
| B | 0 | 8 | 0 |
| C | 0 | 8 | 0 |
| D | 0 | 8 | 0 |
| Quadrant | Total seconds | Saturated seconds | Saturation percentage |
|---|---|---|---|
| A | 7187 | 85 | 1.182691% |
| B | 7186 | 174 | 2.421375% |
| C | 7186 | 243 | 3.381575% |
| D | 7186 | 72 | 1.001948% |
Noise dominated data is calculated using 1-second bins in cleaned event files. If a bin has >2000 counts, and if more than 50% of those come from <1% of pixels, then it is considered to be noise-dominated and hence unusable.
| Quadrant | # 1 sec bins | Bins with >0 counts | Bins with >2000 counts | High rate bins dominated by noise | Noise dominated (total time) | Noise dominated (detector-on time) | Marked lightcurve |
|---|---|---|---|---|---|---|---|
| A | 7677 | 7189 | 0 | 0 | 0.00% | 0.00% | 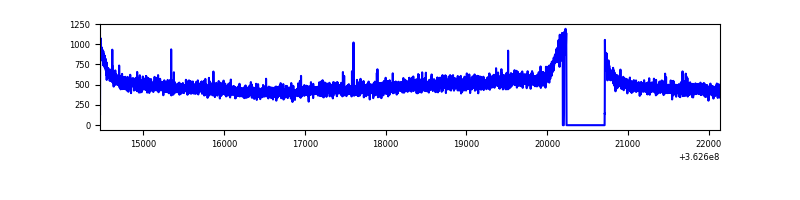 |
| B | 7676 | 7188 | 0 | 0 | 0.00% | 0.00% | 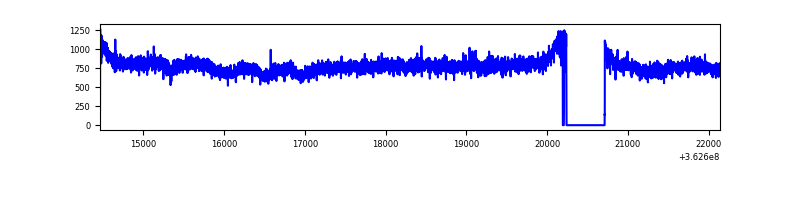 |
| C | 7676 | 7188 | 10 | 10 | 0.13% | 0.14% | 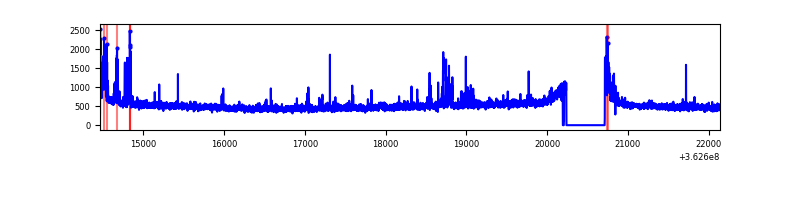 |
| D | 7676 | 7188 | 4 | 4 | 0.05% | 0.06% | 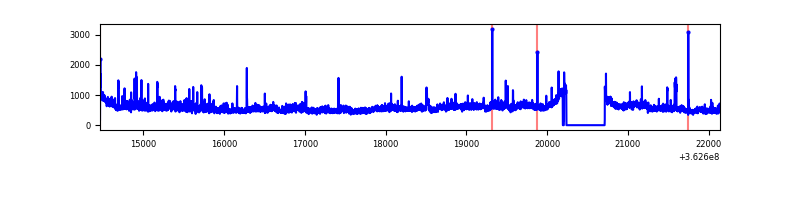 |
Top three noisy pixels from each quadrant. If the there are fewer than three noisy pixels in the level2.evt file, extra rows are filled as -1
| Pixel properties | Quadrant properties | ||||||
|---|---|---|---|---|---|---|---|
| Quadrant | DetID | PixID | Counts | Sigma | Mean | Median | Sigma |
| A | 13 | 254 | 13872 | 70.33 | 913 | 897 | 184.5 |
| A | 3 | 137 | 9443 | 46.32 | 913 | 897 | 184.5 |
| A | 0 | 226 | 7600 | 36.33 | 913 | 897 | 184.5 |
| B | 6 | 159 | 1987690 | 11387.27 | 898 | 877 | 174.5 |
| B | 12 | 111 | 21686 | 119.27 | 898 | 877 | 174.5 |
| B | 11 | 111 | 19846 | 108.72 | 898 | 877 | 174.5 |
| C | 0 | 10 | 177333 | 848.34 | 878 | 885 | 208.0 |
| C | 14 | 238 | 140992 | 673.62 | 878 | 885 | 208.0 |
| C | 10 | 22 | 110486 | 526.95 | 878 | 885 | 208.0 |
| D | 8 | 195 | 479379 | 2240.14 | 887 | 865 | 213.6 |
| D | 13 | 174 | 395377 | 1846.89 | 887 | 865 | 213.6 |
| D | 2 | 250 | 34056 | 155.38 | 887 | 865 | 213.6 |
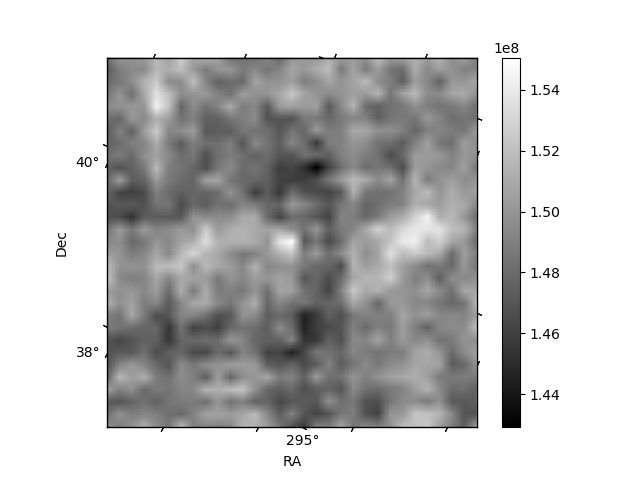
Histogram calculated using DETX and DETY for each event in the final _common_clean file
| Quadrant A |  |
 |
Quadrant B |
|---|---|---|---|
| Quadrant D | 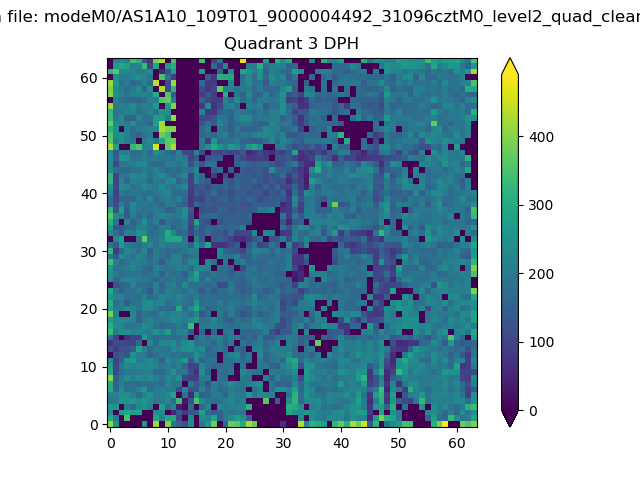 |
 |
Quadrant C |
| Plot type | Count rate plots | Images |
|---|---|---|
| Comparison with Poisson distribution Blue bars denote a histogram of data divided into 1 sec bins. Red curve is a Poisson curve with rate = median count rate of data. |
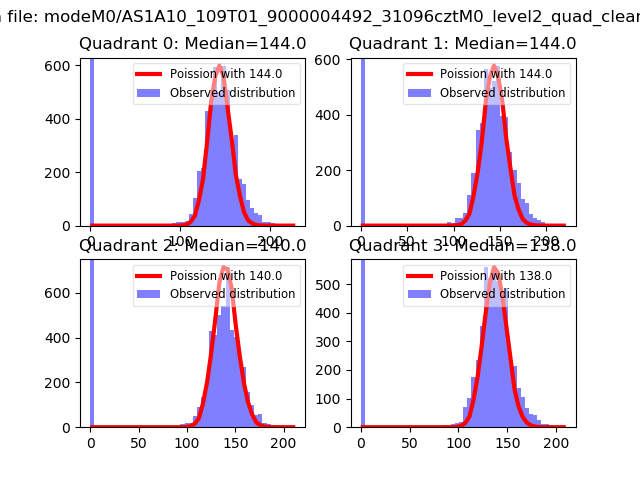 |
 |
| Quadrant-wise count rates Data is divided into 100 sec bins |
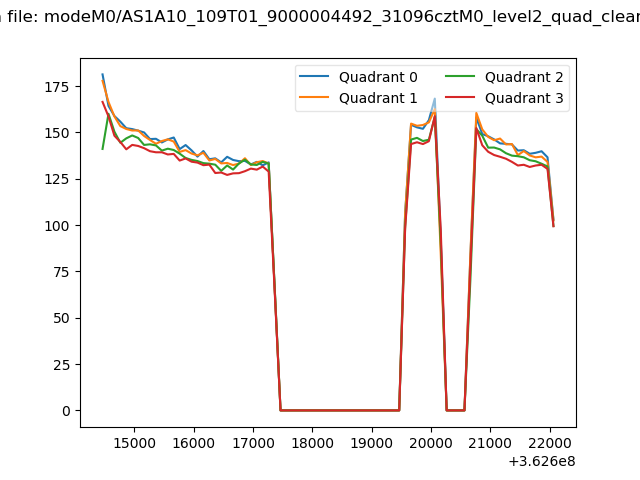 |
|
| Module-wise count rates for Quadrant A Data is divided into 100 sec bins |
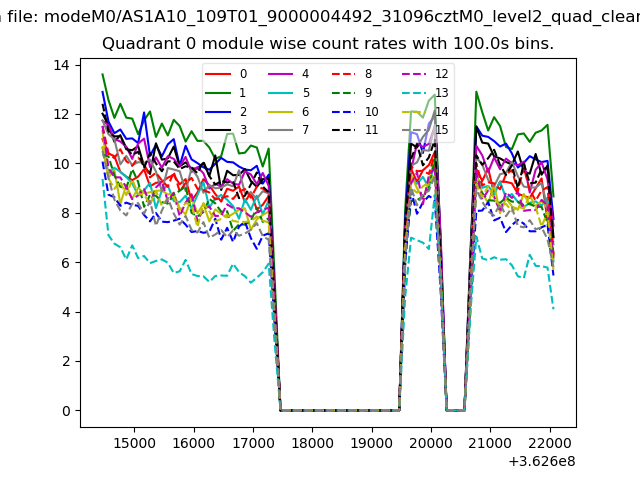 |
 |
| Module-wise count rates for Quadrant B Data is divided into 100 sec bins |
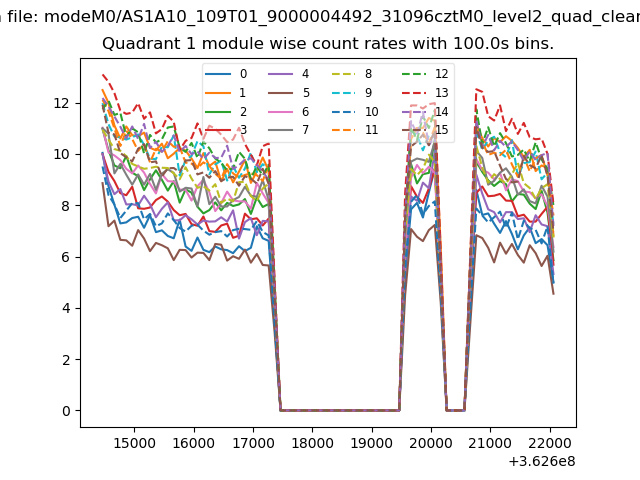 |
 |
| Module-wise count rates for Quadrant C Data is divided into 100 sec bins |
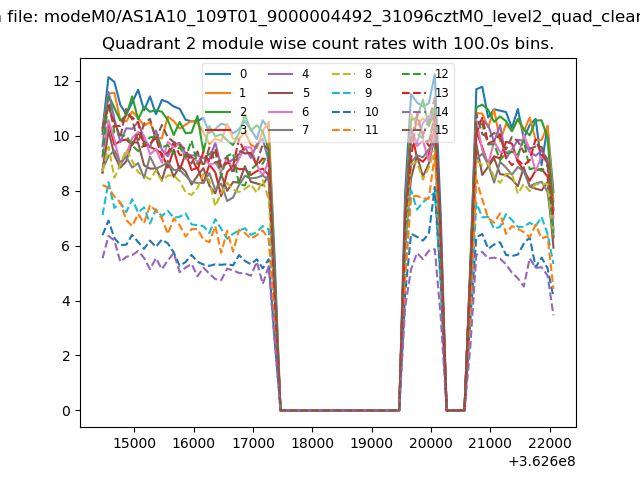 |
 |
| Module-wise count rates for Quadrant D Data is divided into 100 sec bins |
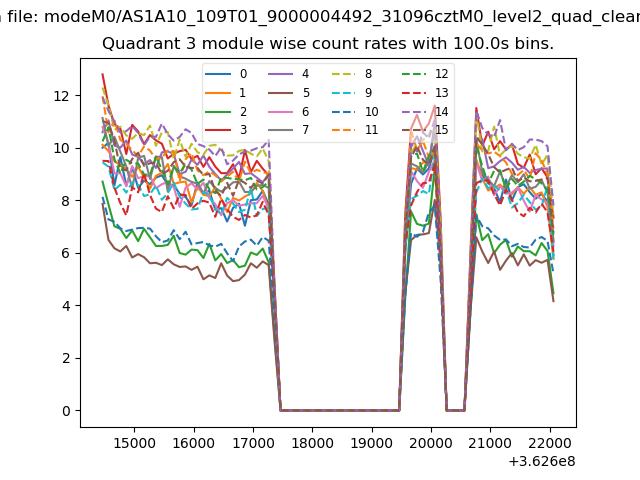 |
 |
| Parameter | Plot |
|---|---|
| CZT HV Monitor | 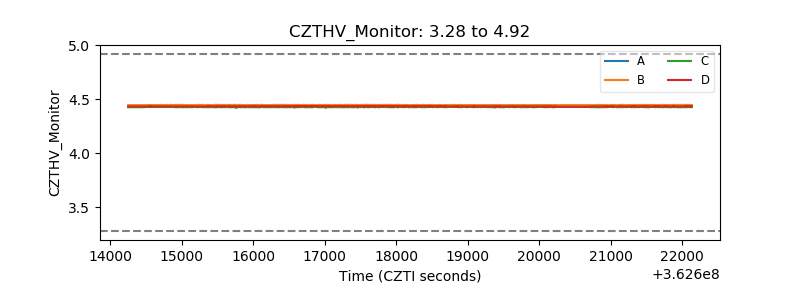 |
| D_VDD | 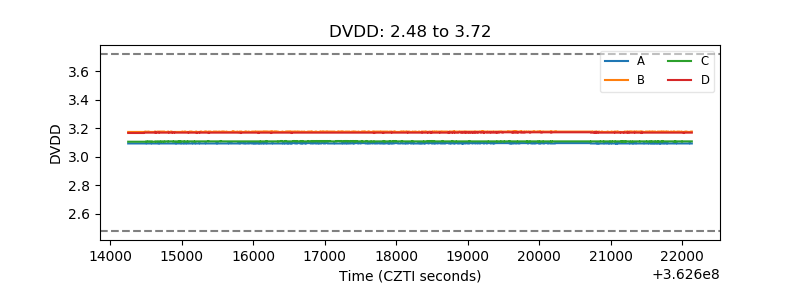 |
| Temperature 1 | 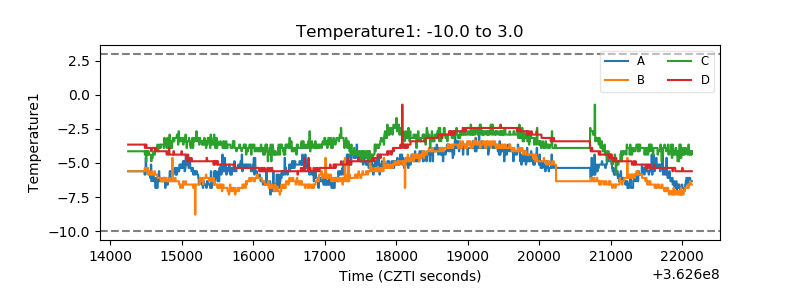 |
| Veto HV Monitor | 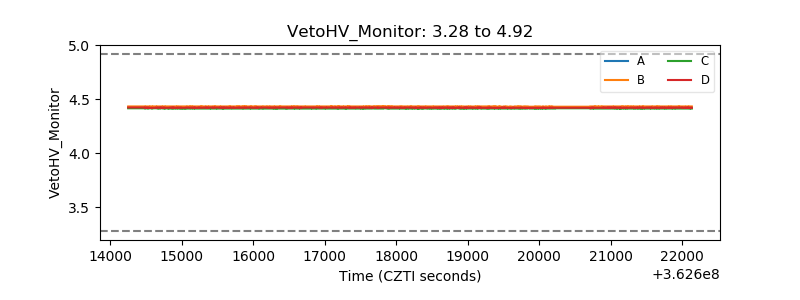 |
| Veto LLD | 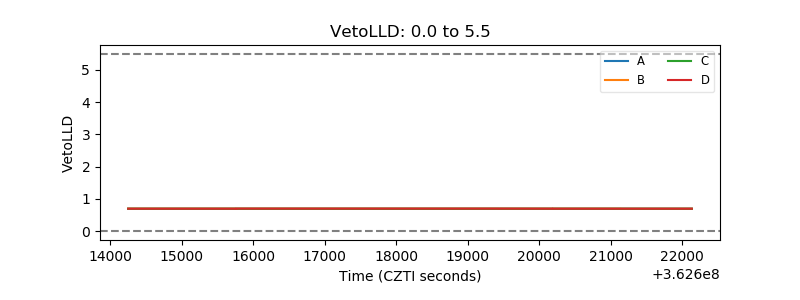 |
| Alpha Counter | 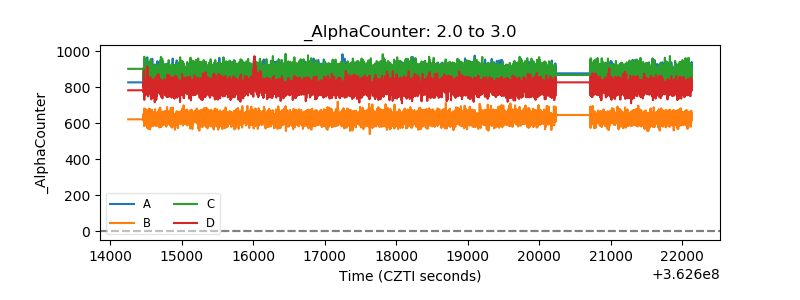 |
| _CPM_Rate | 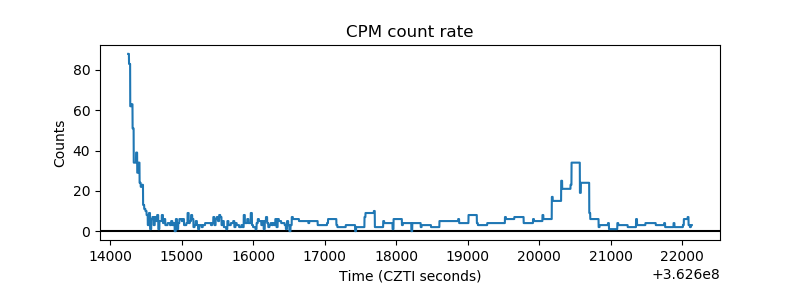 |
| CZT Counter |  |
| +2.5 Volts monitor |  |
| +5 Volts monitor |  |
| _ROLL_ROT | 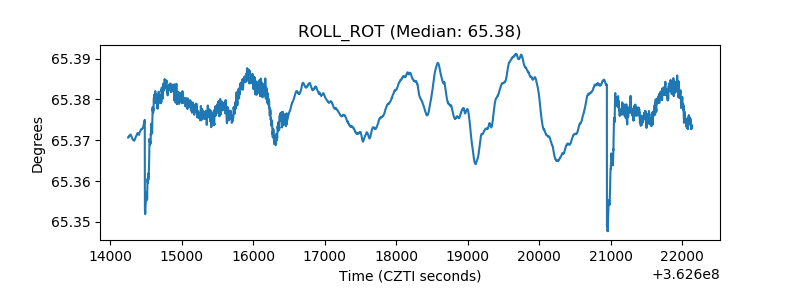 |
| _Roll_DEC | 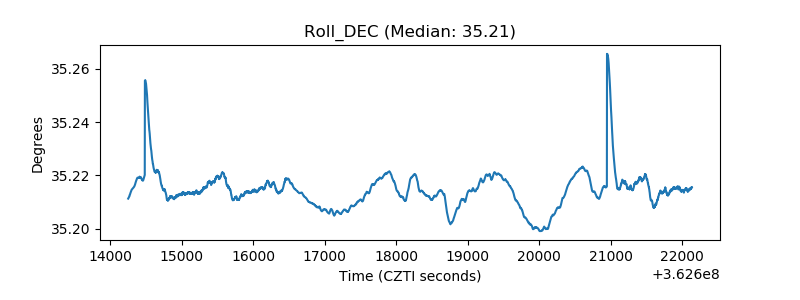 |
| _Roll_RA |  |
| Veto Counter | 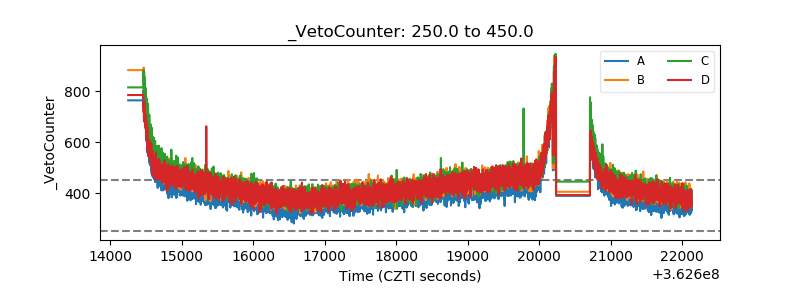 |