| Param | Original file | Final file |
|---|---|---|
| Filename | modeM0/AS1A10_109T01_9000004492_31097cztM0_level2.evt | modeM0/AS1A10_109T01_9000004492_31097cztM0_level2_quad_clean.evt |
| Size (bytes) | 627,410,880 | 118,448,640 |
| Size | 598.3 MB | 113.0 MB |
| Events in quadrant A | 3,736,828 | 781,600 |
| Events in quadrant B | 5,914,901 | 775,847 |
| Events in quadrant C | 3,975,309 | 755,008 |
| Events in quadrant D | 4,853,702 | 740,094 |
| Mode M0 | |||
|---|---|---|---|
| Quadrant | BADHDUFLAG | Total packets | Discarded packets |
| A | 0 | 16118 | 3 |
| B | 0 | 23502 | 5 |
| C | 0 | 16745 | 3 |
| D | 0 | 19548 | 3 |
| Mode SS | |||
|---|---|---|---|
| Quadrant | BADHDUFLAG | Total packets | Discarded packets |
| A | 0 | 156 | 0 |
| B | 0 | 156 | 0 |
| C | 0 | 156 | 0 |
| D | 0 | 156 | 0 |
| Mode M9 | |||
|---|---|---|---|
| Quadrant | BADHDUFLAG | Total packets | Discarded packets |
| A | 0 | 2 | 0 |
| B | 0 | 3 | 0 |
| C | 0 | 3 | 0 |
| D | 0 | 3 | 0 |
| Quadrant | Total seconds | Saturated seconds | Saturation percentage |
|---|---|---|---|
| A | 7679 | 171 | 2.226852% |
| B | 7678 | 324 | 4.219849% |
| C | 7678 | 274 | 3.568638% |
| D | 7678 | 204 | 2.656942% |
Noise dominated data is calculated using 1-second bins in cleaned event files. If a bin has >2000 counts, and if more than 50% of those come from <1% of pixels, then it is considered to be noise-dominated and hence unusable.
| Quadrant | # 1 sec bins | Bins with >0 counts | Bins with >2000 counts | High rate bins dominated by noise | Noise dominated (total time) | Noise dominated (detector-on time) | Marked lightcurve |
|---|---|---|---|---|---|---|---|
| A | 7744 | 7682 | 0 | 0 | 0.00% | 0.00% | 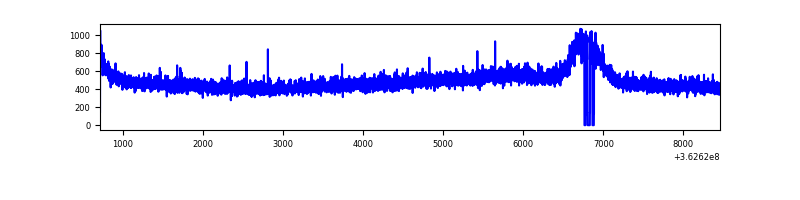 |
| B | 7743 | 7681 | 0 | 0 | 0.00% | 0.00% |  |
| C | 7743 | 7681 | 6 | 6 | 0.08% | 0.08% | 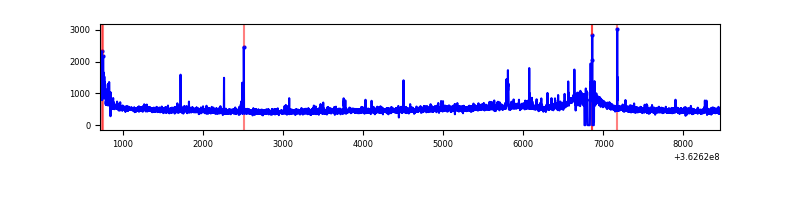 |
| D | 7743 | 7681 | 88 | 88 | 1.14% | 1.15% | 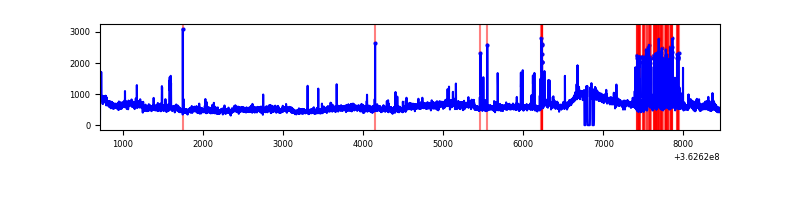 |
Top three noisy pixels from each quadrant. If the there are fewer than three noisy pixels in the level2.evt file, extra rows are filled as -1
| Pixel properties | Quadrant properties | ||||||
|---|---|---|---|---|---|---|---|
| Quadrant | DetID | PixID | Counts | Sigma | Mean | Median | Sigma |
| A | 13 | 254 | 13877 | 66.54 | 967 | 949 | 194.3 |
| A | 3 | 137 | 10260 | 47.93 | 967 | 949 | 194.3 |
| A | 0 | 226 | 8137 | 37.0 | 967 | 949 | 194.3 |
| B | 6 | 159 | 2058042 | 11165.64 | 951 | 925 | 184.2 |
| B | 0 | 183 | 68193 | 365.12 | 951 | 925 | 184.2 |
| B | 0 | 229 | 23805 | 124.19 | 951 | 925 | 184.2 |
| C | 14 | 238 | 149487 | 675.25 | 934 | 942 | 220.0 |
| C | 0 | 10 | 131740 | 594.58 | 934 | 942 | 220.0 |
| C | 10 | 22 | 29193 | 128.42 | 934 | 942 | 220.0 |
| D | 13 | 174 | 688107 | 3080.4 | 939 | 914 | 223.1 |
| D | 8 | 195 | 543159 | 2430.66 | 939 | 914 | 223.1 |
| D | 2 | 250 | 65185 | 288.1 | 939 | 914 | 223.1 |
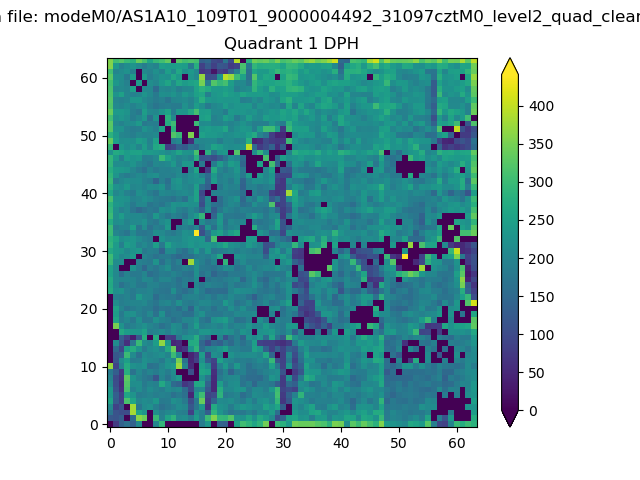
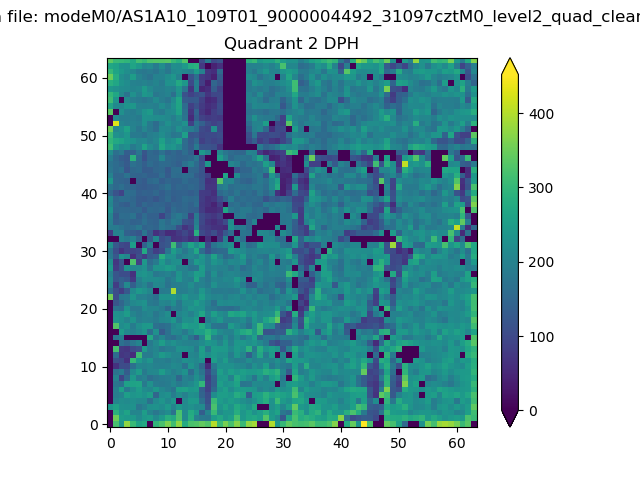
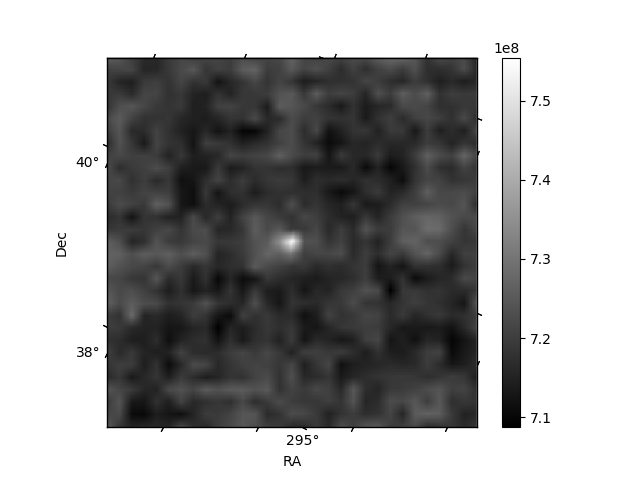
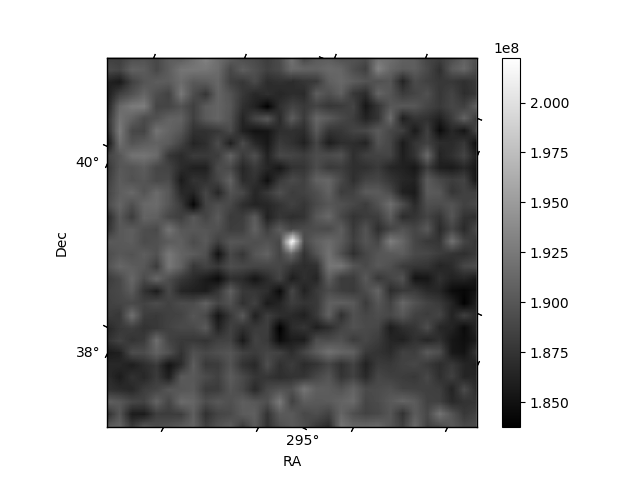
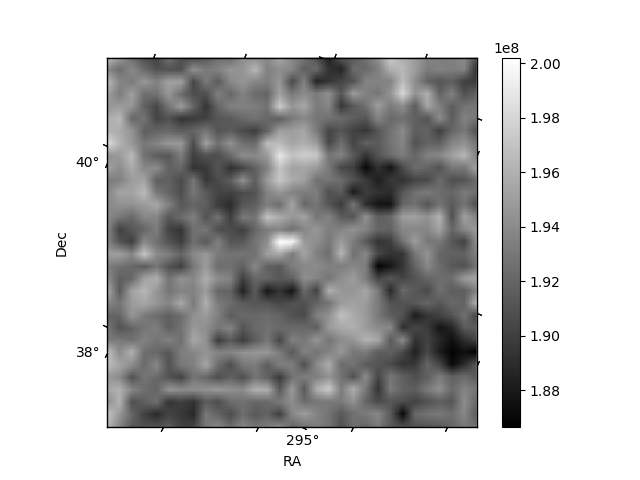
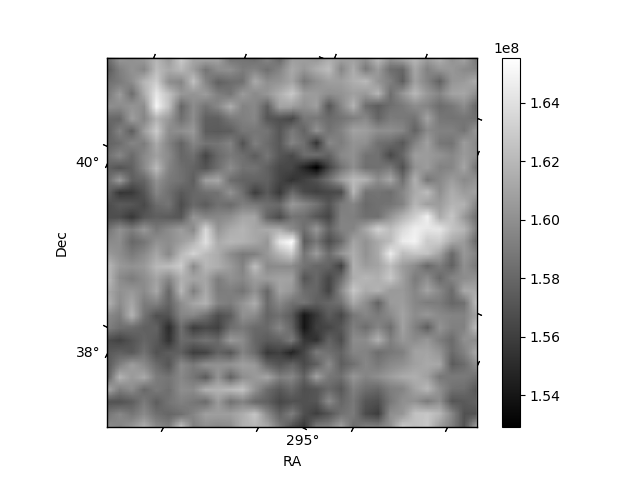
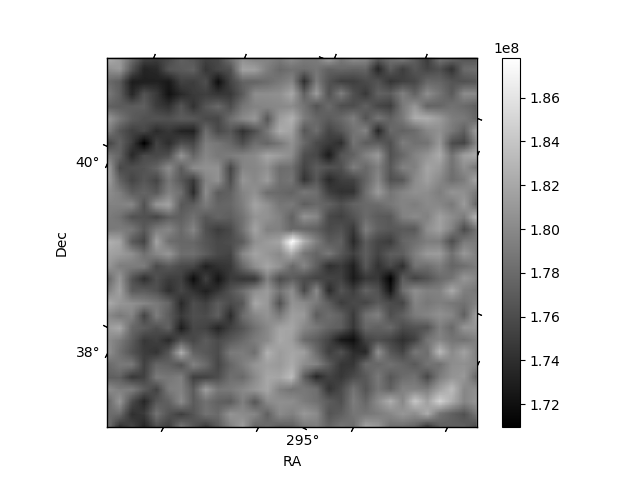
Histogram calculated using DETX and DETY for each event in the final _common_clean file
| Quadrant A | 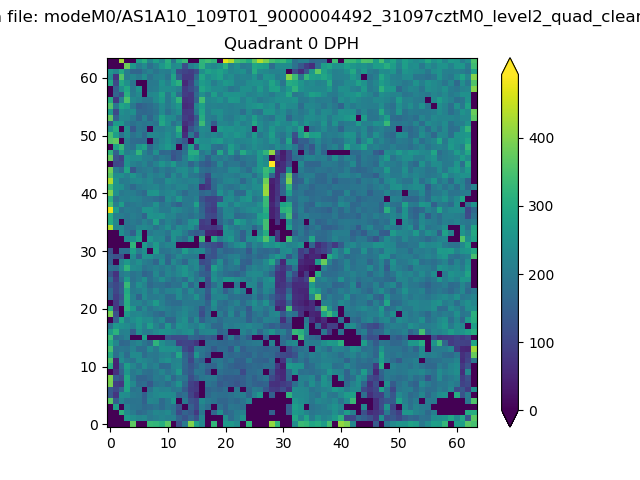 |
 |
Quadrant B |
|---|---|---|---|
| Quadrant D | 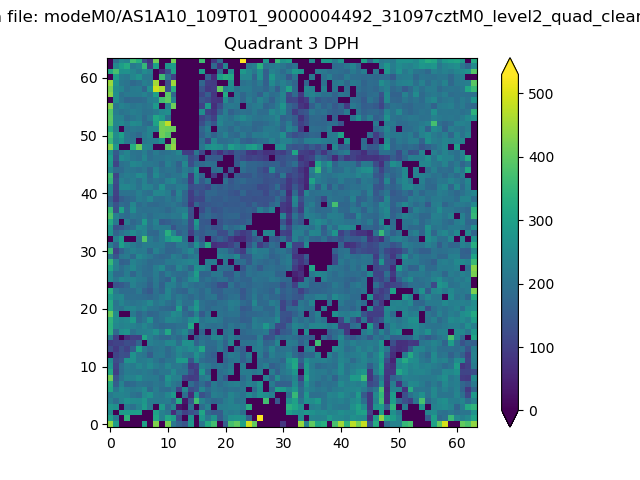 |
 |
Quadrant C |
| Plot type | Count rate plots | Images |
|---|---|---|
| Comparison with Poisson distribution Blue bars denote a histogram of data divided into 1 sec bins. Red curve is a Poisson curve with rate = median count rate of data. |
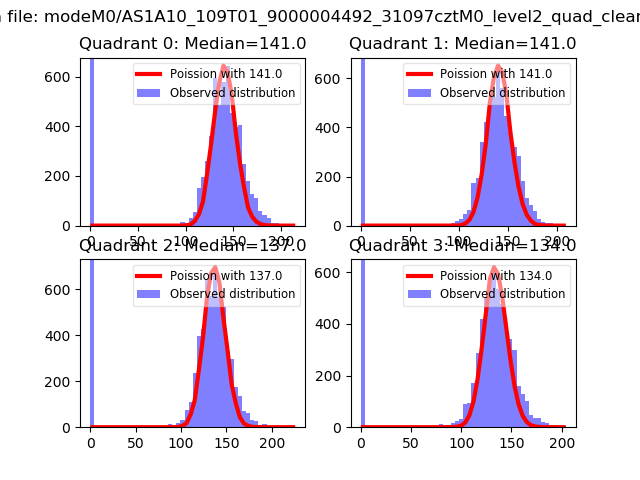 |
 |
| Quadrant-wise count rates Data is divided into 100 sec bins |
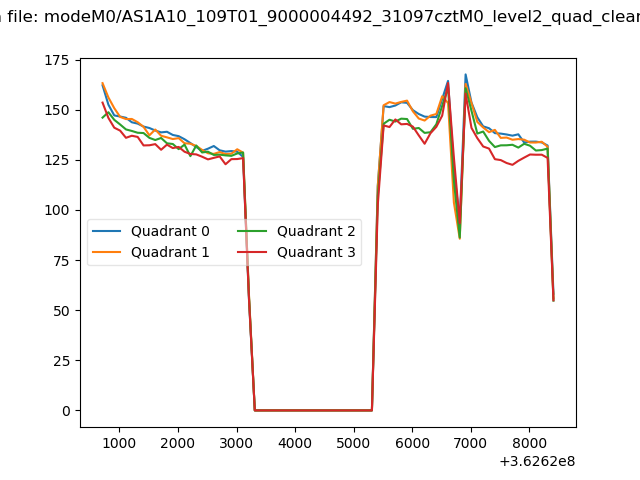 |
|
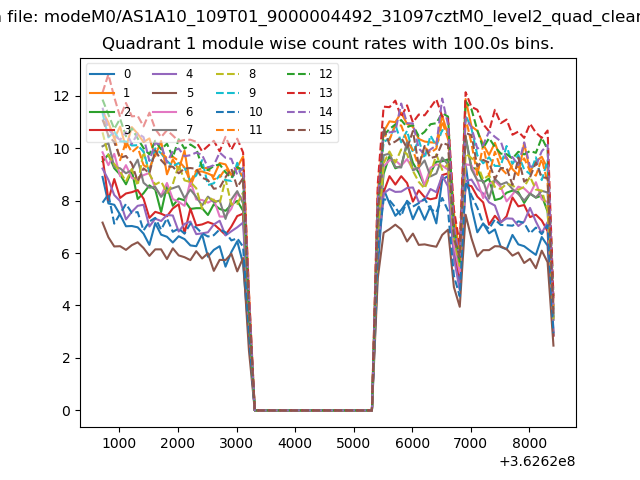
| Module-wise count rates for Quadrant A Data is divided into 100 sec bins |
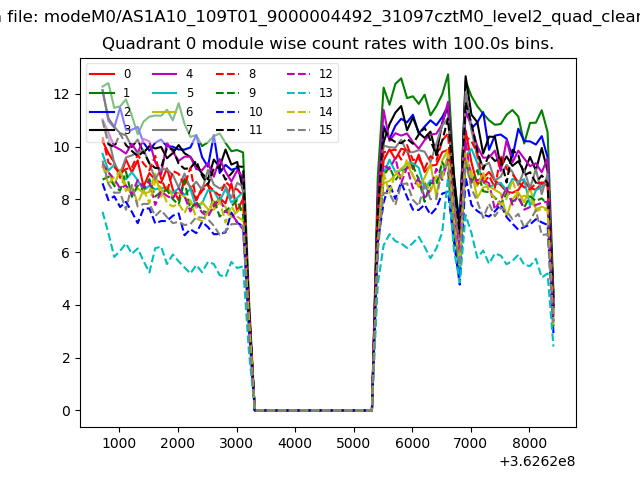 |
 |
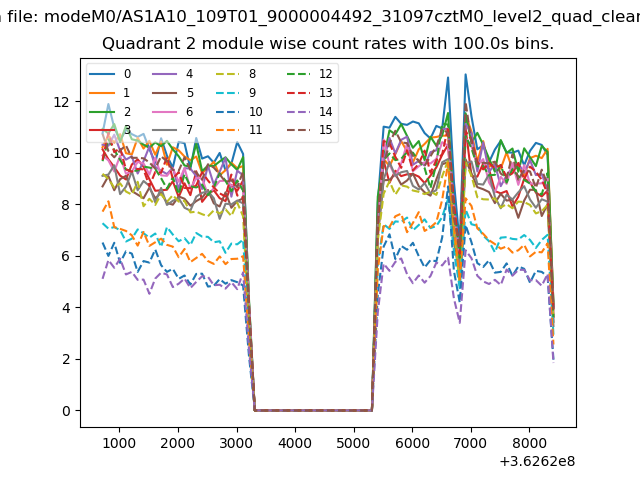
| Module-wise count rates for Quadrant B Data is divided into 100 sec bins |
 |
 |
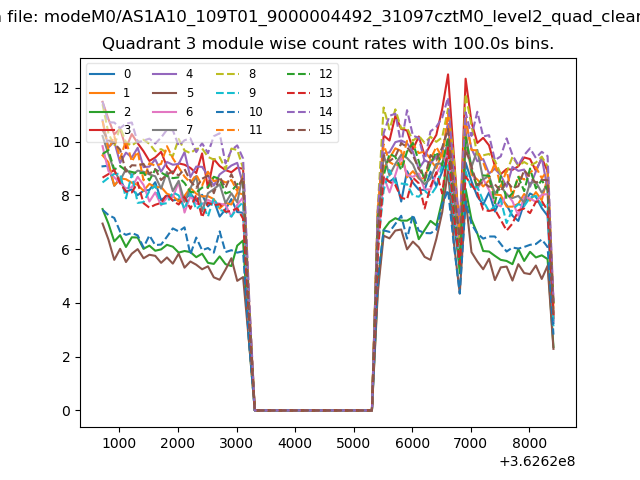
| Module-wise count rates for Quadrant C Data is divided into 100 sec bins |
 |
 |
| Module-wise count rates for Quadrant D Data is divided into 100 sec bins |
 |
 |
| Parameter | Plot |
|---|---|
| CZT HV Monitor |  |
| D_VDD |  |
| Temperature 1 | 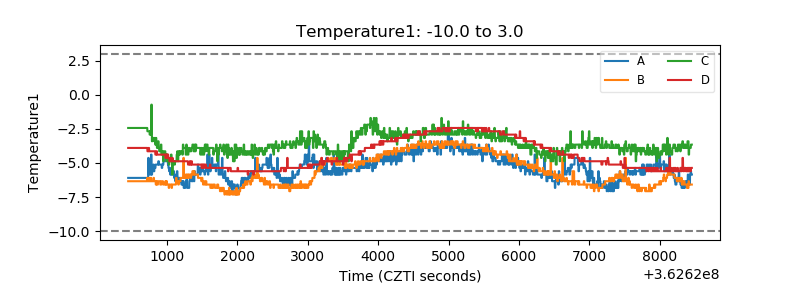 |
| Veto HV Monitor | 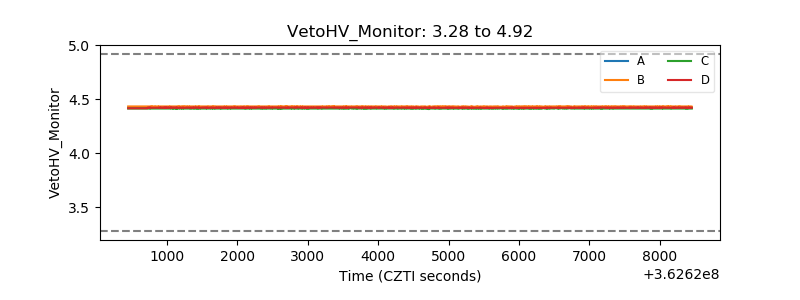 |
| Veto LLD | 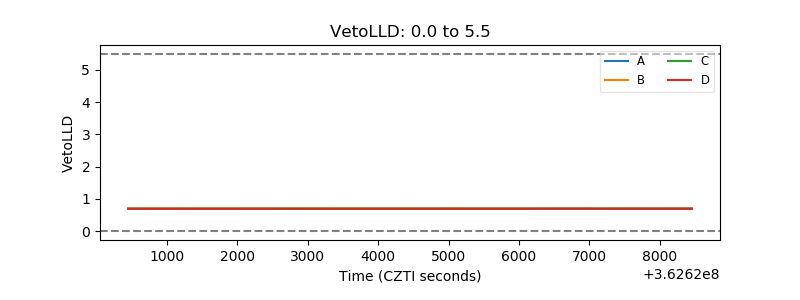 |
| Alpha Counter | 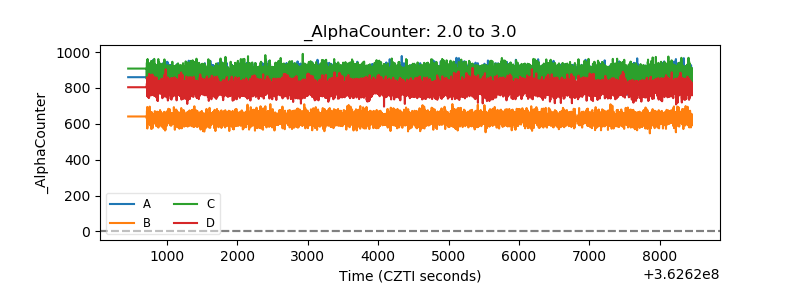 |
| _CPM_Rate | 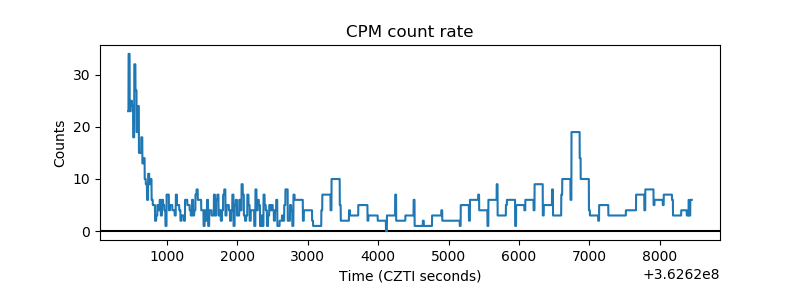 |
| CZT Counter | 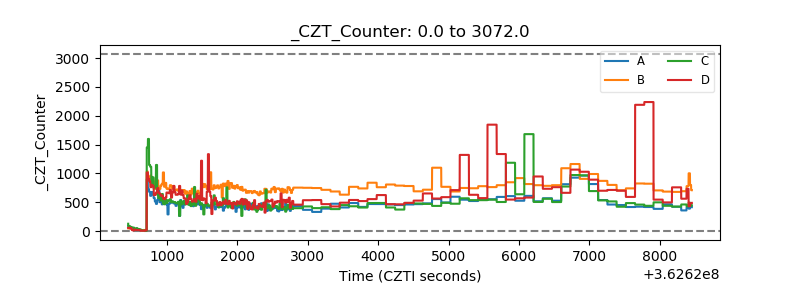 |
| +2.5 Volts monitor |  |
| +5 Volts monitor |  |
| _ROLL_ROT | 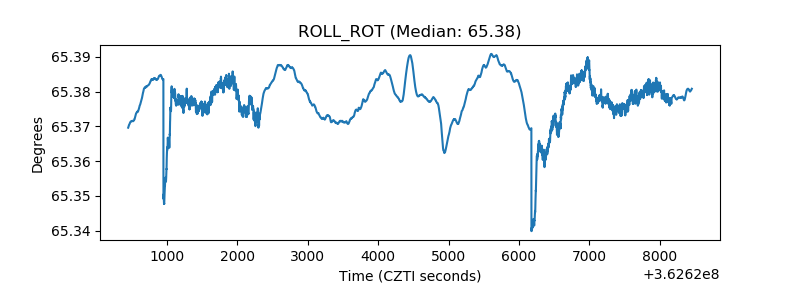 |
| _Roll_DEC | 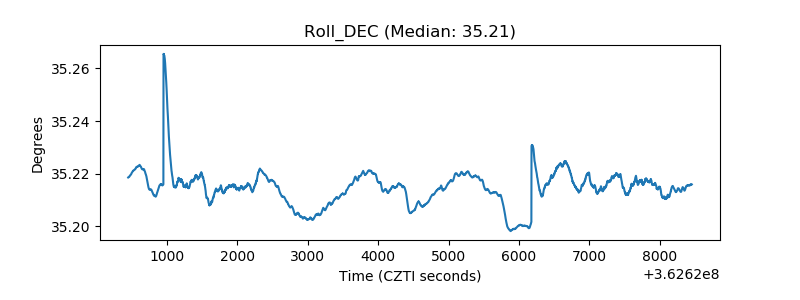 |
| _Roll_RA | 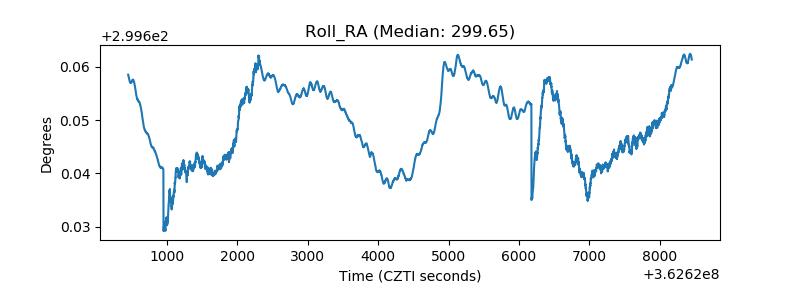 |
| Veto Counter | 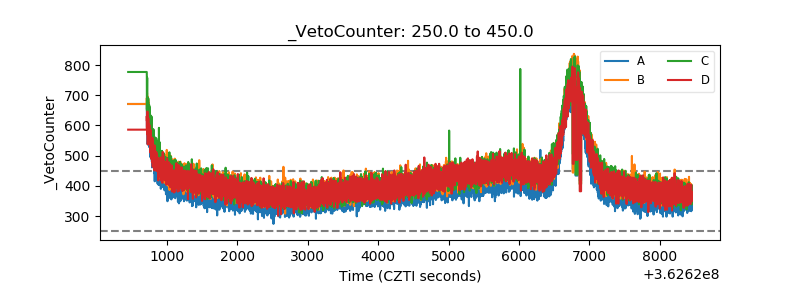 |