| Param | Original file | Final file |
|---|---|---|
| Filename | modeM0/AS1A10_109T01_9000004492_31098cztM0_level2.evt | modeM0/AS1A10_109T01_9000004492_31098cztM0_level2_quad_clean.evt |
| Size (bytes) | 677,554,560 | 122,529,600 |
| Size | 646.2 MB | 116.9 MB |
| Events in quadrant A | 3,867,571 | 811,326 |
| Events in quadrant B | 6,105,489 | 800,536 |
| Events in quadrant C | 4,403,131 | 782,227 |
| Events in quadrant D | 5,607,041 | 765,078 |
| Mode M0 | |||
|---|---|---|---|
| Quadrant | BADHDUFLAG | Total packets | Discarded packets |
| A | 0 | 16679 | 3 |
| B | 0 | 24246 | 3 |
| C | 0 | 18188 | 3 |
| D | 0 | 22197 | 3 |
| Mode SS | |||
|---|---|---|---|
| Quadrant | BADHDUFLAG | Total packets | Discarded packets |
| A | 0 | 162 | 0 |
| B | 0 | 162 | 0 |
| C | 0 | 162 | 0 |
| D | 0 | 162 | 0 |
| Mode M9 | |||
|---|---|---|---|
| Quadrant | BADHDUFLAG | Total packets | Discarded packets |
| A | 0 | 2 | 0 |
| B | 0 | 2 | 0 |
| C | 0 | 2 | 0 |
| D | 0 | 2 | 0 |
| Quadrant | Total seconds | Saturated seconds | Saturation percentage |
|---|---|---|---|
| A | 7927 | 252 | 3.179008% |
| B | 7928 | 461 | 5.814834% |
| C | 7927 | 461 | 5.815567% |
| D | 7927 | 268 | 3.380850% |
Noise dominated data is calculated using 1-second bins in cleaned event files. If a bin has >2000 counts, and if more than 50% of those come from <1% of pixels, then it is considered to be noise-dominated and hence unusable.
| Quadrant | # 1 sec bins | Bins with >0 counts | Bins with >2000 counts | High rate bins dominated by noise | Noise dominated (total time) | Noise dominated (detector-on time) | Marked lightcurve |
|---|---|---|---|---|---|---|---|
| A | 8247 | 7931 | 0 | 0 | 0.00% | 0.00% | 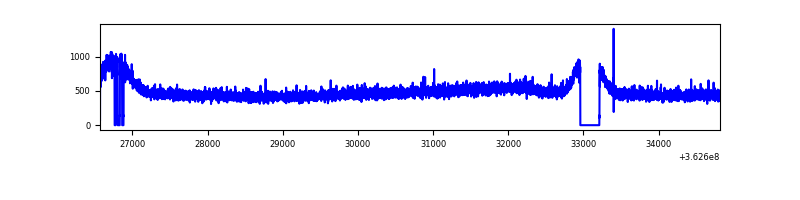 |
| B | 8248 | 7932 | 0 | 0 | 0.00% | 0.00% | 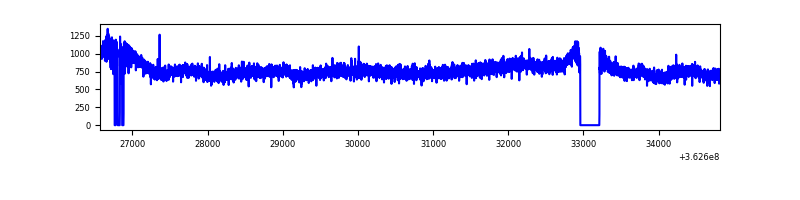 |
| C | 8247 | 7931 | 107 | 107 | 1.30% | 1.35% | 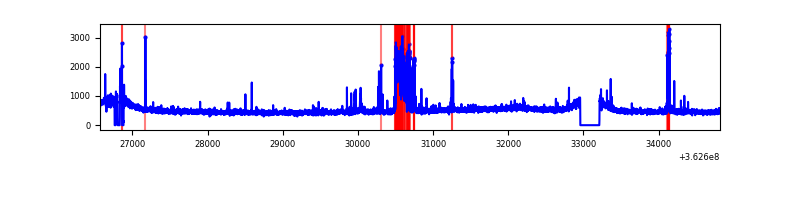 |
| D | 8247 | 7931 | 92 | 92 | 1.12% | 1.16% | 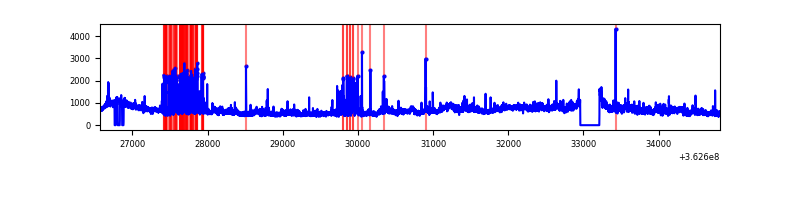 |
Top three noisy pixels from each quadrant. If the there are fewer than three noisy pixels in the level2.evt file, extra rows are filled as -1
| Pixel properties | Quadrant properties | ||||||
|---|---|---|---|---|---|---|---|
| Quadrant | DetID | PixID | Counts | Sigma | Mean | Median | Sigma |
| A | 13 | 254 | 13264 | 60.69 | 1002 | 980 | 202.4 |
| A | 3 | 137 | 10667 | 47.86 | 1002 | 980 | 202.4 |
| A | 0 | 226 | 8338 | 36.35 | 1002 | 980 | 202.4 |
| B | 6 | 159 | 2207691 | 11559.28 | 983 | 959 | 190.9 |
| B | 12 | 111 | 24419 | 122.89 | 983 | 959 | 190.9 |
| B | 11 | 111 | 22213 | 111.33 | 983 | 959 | 190.9 |
| C | 10 | 22 | 346313 | 1525.22 | 957 | 963 | 226.4 |
| C | 14 | 238 | 151685 | 665.66 | 957 | 963 | 226.4 |
| C | 0 | 10 | 146238 | 641.6 | 957 | 963 | 226.4 |
| D | 13 | 174 | 1475225 | 6304.7 | 969 | 945 | 233.8 |
| D | 8 | 195 | 444939 | 1898.72 | 969 | 945 | 233.8 |
| D | 2 | 234 | 34314 | 142.7 | 969 | 945 | 233.8 |
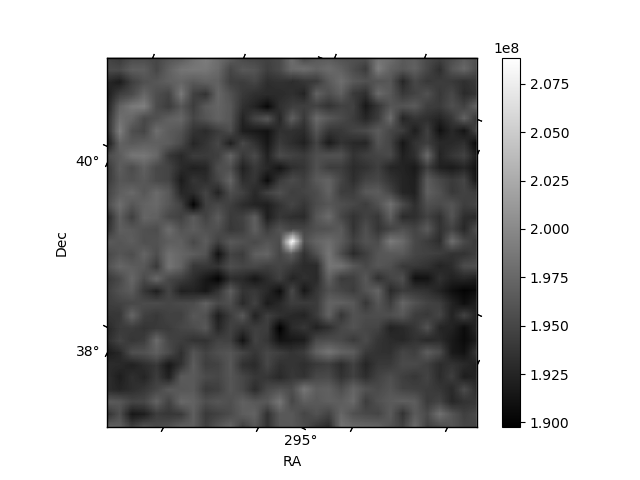
Histogram calculated using DETX and DETY for each event in the final _common_clean file
| Quadrant A | 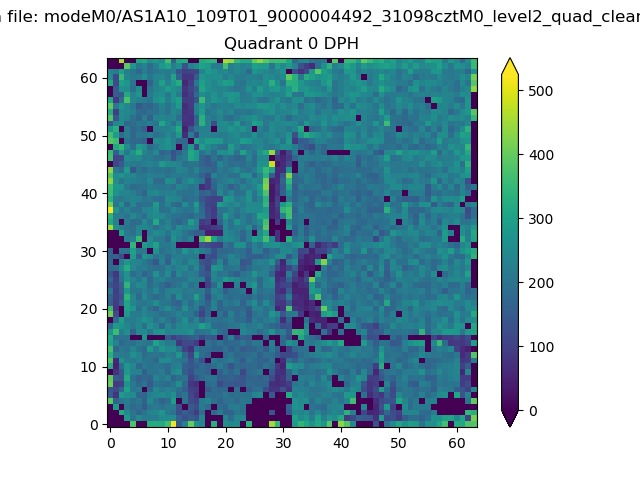 |
 |
Quadrant B |
|---|---|---|---|
| Quadrant D |  |
 |
Quadrant C |
| Plot type | Count rate plots | Images |
|---|---|---|
| Comparison with Poisson distribution Blue bars denote a histogram of data divided into 1 sec bins. Red curve is a Poisson curve with rate = median count rate of data. |
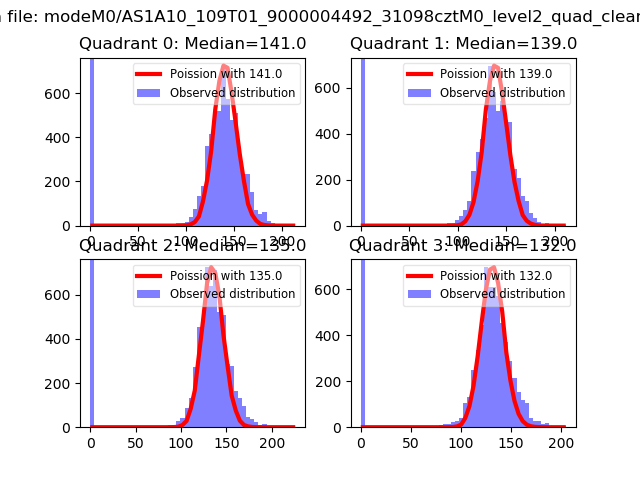 |
 |
| Quadrant-wise count rates Data is divided into 100 sec bins |
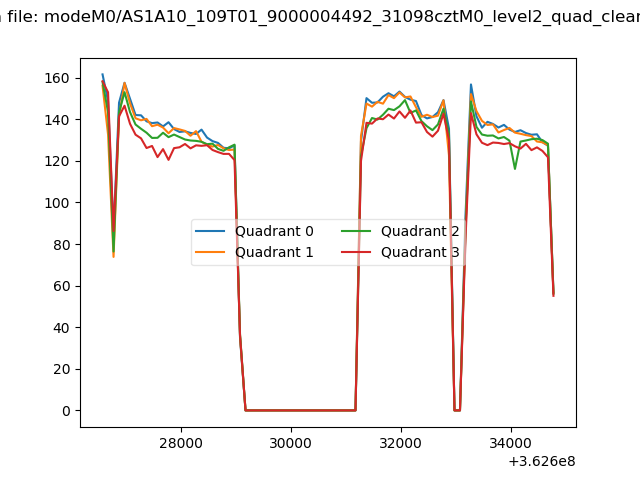 |
|
| Module-wise count rates for Quadrant A Data is divided into 100 sec bins |
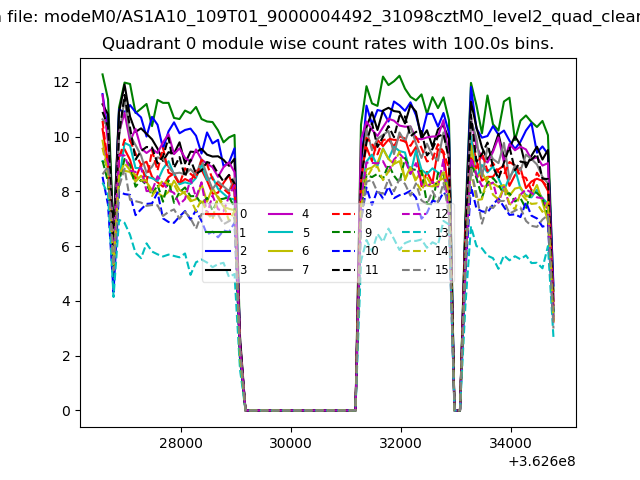 |
 |
| Module-wise count rates for Quadrant B Data is divided into 100 sec bins |
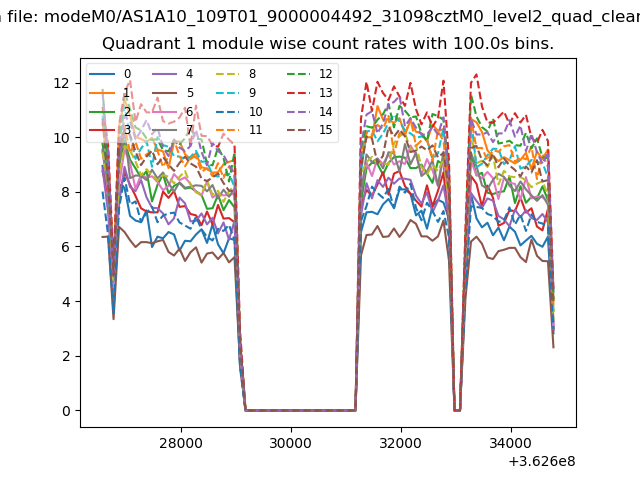 |
 |
| Module-wise count rates for Quadrant C Data is divided into 100 sec bins |
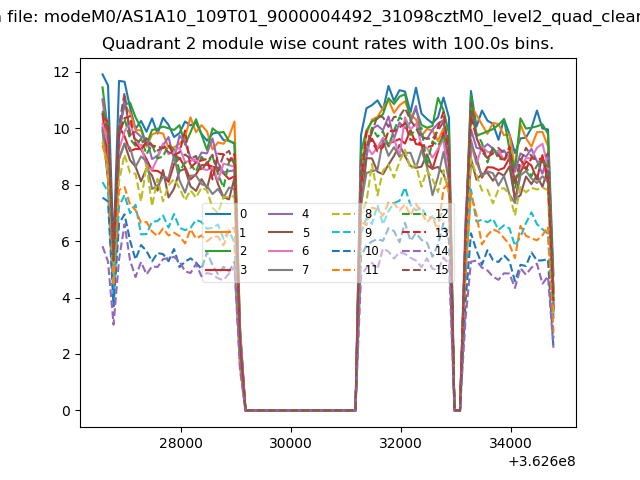 |
 |
| Module-wise count rates for Quadrant D Data is divided into 100 sec bins |
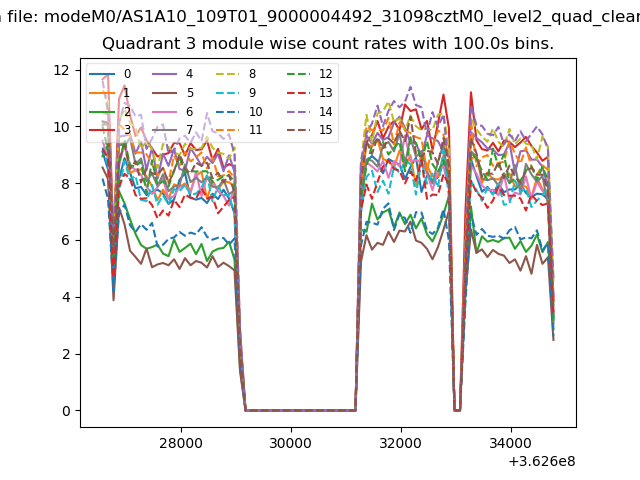 |
 |
| Parameter | Plot |
|---|---|
| CZT HV Monitor | 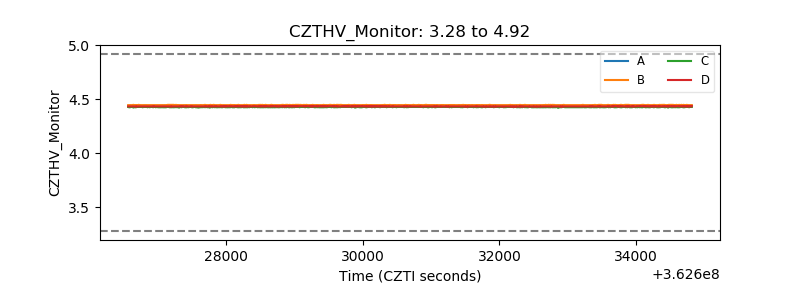 |
| D_VDD | 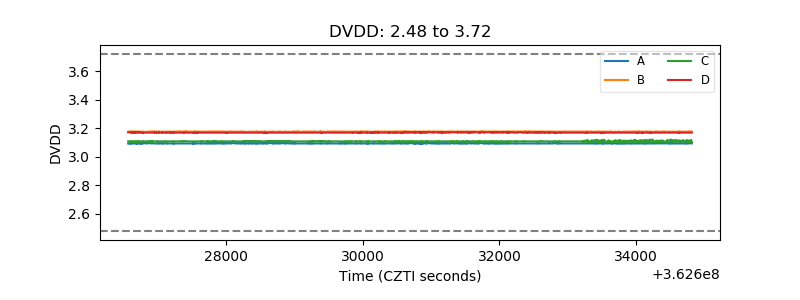 |
| Temperature 1 | 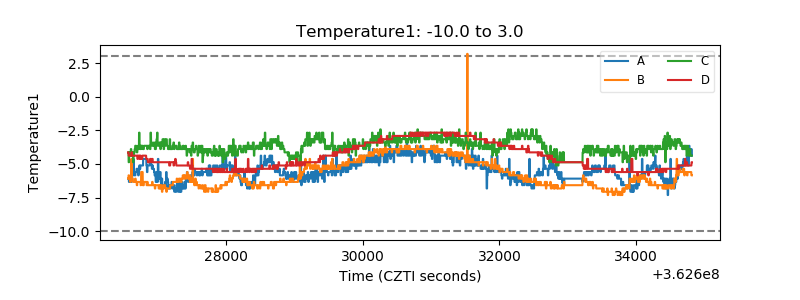 |
| Veto HV Monitor |  |
| Veto LLD | 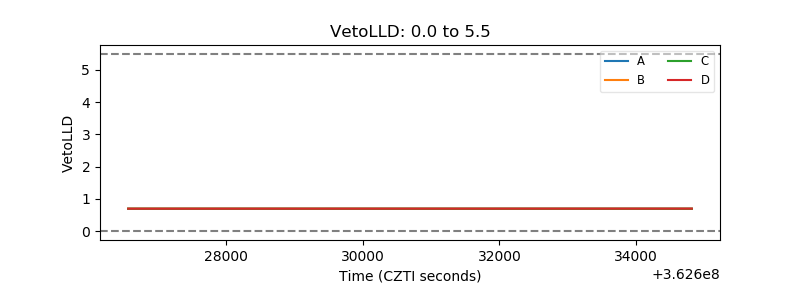 |
| Alpha Counter | 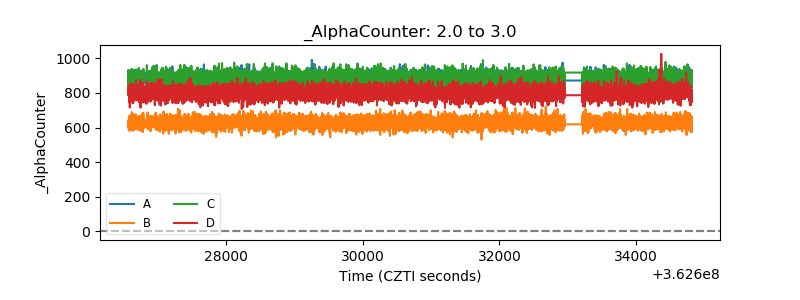 |
| _CPM_Rate | 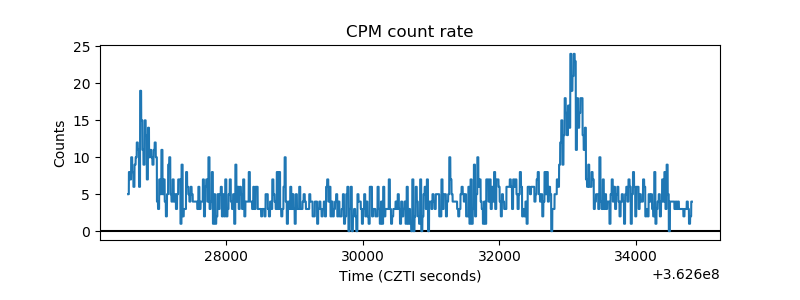 |
| CZT Counter | 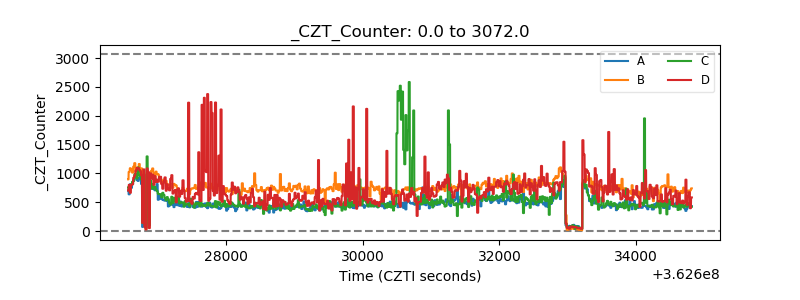 |
| +2.5 Volts monitor |  |
| +5 Volts monitor |  |
| _ROLL_ROT | 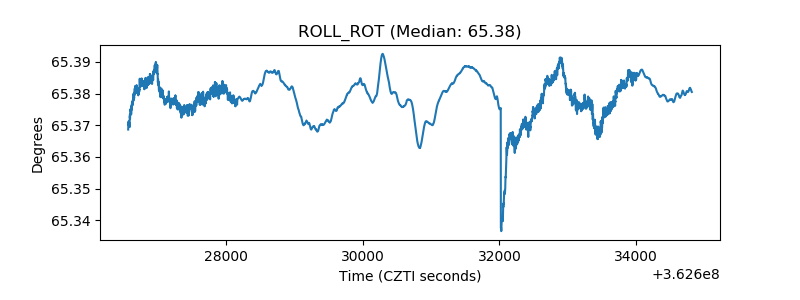 |
| _Roll_DEC | 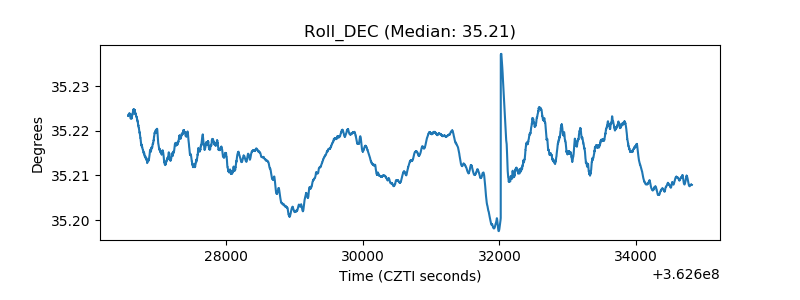 |
| _Roll_RA | 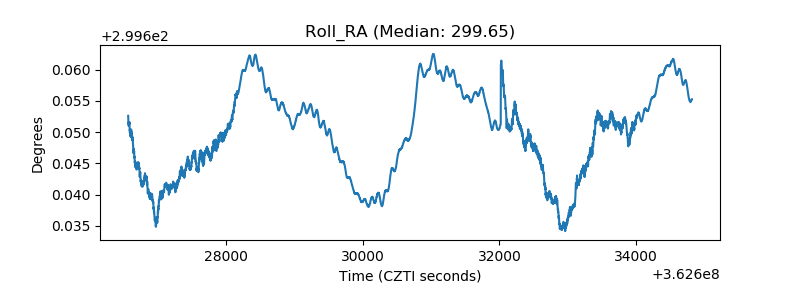 |
| Veto Counter | 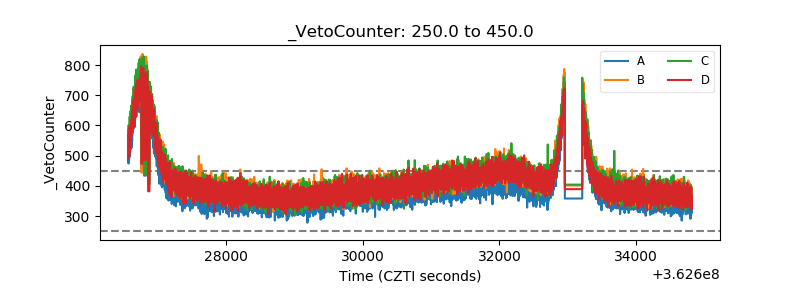 |