| Param | Original file | Final file |
|---|---|---|
| Filename | modeM0/AS1A10_109T01_9000004492_31100cztM0_level2.evt | modeM0/AS1A10_109T01_9000004492_31100cztM0_level2_quad_clean.evt |
| Size (bytes) | 1,019,188,800 | 159,491,520 |
| Size | 972.0 MB | 152.1 MB |
| Events in quadrant A | 5,880,492 | 1,019,005 |
| Events in quadrant B | 9,376,264 | 1,012,213 |
| Events in quadrant C | 6,634,769 | 978,740 |
| Events in quadrant D | 8,132,829 | 957,871 |
| Mode M0 | |||
|---|---|---|---|
| Quadrant | BADHDUFLAG | Total packets | Discarded packets |
| A | 0 | 25340 | 2 |
| B | 0 | 37509 | 4 |
| C | 0 | 27496 | 2 |
| D | 0 | 32290 | 2 |
| Mode SS | |||
|---|---|---|---|
| Quadrant | BADHDUFLAG | Total packets | Discarded packets |
| A | 0 | 252 | 0 |
| B | 0 | 252 | 0 |
| C | 0 | 252 | 0 |
| D | 0 | 252 | 0 |
| Mode M9 | |||
|---|---|---|---|
| Quadrant | BADHDUFLAG | Total packets | Discarded packets |
| A | 0 | 12 | 0 |
| B | 0 | 12 | 0 |
| C | 0 | 12 | 0 |
| D | 0 | 12 | 0 |
| Quadrant | Total seconds | Saturated seconds | Saturation percentage |
|---|---|---|---|
| A | 12481 | 108 | 0.865315% |
| B | 12480 | 190 | 1.522436% |
| C | 12480 | 283 | 2.267628% |
| D | 12481 | 187 | 1.498277% |
Noise dominated data is calculated using 1-second bins in cleaned event files. If a bin has >2000 counts, and if more than 50% of those come from <1% of pixels, then it is considered to be noise-dominated and hence unusable.
| Quadrant | # 1 sec bins | Bins with >0 counts | Bins with >2000 counts | High rate bins dominated by noise | Noise dominated (total time) | Noise dominated (detector-on time) | Marked lightcurve |
|---|---|---|---|---|---|---|---|
| A | 13592 | 12483 | 0 | 0 | 0.00% | 0.00% | 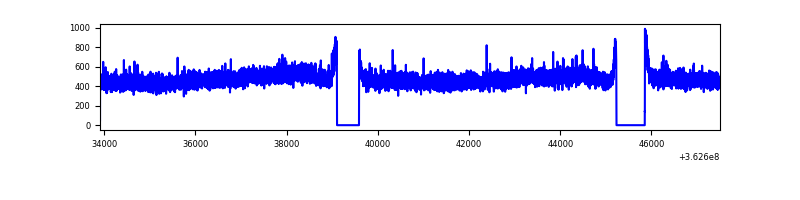 |
| B | 13591 | 12482 | 2 | 2 | 0.01% | 0.02% | 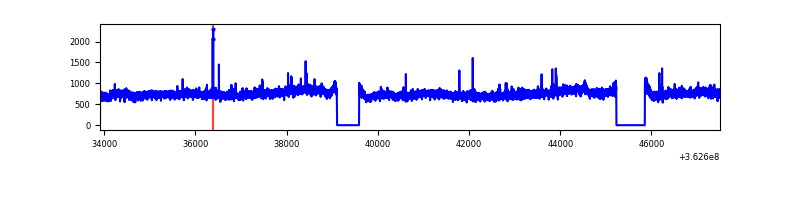 |
| C | 13591 | 12482 | 33 | 33 | 0.24% | 0.26% | 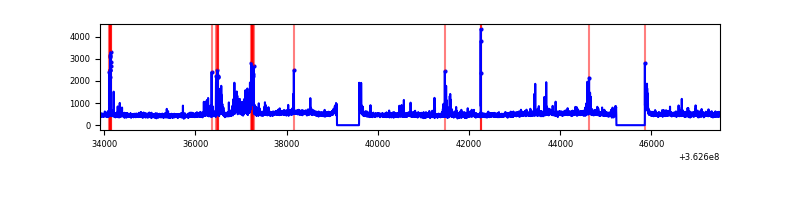 |
| D | 13592 | 12483 | 72 | 72 | 0.53% | 0.58% | 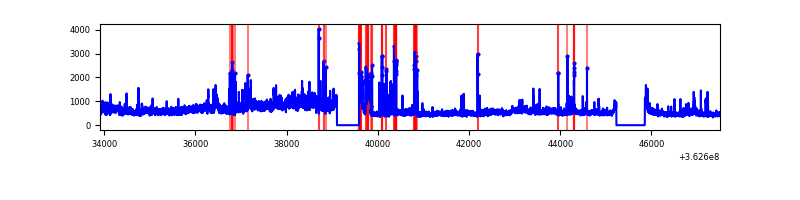 |
Top three noisy pixels from each quadrant. If the there are fewer than three noisy pixels in the level2.evt file, extra rows are filled as -1
| Pixel properties | Quadrant properties | ||||||
|---|---|---|---|---|---|---|---|
| Quadrant | DetID | PixID | Counts | Sigma | Mean | Median | Sigma |
| A | 13 | 254 | 20640 | 62.46 | 1524 | 1494 | 306.5 |
| A | 3 | 137 | 15980 | 47.26 | 1524 | 1494 | 306.5 |
| A | 0 | 226 | 12586 | 36.19 | 1524 | 1494 | 306.5 |
| B | 6 | 159 | 3383688 | 11768.59 | 1498 | 1457 | 287.4 |
| B | 0 | 183 | 44297 | 149.06 | 1498 | 1457 | 287.4 |
| B | 12 | 111 | 37129 | 124.12 | 1498 | 1457 | 287.4 |
| C | 10 | 22 | 373436 | 1081.9 | 1457 | 1467 | 343.8 |
| C | 14 | 238 | 234515 | 677.84 | 1457 | 1467 | 343.8 |
| C | 0 | 10 | 215304 | 621.96 | 1457 | 1467 | 343.8 |
| D | 13 | 174 | 1807523 | 5196.55 | 1466 | 1426 | 347.6 |
| D | 8 | 195 | 695662 | 1997.47 | 1466 | 1426 | 347.6 |
| D | 2 | 250 | 72656 | 204.94 | 1466 | 1426 | 347.6 |
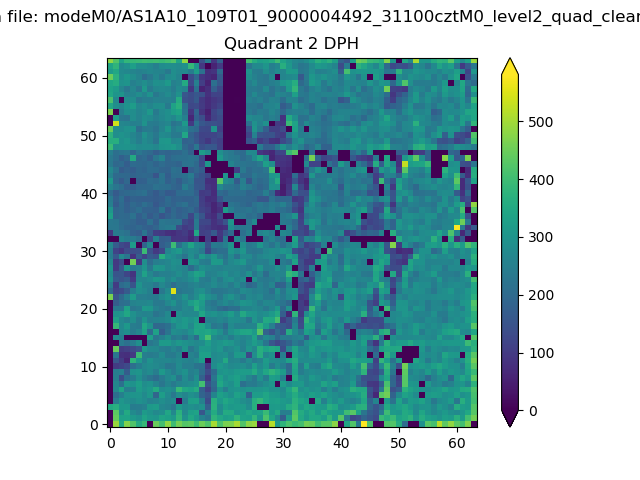
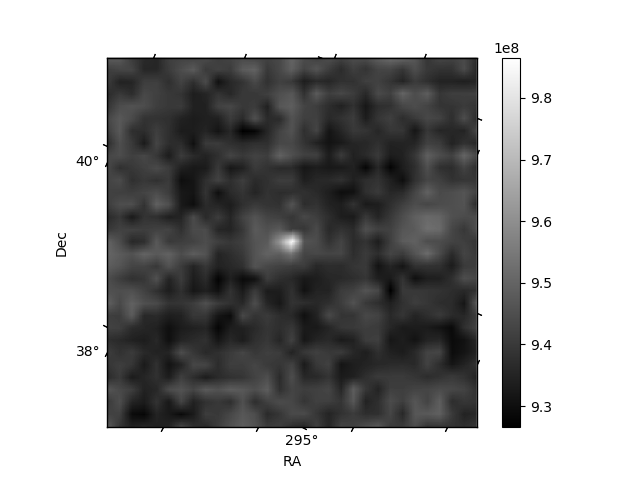
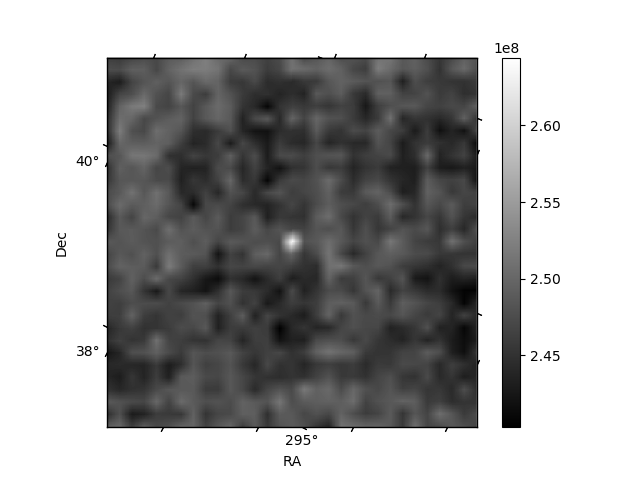
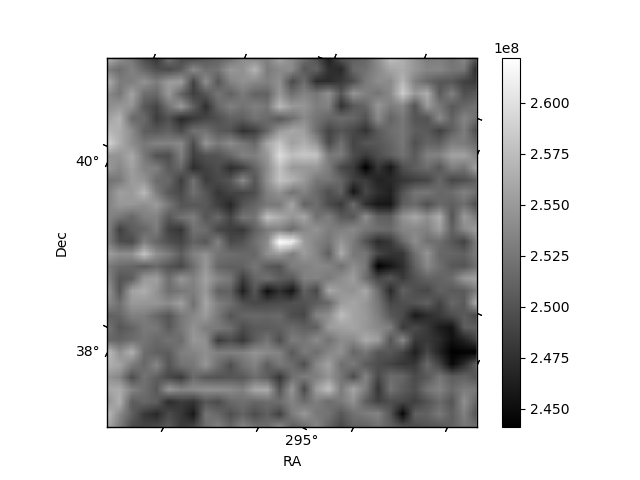
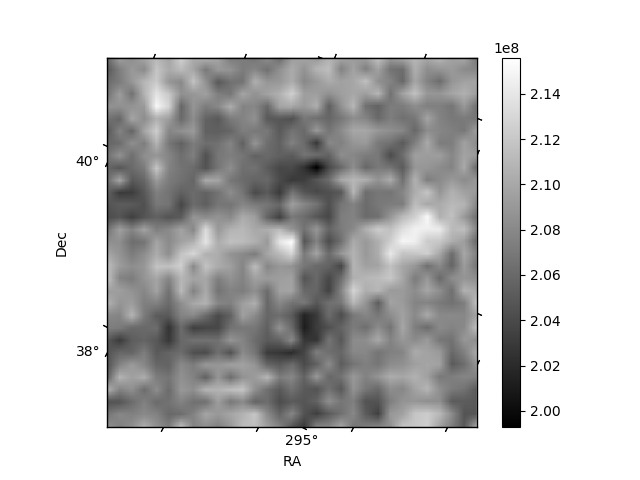
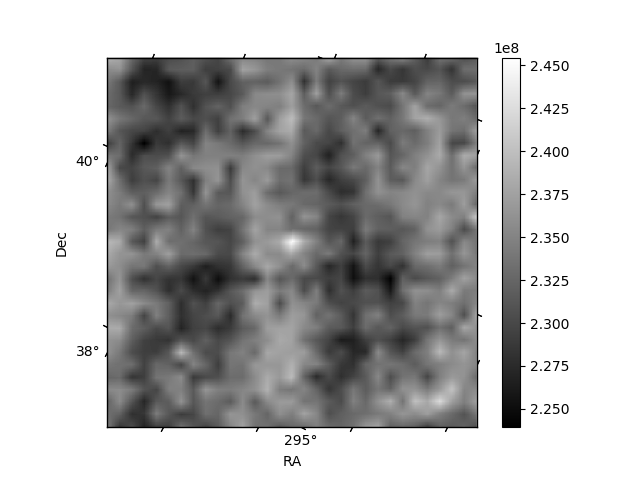
Histogram calculated using DETX and DETY for each event in the final _common_clean file
| Quadrant A | 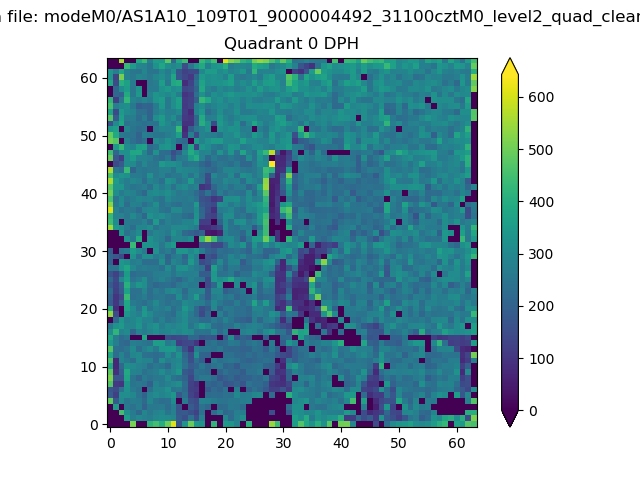 |
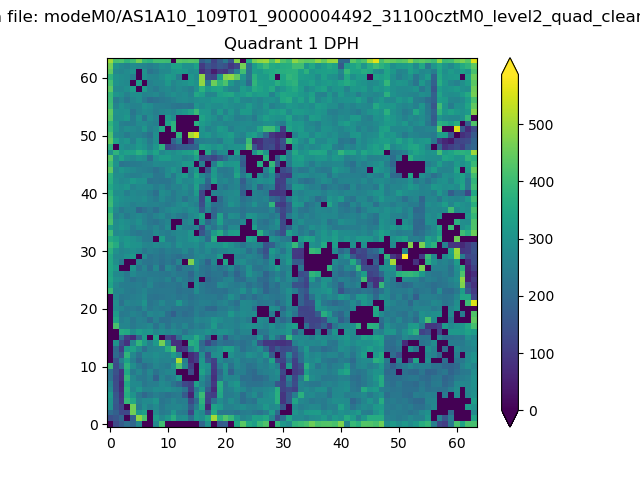 |
Quadrant B |
|---|---|---|---|
| Quadrant D | 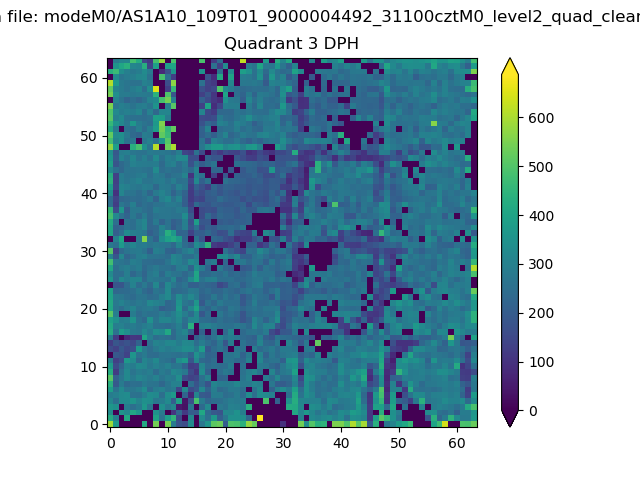 |
 |
Quadrant C |
| Plot type | Count rate plots | Images |
|---|---|---|
| Comparison with Poisson distribution Blue bars denote a histogram of data divided into 1 sec bins. Red curve is a Poisson curve with rate = median count rate of data. |
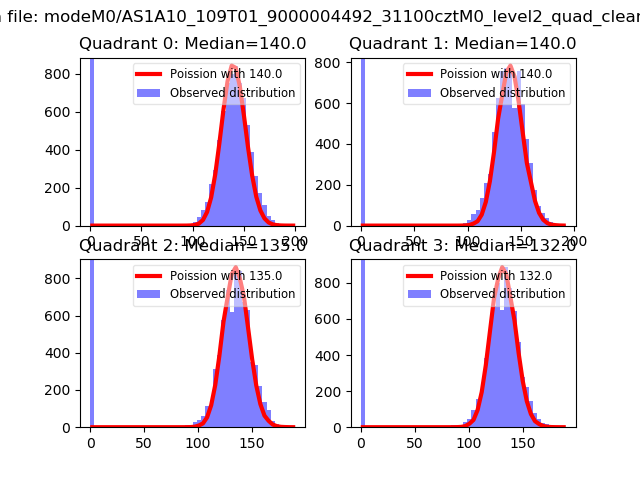 |
 |
| Quadrant-wise count rates Data is divided into 100 sec bins |
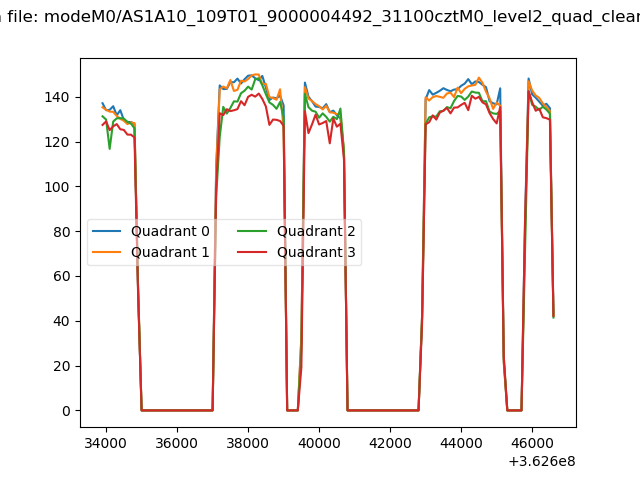 |
|
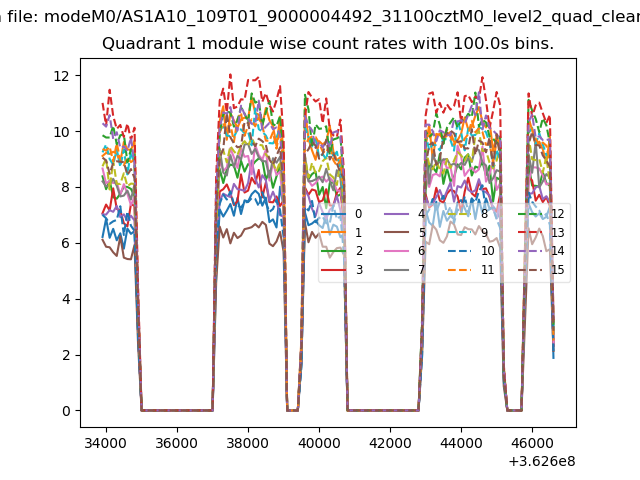
| Module-wise count rates for Quadrant A Data is divided into 100 sec bins |
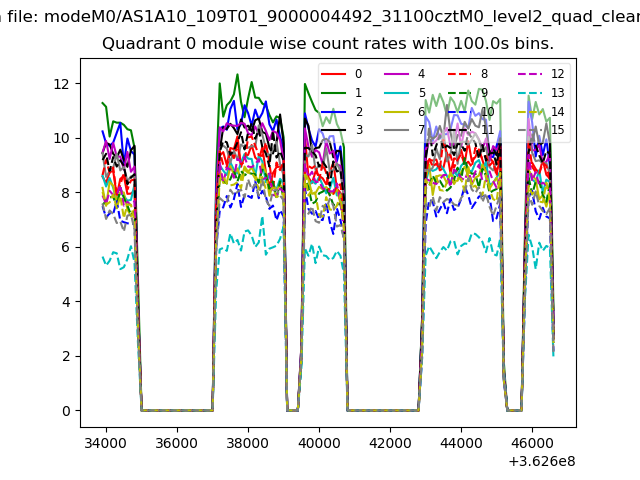 |
 |
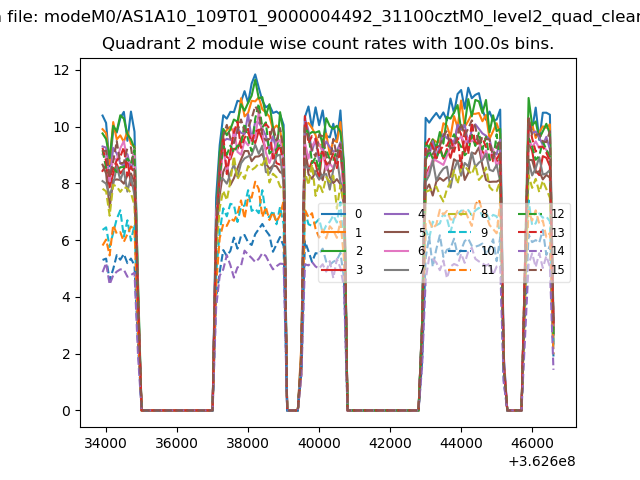
| Module-wise count rates for Quadrant B Data is divided into 100 sec bins |
 |
 |
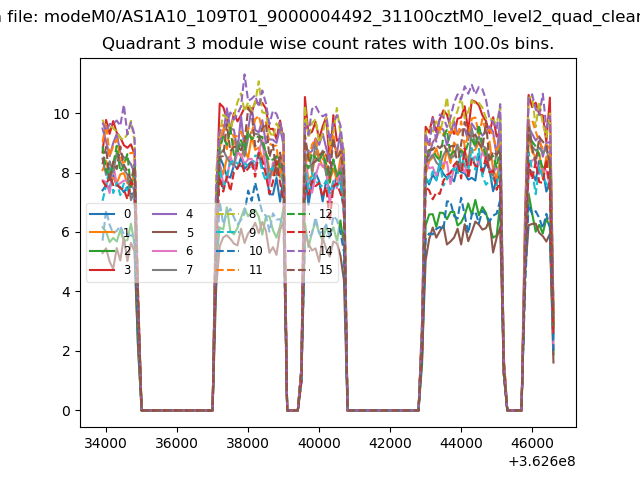
| Module-wise count rates for Quadrant C Data is divided into 100 sec bins |
 |
 |
| Module-wise count rates for Quadrant D Data is divided into 100 sec bins |
 |
 |
| Parameter | Plot |
|---|---|
| CZT HV Monitor | 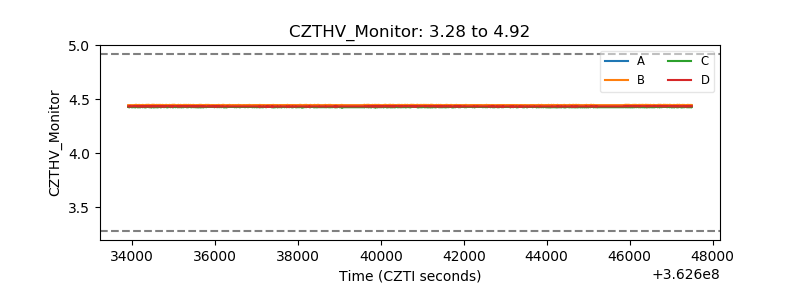 |
| D_VDD | 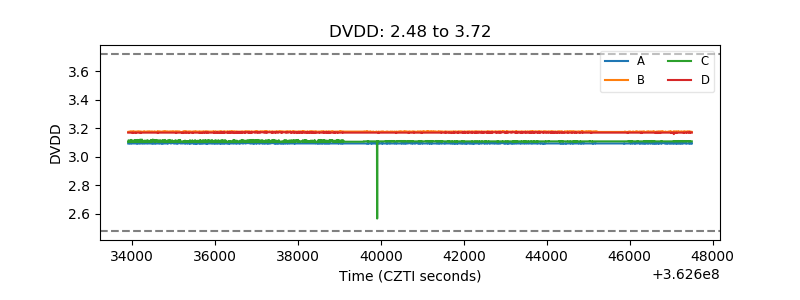 |
| Temperature 1 |  |
| Veto HV Monitor | 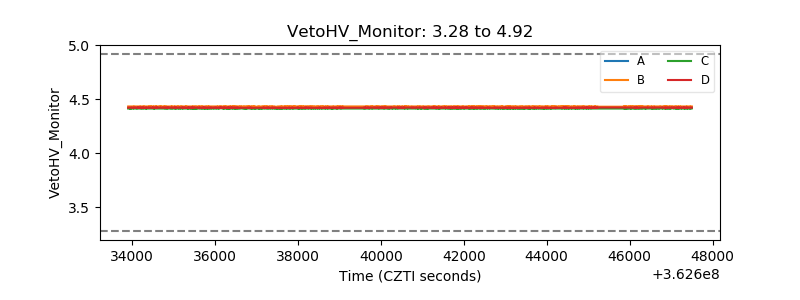 |
| Veto LLD | 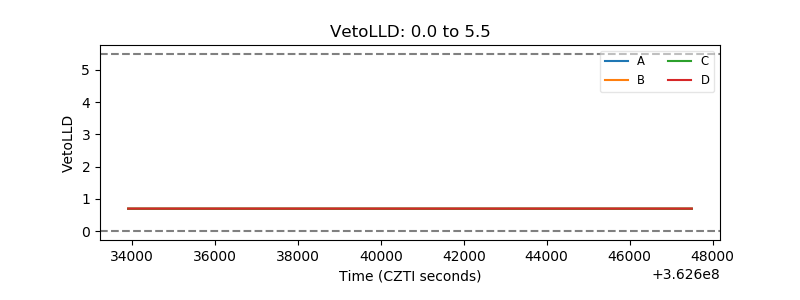 |
| Alpha Counter | 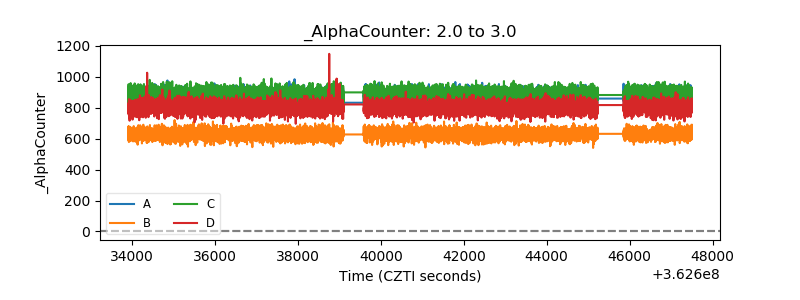 |
| _CPM_Rate | 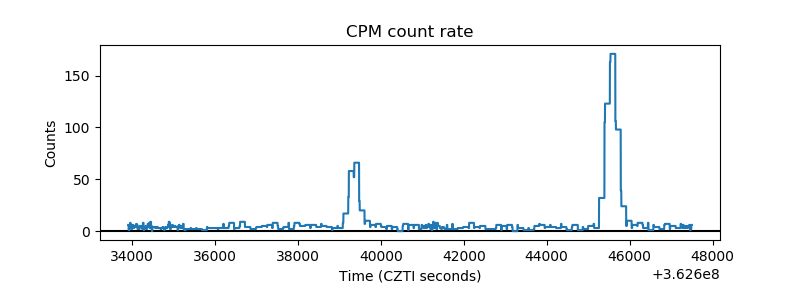 |
| CZT Counter | 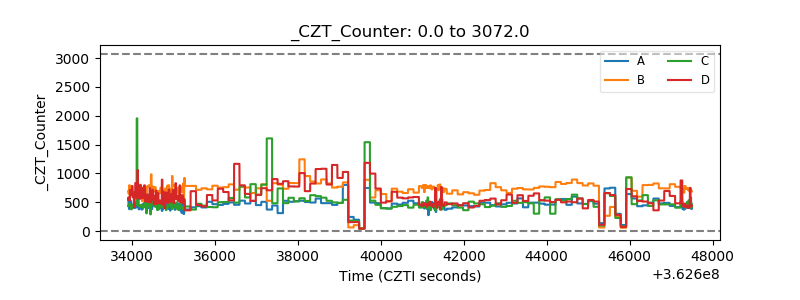 |
| +2.5 Volts monitor |  |
| +5 Volts monitor |  |
| _ROLL_ROT |  |
| _Roll_DEC | 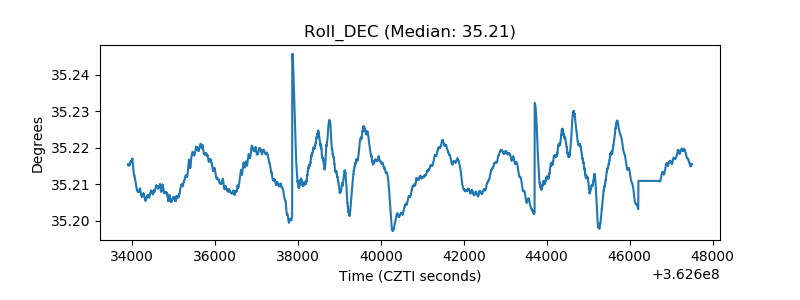 |
| _Roll_RA | 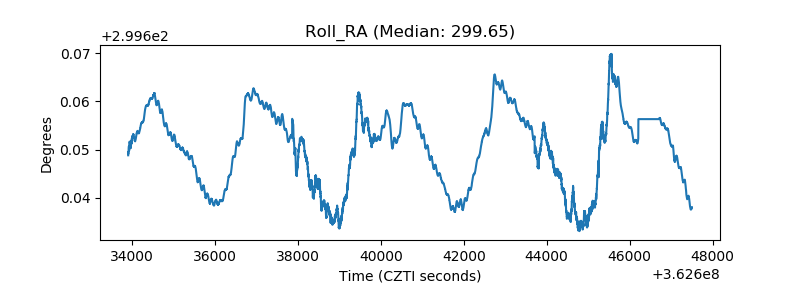 |
| Veto Counter | 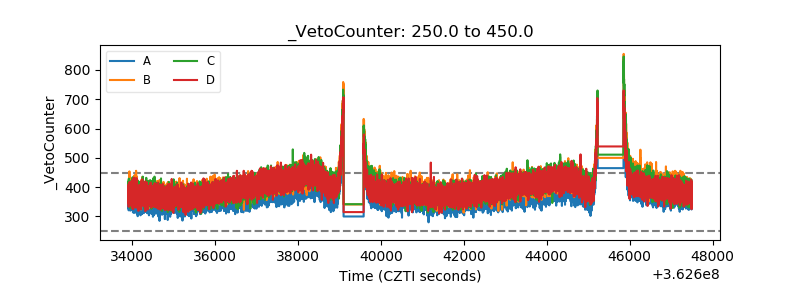 |