| Param | Original file | Final file |
|---|---|---|
| Filename | modeM0/AS1A10_109T01_9000004492_31101cztM0_level2.evt | modeM0/AS1A10_109T01_9000004492_31101cztM0_level2_quad_clean.evt |
| Size (bytes) | 571,547,520 | 88,787,520 |
| Size | 545.1 MB | 84.7 MB |
| Events in quadrant A | 3,482,744 | 561,762 |
| Events in quadrant B | 5,487,807 | 557,416 |
| Events in quadrant C | 3,790,451 | 536,375 |
| Events in quadrant D | 4,060,940 | 532,252 |
| Mode M0 | |||
|---|---|---|---|
| Quadrant | BADHDUFLAG | Total packets | Discarded packets |
| A | 0 | 14734 | 3 |
| B | 0 | 21681 | 2 |
| C | 0 | 15526 | 2 |
| D | 0 | 16552 | 2 |
| Mode SS | |||
|---|---|---|---|
| Quadrant | BADHDUFLAG | Total packets | Discarded packets |
| A | 0 | 146 | 0 |
| B | 0 | 146 | 0 |
| C | 0 | 146 | 0 |
| D | 0 | 146 | 0 |
| Mode M9 | |||
|---|---|---|---|
| Quadrant | BADHDUFLAG | Total packets | Discarded packets |
| A | 0 | 15 | 0 |
| B | 0 | 15 | 0 |
| C | 0 | 15 | 0 |
| D | 0 | 15 | 0 |
| Quadrant | Total seconds | Saturated seconds | Saturation percentage |
|---|---|---|---|
| A | 7198 | 99 | 1.375382% |
| B | 7199 | 167 | 2.319767% |
| C | 7199 | 203 | 2.819836% |
| D | 7199 | 130 | 1.805806% |
Noise dominated data is calculated using 1-second bins in cleaned event files. If a bin has >2000 counts, and if more than 50% of those come from <1% of pixels, then it is considered to be noise-dominated and hence unusable.
| Quadrant | # 1 sec bins | Bins with >0 counts | Bins with >2000 counts | High rate bins dominated by noise | Noise dominated (total time) | Noise dominated (detector-on time) | Marked lightcurve |
|---|---|---|---|---|---|---|---|
| A | 8653 | 7200 | 0 | 0 | 0.00% | 0.00% | 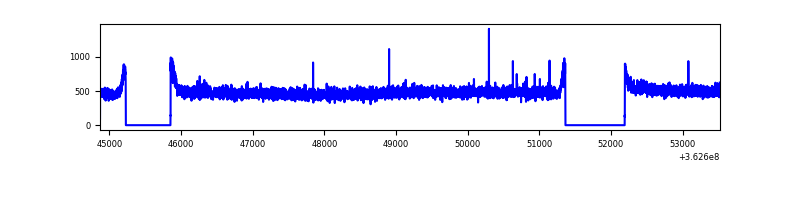 |
| B | 8654 | 7201 | 1 | 1 | 0.01% | 0.01% | 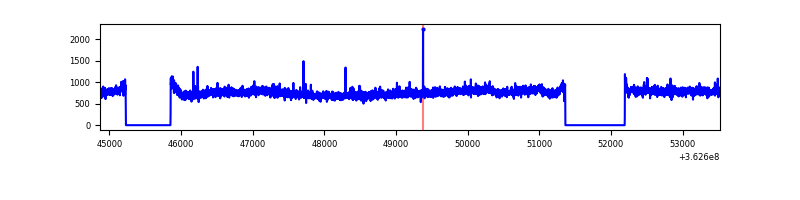 |
| C | 8654 | 7201 | 19 | 19 | 0.22% | 0.26% | 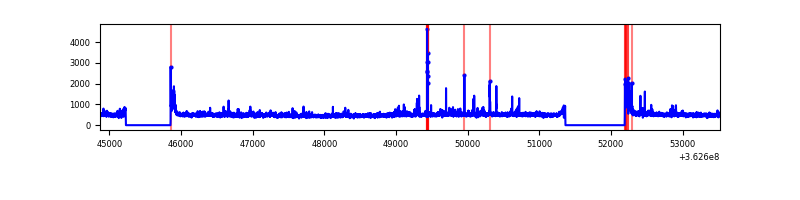 |
| D | 8654 | 7201 | 25 | 25 | 0.29% | 0.35% | 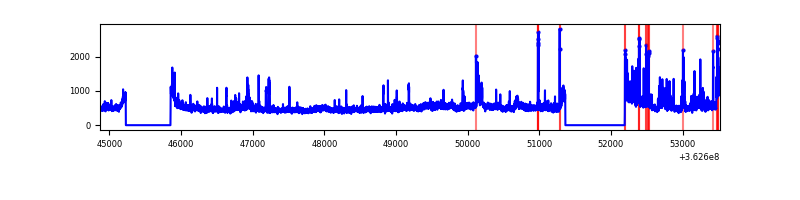 |
Top three noisy pixels from each quadrant. If the there are fewer than three noisy pixels in the level2.evt file, extra rows are filled as -1
| Pixel properties | Quadrant properties | ||||||
|---|---|---|---|---|---|---|---|
| Quadrant | DetID | PixID | Counts | Sigma | Mean | Median | Sigma |
| A | 13 | 254 | 10847 | 55.13 | 901 | 884 | 180.7 |
| A | 3 | 137 | 9674 | 48.64 | 901 | 884 | 180.7 |
| A | 0 | 226 | 7474 | 36.46 | 901 | 884 | 180.7 |
| B | 6 | 159 | 1933298 | 11289.53 | 884 | 863 | 171.2 |
| B | 0 | 183 | 41096 | 235.05 | 884 | 863 | 171.2 |
| B | 0 | 190 | 22673 | 127.42 | 884 | 863 | 171.2 |
| C | 0 | 10 | 226285 | 1114.19 | 855 | 861 | 202.3 |
| C | 14 | 238 | 136481 | 670.32 | 855 | 861 | 202.3 |
| C | 10 | 22 | 51579 | 250.68 | 855 | 861 | 202.3 |
| D | 13 | 174 | 421120 | 2031.51 | 866 | 844 | 206.9 |
| D | 8 | 195 | 355034 | 1712.07 | 866 | 844 | 206.9 |
| D | 2 | 234 | 28899 | 135.61 | 866 | 844 | 206.9 |
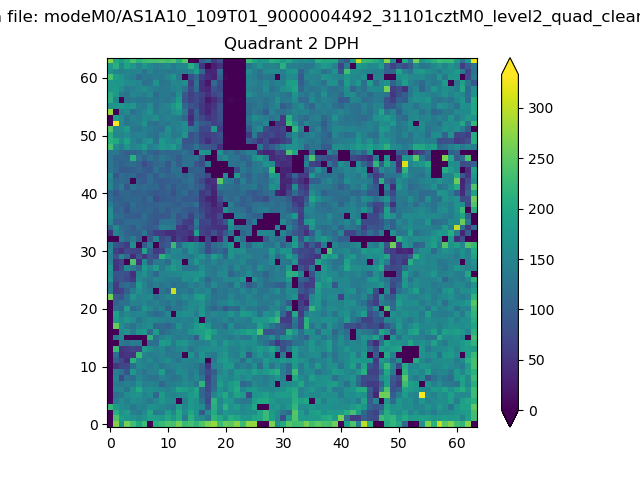
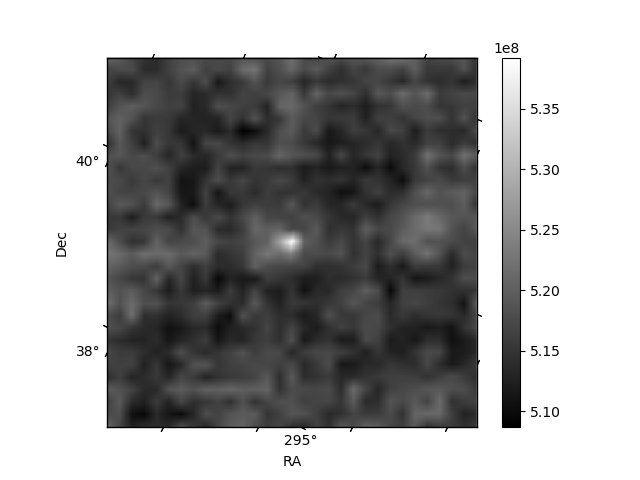
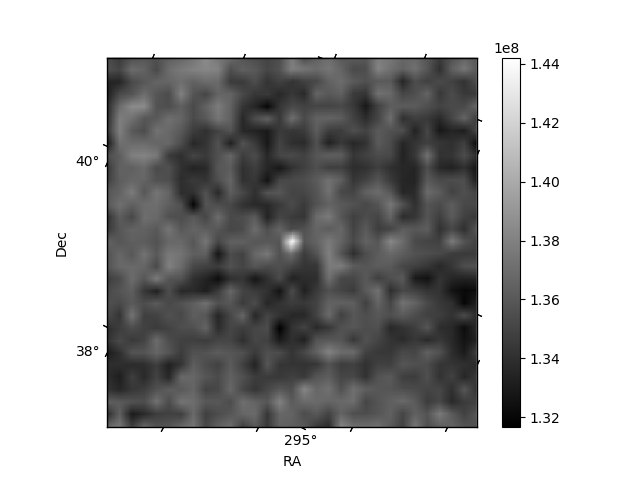
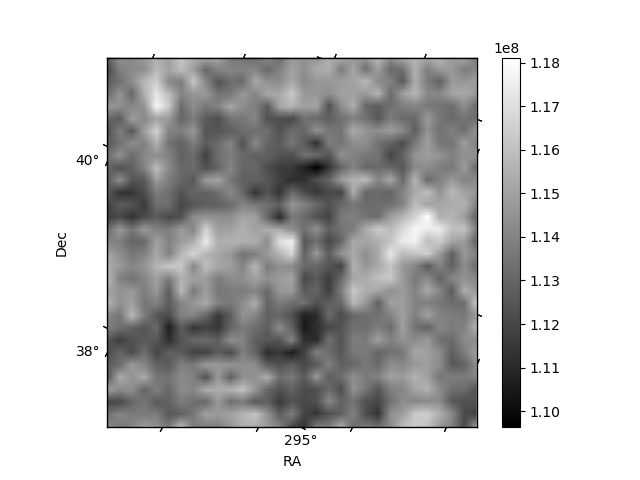
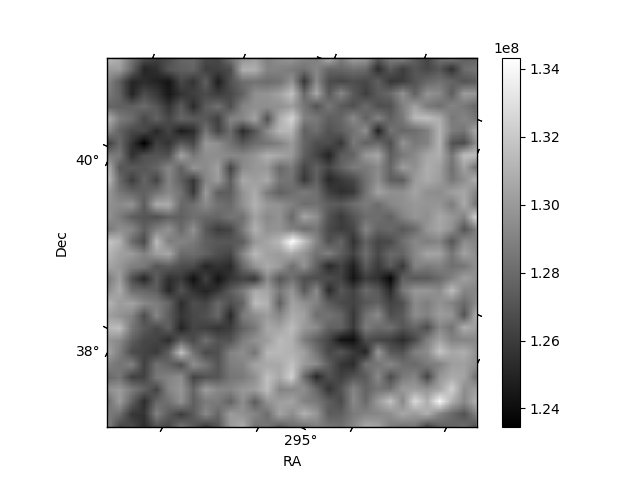
Histogram calculated using DETX and DETY for each event in the final _common_clean file
| Quadrant A | 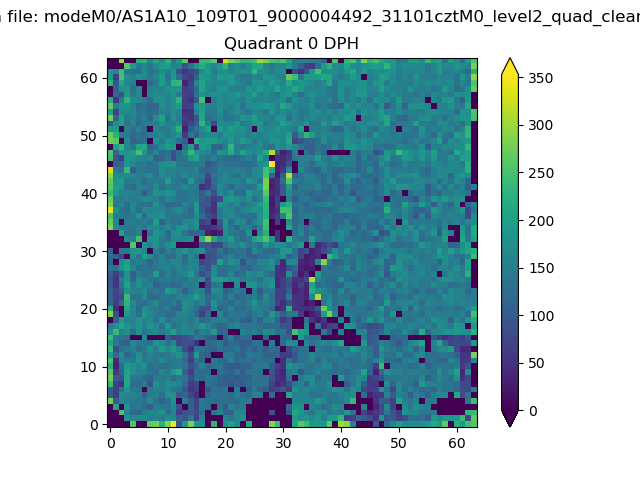 |
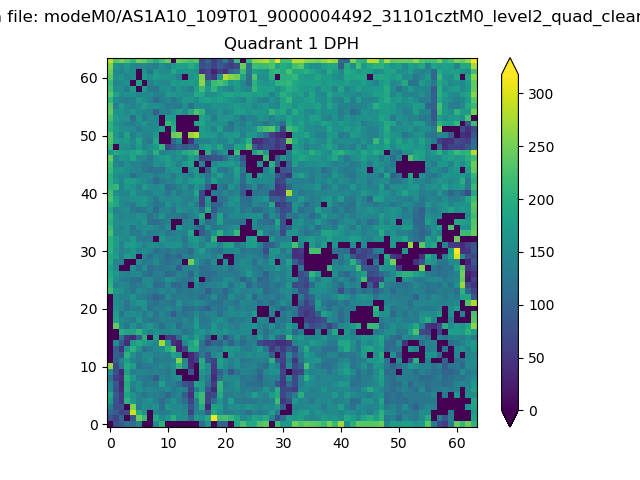 |
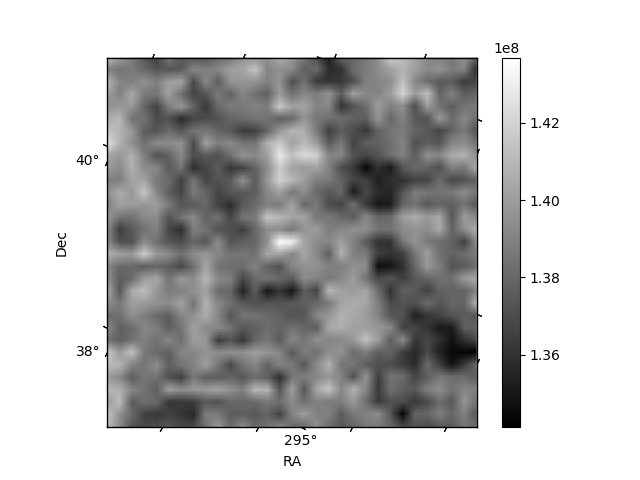
Quadrant B |
|---|---|---|---|
| Quadrant D | 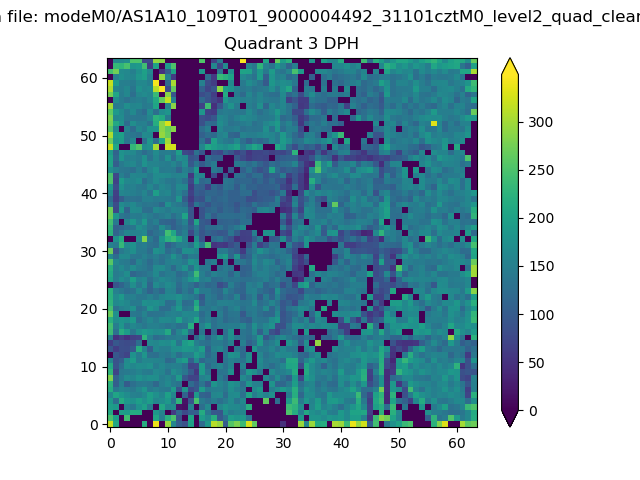 |
 |
Quadrant C |
| Plot type | Count rate plots | Images |
|---|---|---|
| Comparison with Poisson distribution Blue bars denote a histogram of data divided into 1 sec bins. Red curve is a Poisson curve with rate = median count rate of data. |
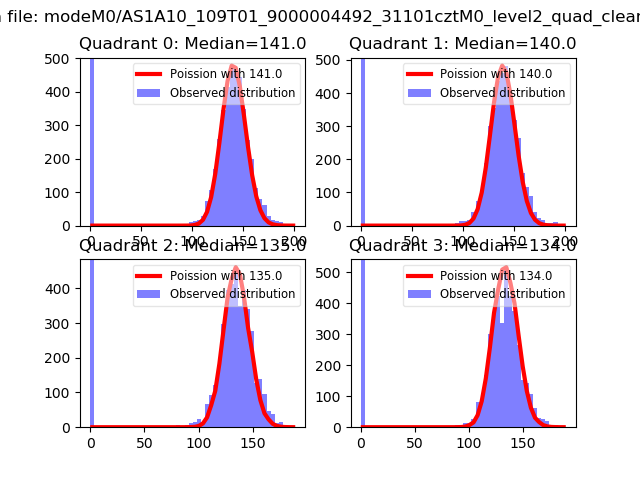 |
 |
| Quadrant-wise count rates Data is divided into 100 sec bins |
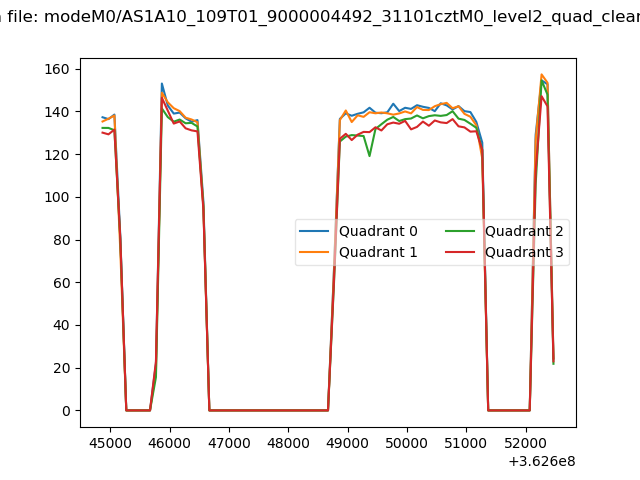 |
|
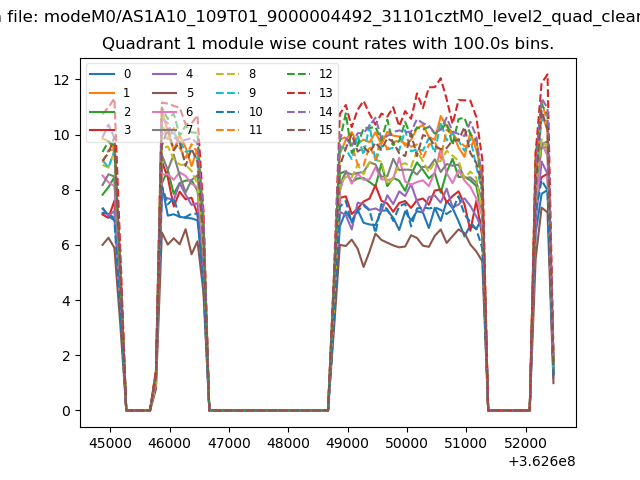
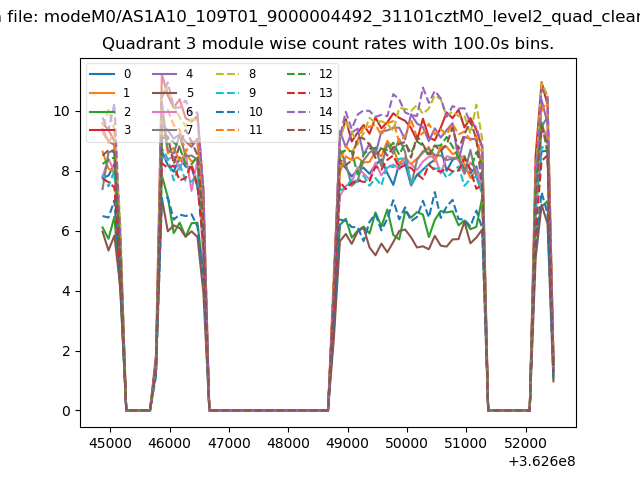
| Module-wise count rates for Quadrant A Data is divided into 100 sec bins |
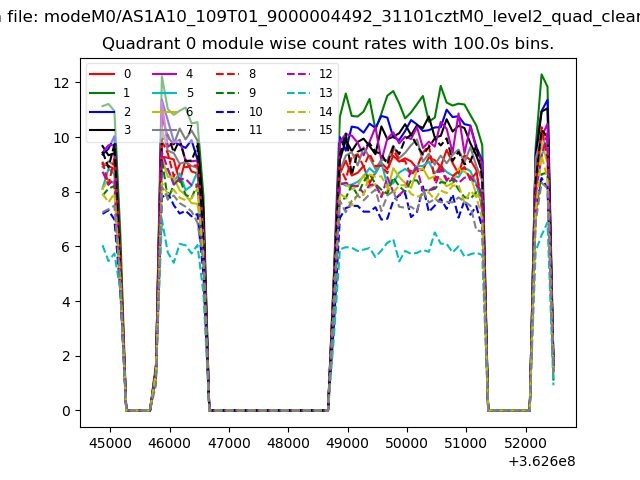 |
 |
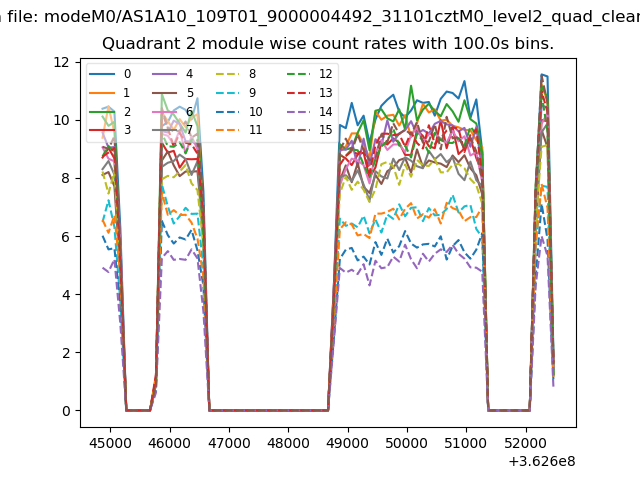
| Module-wise count rates for Quadrant B Data is divided into 100 sec bins |
 |
 |
| Module-wise count rates for Quadrant C Data is divided into 100 sec bins |
 |
 |
| Module-wise count rates for Quadrant D Data is divided into 100 sec bins |
 |
 |
| Parameter | Plot |
|---|---|
| CZT HV Monitor | 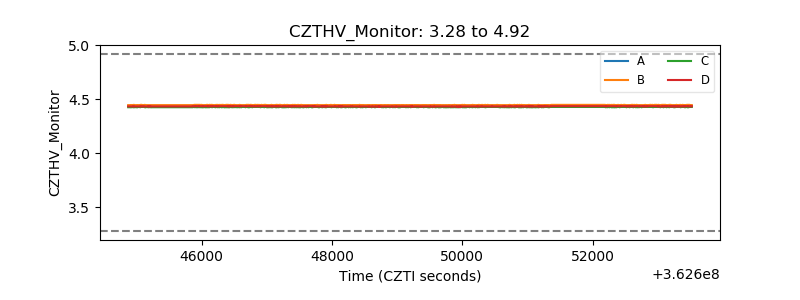 |
| D_VDD | 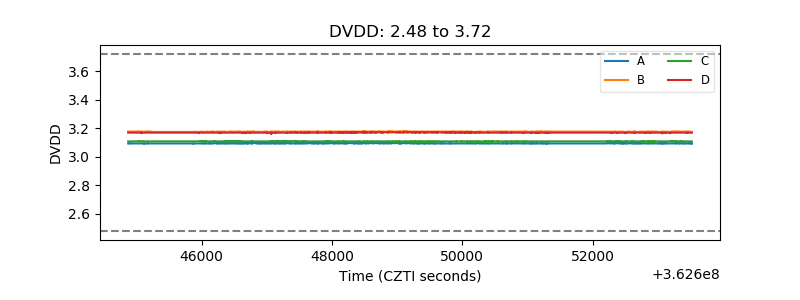 |
| Temperature 1 | 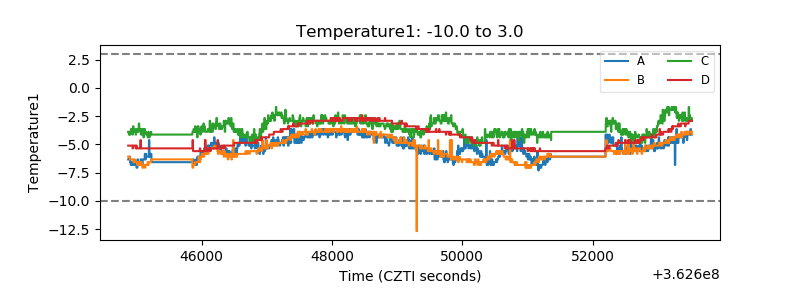 |
| Veto HV Monitor | 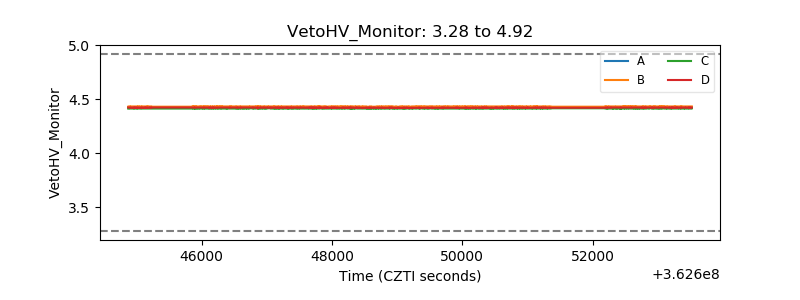 |
| Veto LLD | 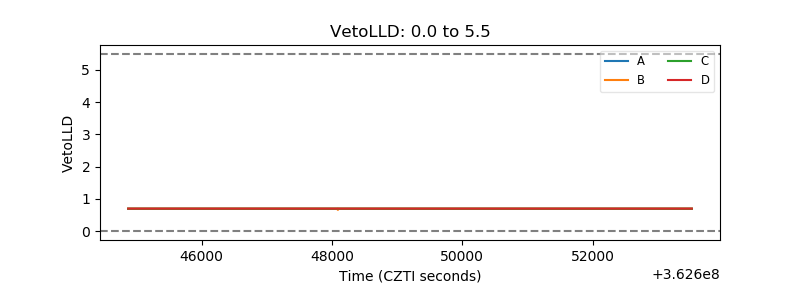 |
| Alpha Counter | 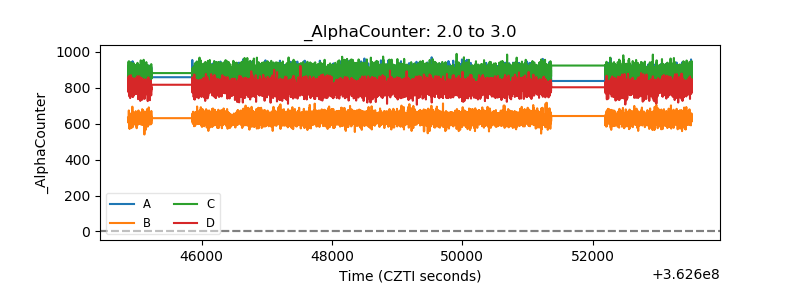 |
| _CPM_Rate | 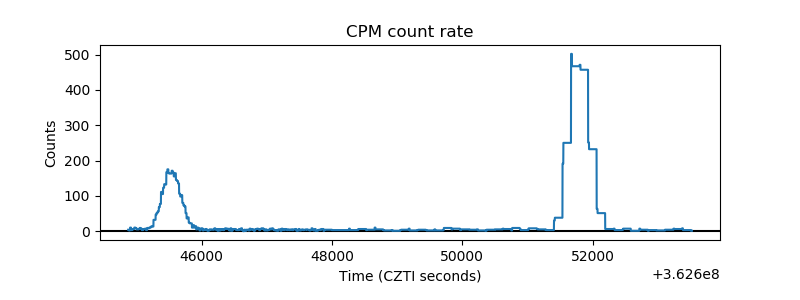 |
| CZT Counter | 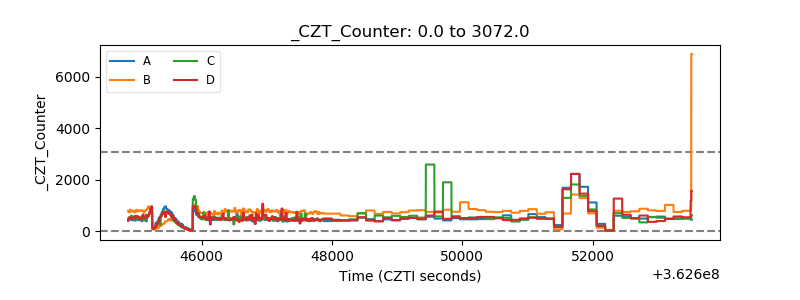 |
| +2.5 Volts monitor |  |
| +5 Volts monitor |  |
| _ROLL_ROT | 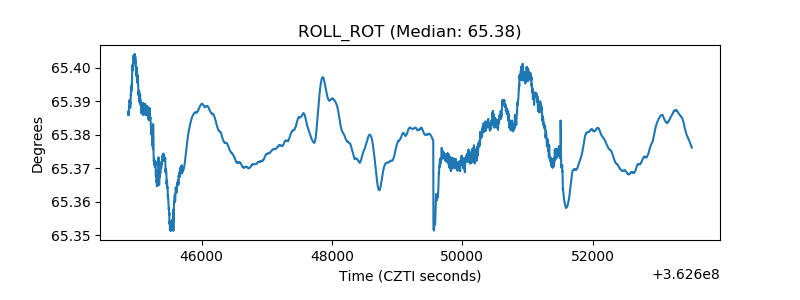 |
| _Roll_DEC | 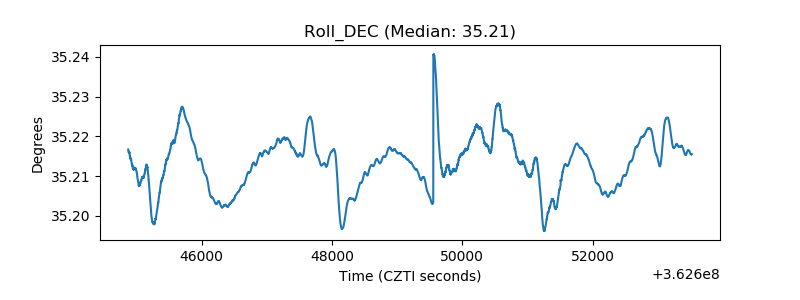 |
| _Roll_RA | 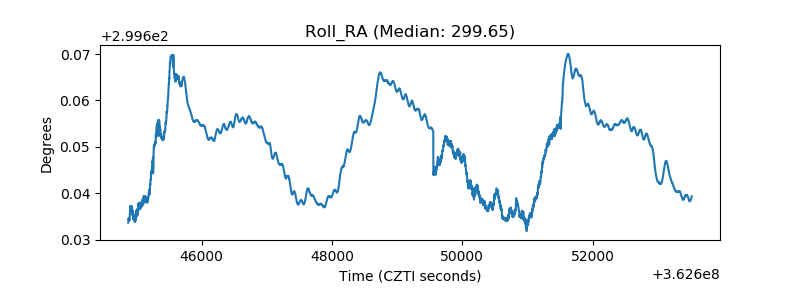 |
| Veto Counter | 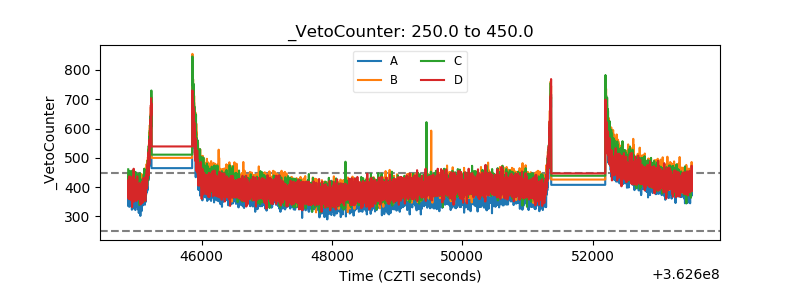 |