| Param | Original file | Final file |
|---|---|---|
| Filename | modeM0/AS1A10_109T01_9000004492_31102cztM0_level2.evt | modeM0/AS1A10_109T01_9000004492_31102cztM0_level2_quad_clean.evt |
| Size (bytes) | 562,674,240 | 72,334,080 |
| Size | 536.6 MB | 69.0 MB |
| Events in quadrant A | 3,297,922 | 446,278 |
| Events in quadrant B | 5,140,563 | 441,346 |
| Events in quadrant C | 3,522,745 | 424,169 |
| Events in quadrant D | 4,631,321 | 416,754 |
| Mode M0 | |||
|---|---|---|---|
| Quadrant | BADHDUFLAG | Total packets | Discarded packets |
| A | 0 | 13770 | 2 |
| B | 0 | 20037 | 4 |
| C | 0 | 14424 | 2 |
| D | 0 | 18140 | 2 |
| Mode SS | |||
|---|---|---|---|
| Quadrant | BADHDUFLAG | Total packets | Discarded packets |
| A | 0 | 136 | 0 |
| B | 0 | 136 | 0 |
| C | 0 | 136 | 0 |
| D | 0 | 136 | 0 |
| Mode M9 | |||
|---|---|---|---|
| Quadrant | BADHDUFLAG | Total packets | Discarded packets |
| A | 0 | 17 | 0 |
| B | 0 | 18 | 0 |
| C | 0 | 18 | 0 |
| D | 0 | 18 | 0 |
| Quadrant | Total seconds | Saturated seconds | Saturation percentage |
|---|---|---|---|
| A | 6622 | 54 | 0.815464% |
| B | 6621 | 110 | 1.661380% |
| C | 6621 | 146 | 2.205105% |
| D | 6621 | 134 | 2.023863% |
Noise dominated data is calculated using 1-second bins in cleaned event files. If a bin has >2000 counts, and if more than 50% of those come from <1% of pixels, then it is considered to be noise-dominated and hence unusable.
| Quadrant | # 1 sec bins | Bins with >0 counts | Bins with >2000 counts | High rate bins dominated by noise | Noise dominated (total time) | Noise dominated (detector-on time) | Marked lightcurve |
|---|---|---|---|---|---|---|---|
| A | 7602 | 6623 | 0 | 0 | 0.00% | 0.00% | 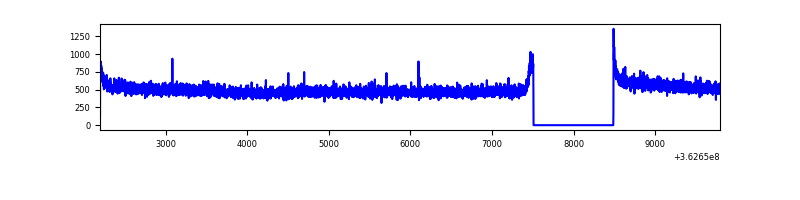 |
| B | 7601 | 6622 | 5 | 5 | 0.07% | 0.08% | 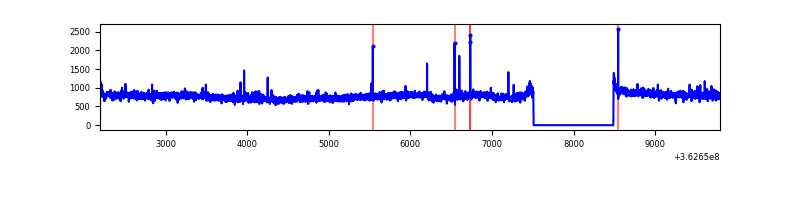 |
| C | 7601 | 6622 | 19 | 19 | 0.25% | 0.29% | 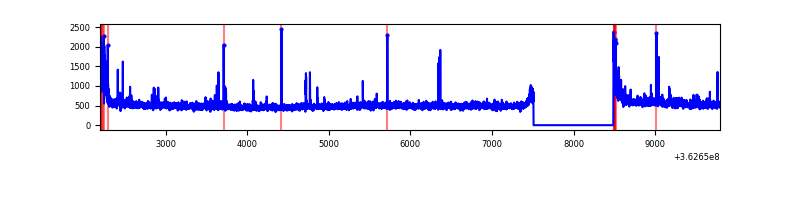 |
| D | 7601 | 6622 | 70 | 70 | 0.92% | 1.06% | 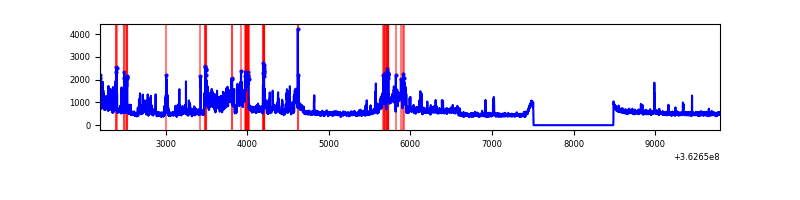 |
Top three noisy pixels from each quadrant. If the there are fewer than three noisy pixels in the level2.evt file, extra rows are filled as -1
| Pixel properties | Quadrant properties | ||||||
|---|---|---|---|---|---|---|---|
| Quadrant | DetID | PixID | Counts | Sigma | Mean | Median | Sigma |
| A | 13 | 254 | 11029 | 59.41 | 853 | 838 | 171.5 |
| A | 3 | 137 | 8827 | 46.58 | 853 | 838 | 171.5 |
| A | 0 | 226 | 7349 | 37.96 | 853 | 838 | 171.5 |
| B | 6 | 159 | 1782500 | 11079.81 | 835 | 814 | 160.8 |
| B | 0 | 190 | 26461 | 159.49 | 835 | 814 | 160.8 |
| B | 10 | 247 | 22813 | 136.81 | 835 | 814 | 160.8 |
| C | 0 | 10 | 194200 | 1022.4 | 804 | 810 | 189.2 |
| C | 14 | 238 | 129744 | 681.64 | 804 | 810 | 189.2 |
| C | 10 | 22 | 32787 | 169.05 | 804 | 810 | 189.2 |
| D | 13 | 174 | 1293842 | 6715.67 | 814 | 794 | 192.5 |
| D | 8 | 195 | 222919 | 1153.64 | 814 | 794 | 192.5 |
| D | 2 | 234 | 26299 | 132.46 | 814 | 794 | 192.5 |
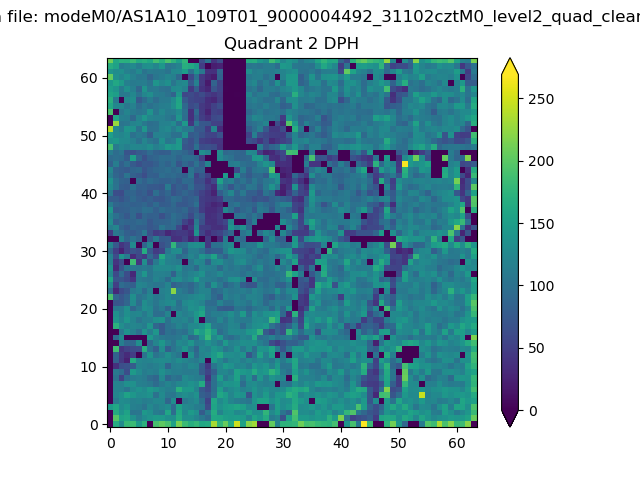
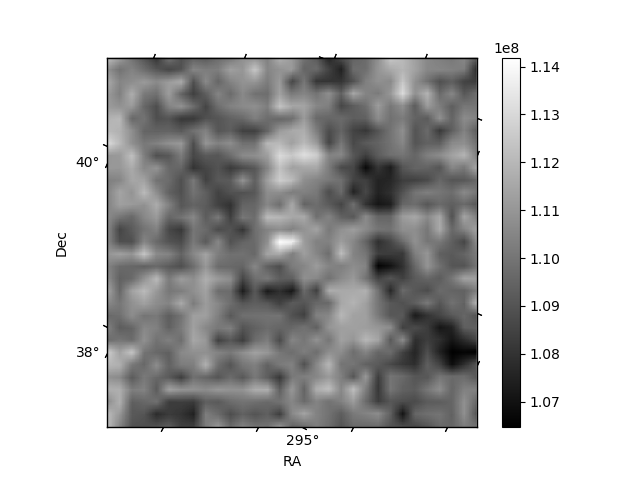
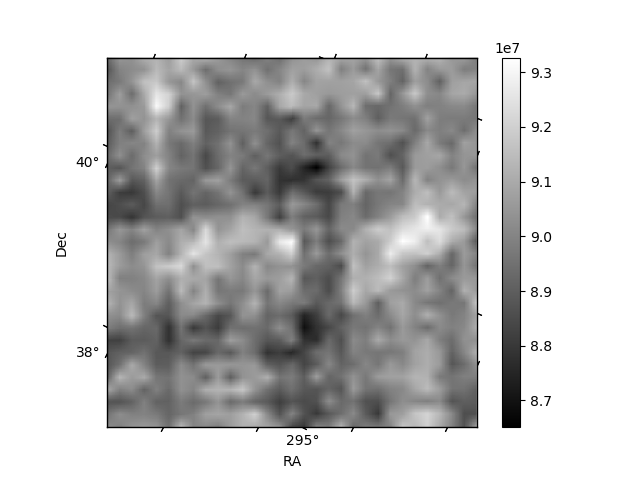
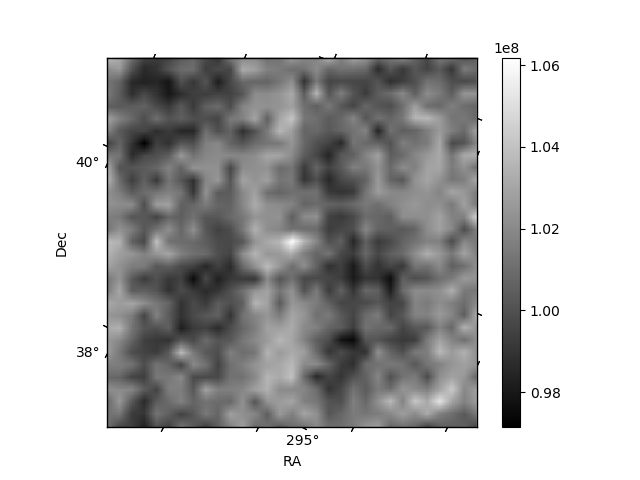
Histogram calculated using DETX and DETY for each event in the final _common_clean file
| Quadrant A | 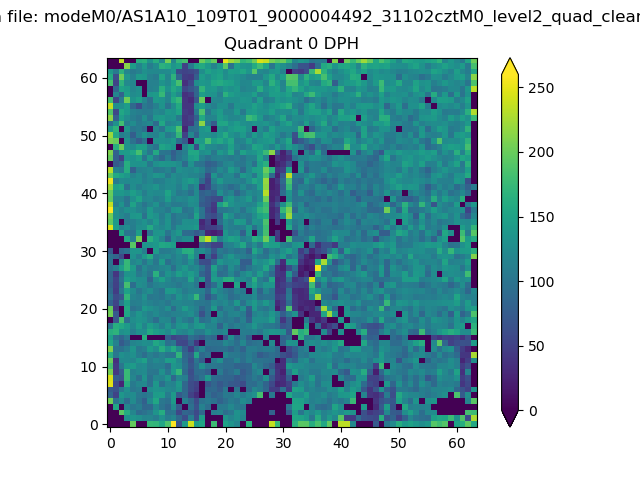 |
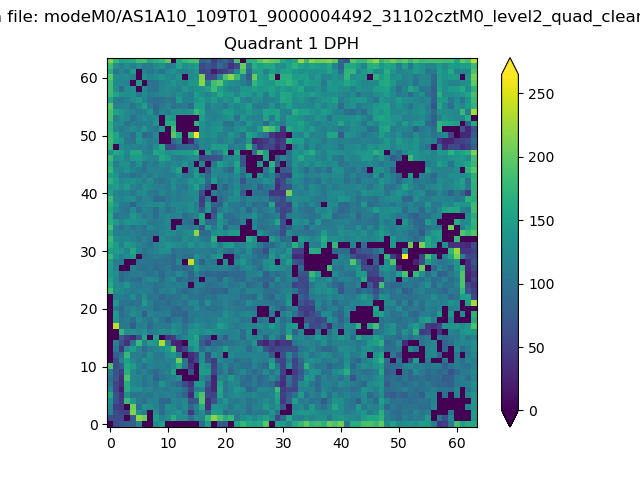 |
Quadrant B |
|---|---|---|---|
| Quadrant D | 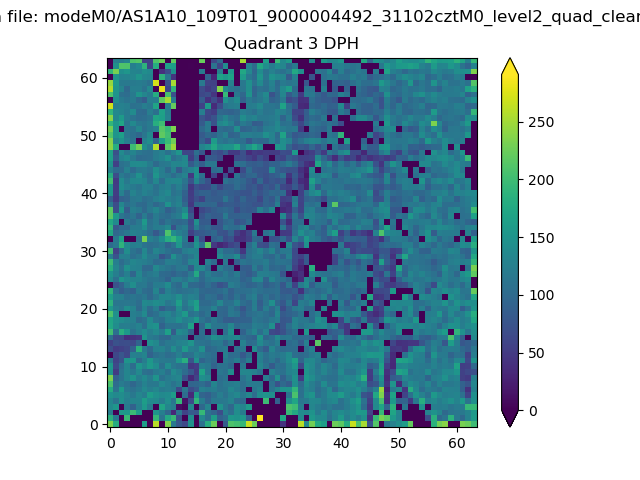 |
 |
Quadrant C |
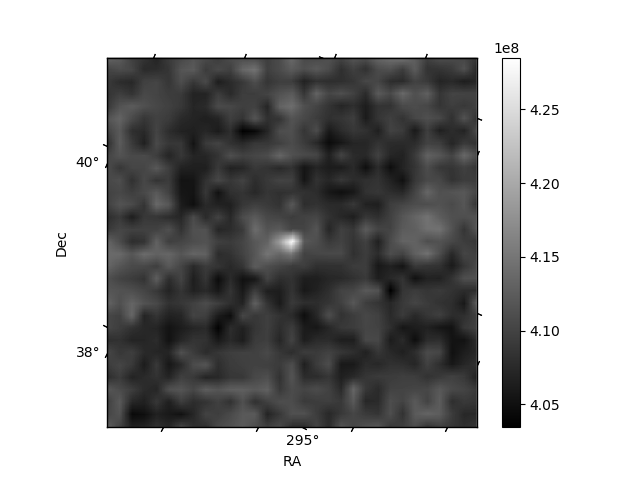
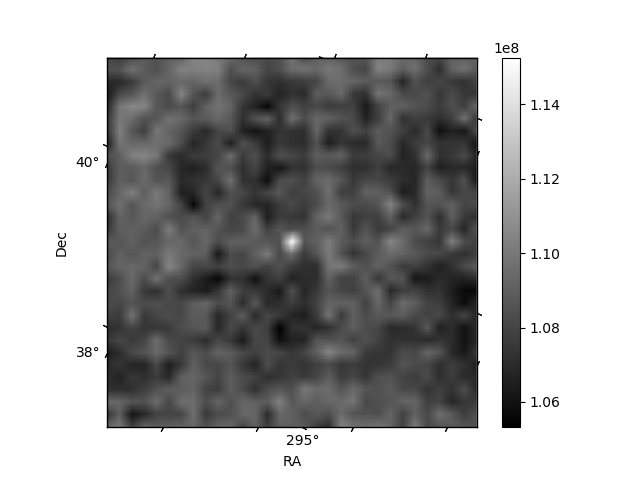
| Plot type | Count rate plots | Images |
|---|---|---|
| Comparison with Poisson distribution Blue bars denote a histogram of data divided into 1 sec bins. Red curve is a Poisson curve with rate = median count rate of data. |
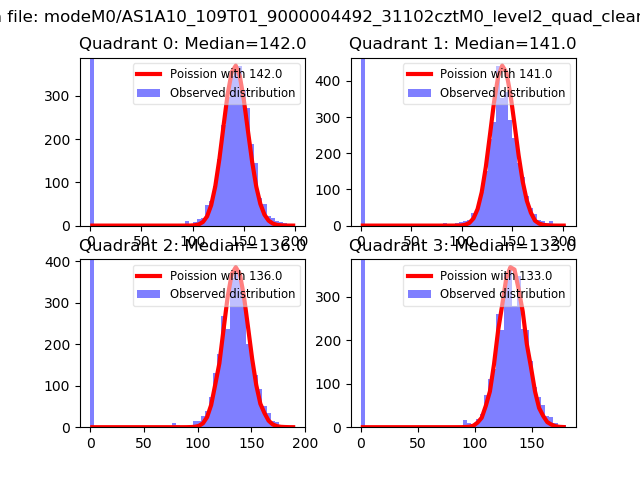 |
 |
| Quadrant-wise count rates Data is divided into 100 sec bins |
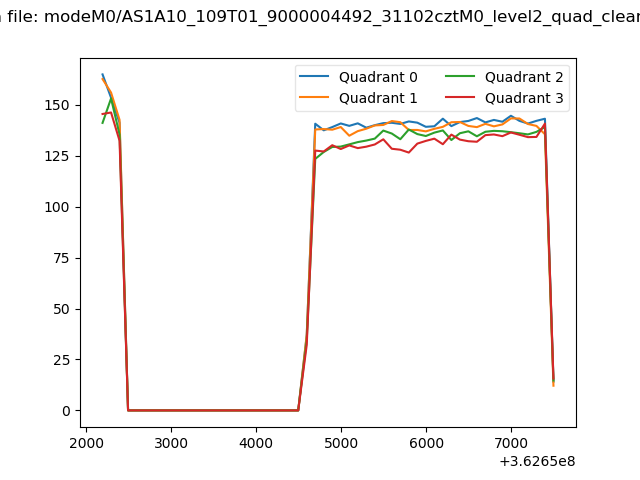 |
|
| Module-wise count rates for Quadrant A Data is divided into 100 sec bins |
 |
 |
| Module-wise count rates for Quadrant B Data is divided into 100 sec bins |
 |
 |
| Module-wise count rates for Quadrant C Data is divided into 100 sec bins |
 |
 |
| Module-wise count rates for Quadrant D Data is divided into 100 sec bins |
 |
 |
| Parameter | Plot |
|---|---|
| CZT HV Monitor | 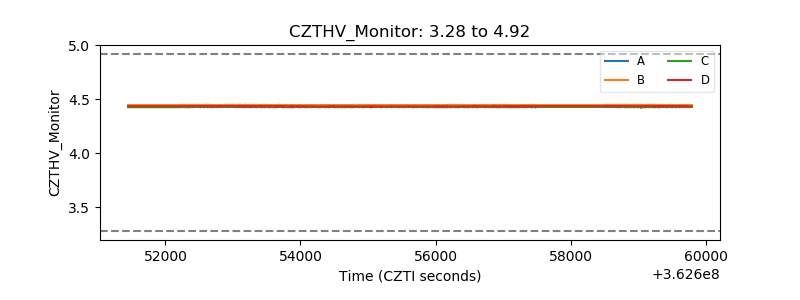 |
| D_VDD | 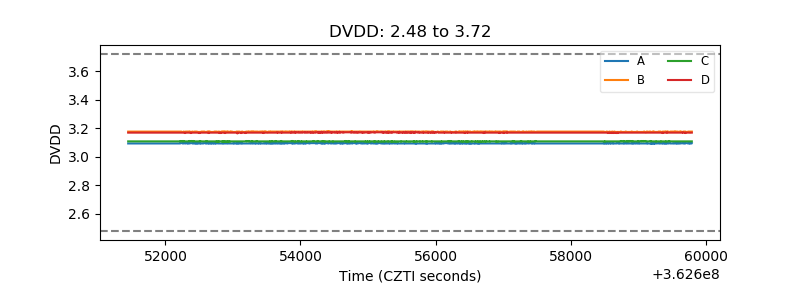 |
| Temperature 1 | 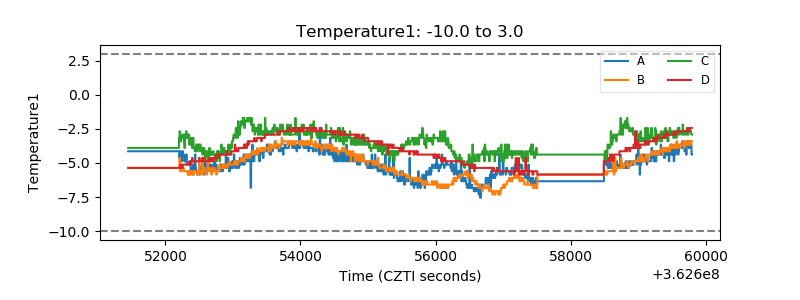 |
| Veto HV Monitor | 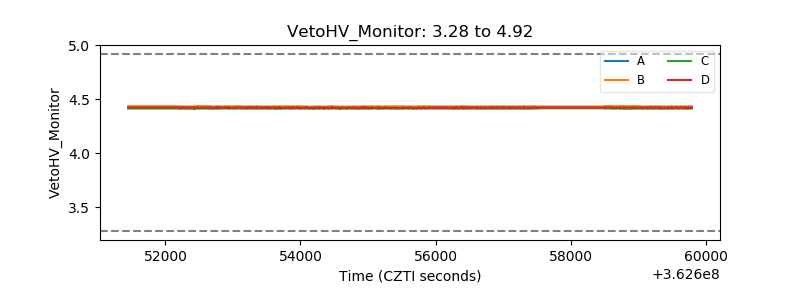 |
| Veto LLD |  |
| Alpha Counter | 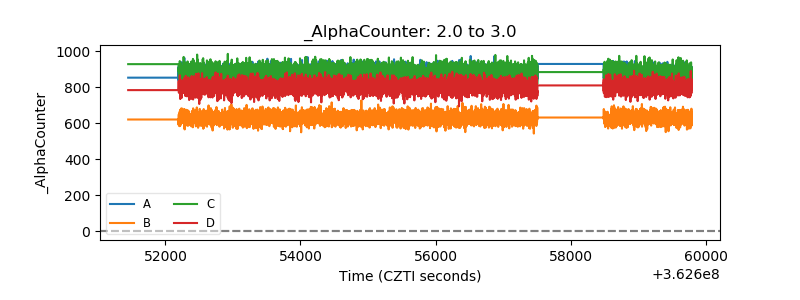 |
| _CPM_Rate | 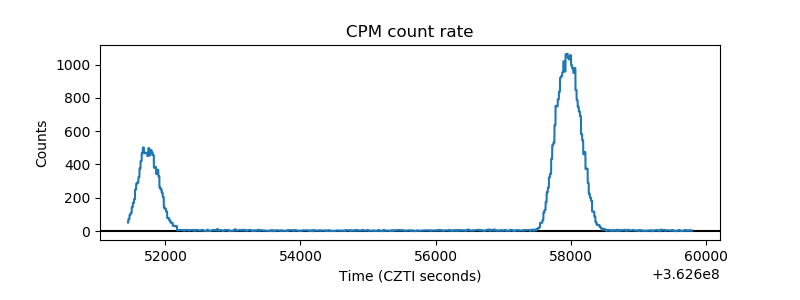 |
| CZT Counter | 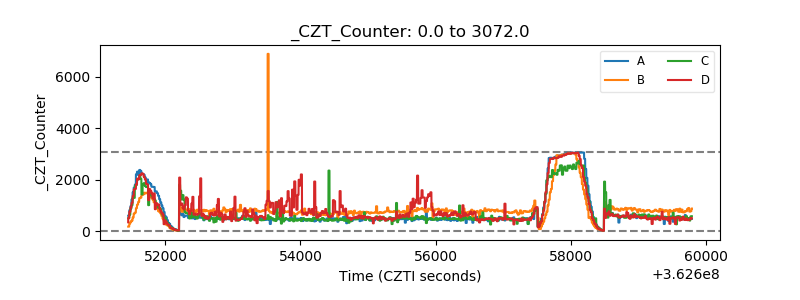 |
| +2.5 Volts monitor |  |
| +5 Volts monitor | 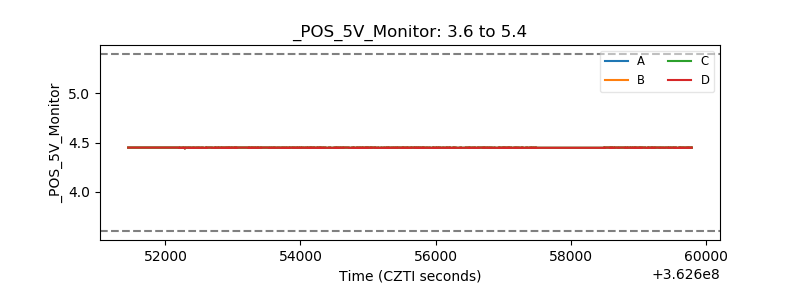 |
| _ROLL_ROT | 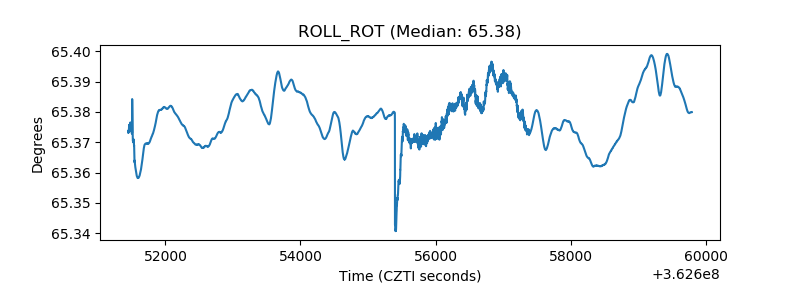 |
| _Roll_DEC | 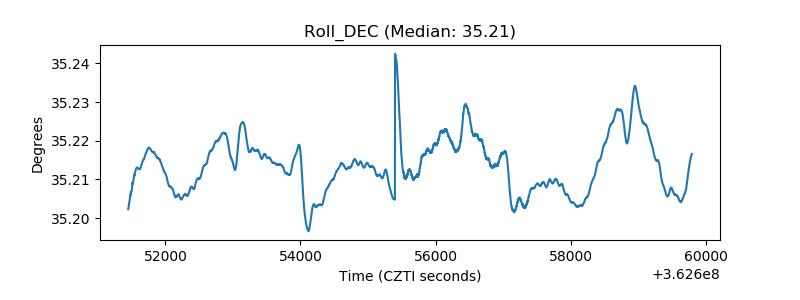 |
| _Roll_RA | 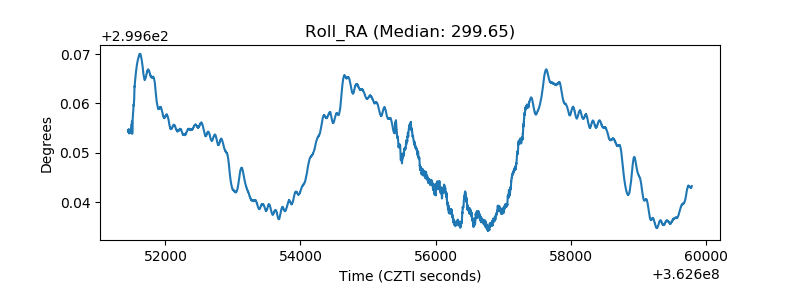 |
| Veto Counter | 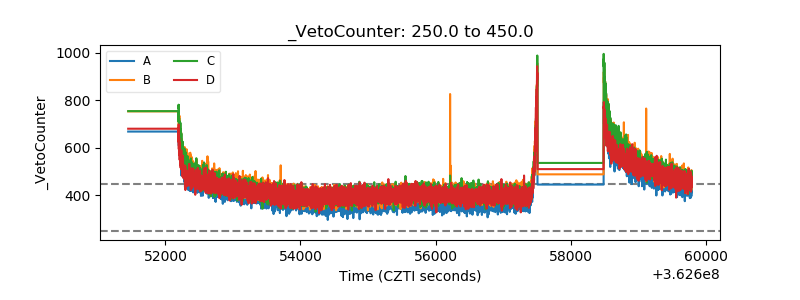 |