| Param | Original file | Final file |
|---|---|---|
| Filename | modeM0/AS1A10_109T01_9000004492_31105cztM0_level2.evt | modeM0/AS1A10_109T01_9000004492_31105cztM0_level2_quad_clean.evt |
| Size (bytes) | 439,692,480 | 53,591,040 |
| Size | 419.3 MB | 51.1 MB |
| Events in quadrant A | 2,917,037 | 332,637 |
| Events in quadrant B | 3,982,297 | 307,324 |
| Events in quadrant C | 3,023,606 | 323,938 |
| Events in quadrant D | 3,057,201 | 311,448 |
| Mode M0 | |||
|---|---|---|---|
| Quadrant | BADHDUFLAG | Total packets | Discarded packets |
| A | 0 | 14882 | 2912 |
| B | 0 | 19778 | 4772 |
| C | 0 | 15284 | 2960 |
| D | 0 | 15983 | 3316 |
| Mode SS | |||
|---|---|---|---|
| Quadrant | BADHDUFLAG | Total packets | Discarded packets |
| A | 0 | 132 | 20 |
| B | 0 | 132 | 24 |
| C | 0 | 132 | 22 |
| D | 0 | 132 | 16 |
| Mode M9 | |||
|---|---|---|---|
| Quadrant | BADHDUFLAG | Total packets | Discarded packets |
| A | 0 | 16 | 0 |
| B | 0 | 17 | 0 |
| C | 0 | 17 | 0 |
| D | 0 | 17 | 0 |
| Quadrant | Total seconds | Saturated seconds | Saturation percentage |
|---|---|---|---|
| A | 4938 | 123 | 2.490887% |
| B | 4799 | 178 | 3.709106% |
| C | 4978 | 187 | 3.756529% |
| D | 4910 | 90 | 1.832994% |
Noise dominated data is calculated using 1-second bins in cleaned event files. If a bin has >2000 counts, and if more than 50% of those come from <1% of pixels, then it is considered to be noise-dominated and hence unusable.
| Quadrant | # 1 sec bins | Bins with >0 counts | Bins with >2000 counts | High rate bins dominated by noise | Noise dominated (total time) | Noise dominated (detector-on time) | Marked lightcurve |
|---|---|---|---|---|---|---|---|
| A | 7617 | 5175 | 34 | 34 | 0.45% | 0.66% | 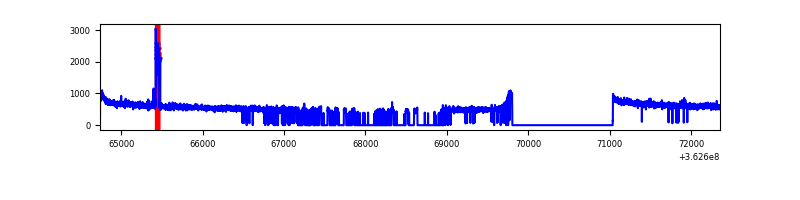 |
| B | 7616 | 5039 | 1 | 1 | 0.01% | 0.02% | 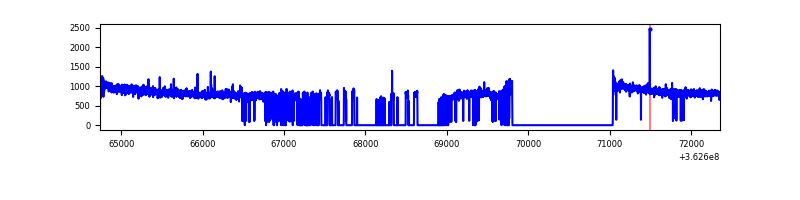 |
| C | 7616 | 5217 | 20 | 20 | 0.26% | 0.38% | 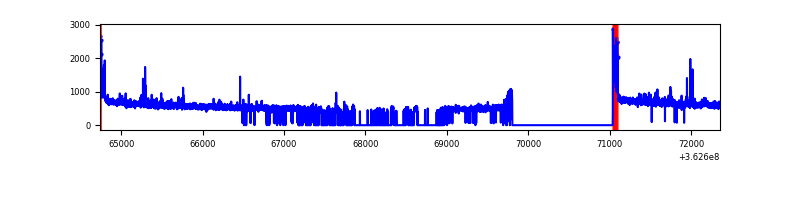 |
| D | 7616 | 5152 | 12 | 12 | 0.16% | 0.23% | 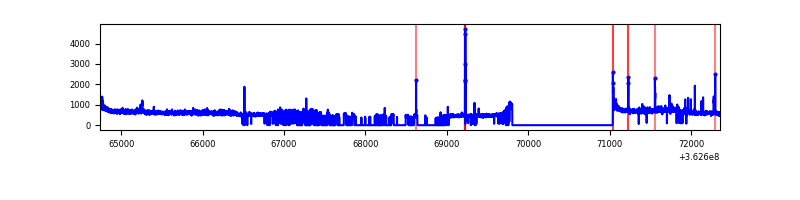 |
Top three noisy pixels from each quadrant. If the there are fewer than three noisy pixels in the level2.evt file, extra rows are filled as -1
| Pixel properties | Quadrant properties | ||||||
|---|---|---|---|---|---|---|---|
| Quadrant | DetID | PixID | Counts | Sigma | Mean | Median | Sigma |
| A | 13 | 170 | 83855 | 573.12 | 735 | 724 | 145.0 |
| A | 13 | 254 | 8852 | 56.04 | 735 | 724 | 145.0 |
| A | 3 | 137 | 6969 | 43.05 | 735 | 724 | 145.0 |
| B | 6 | 159 | 1208159 | 9158.44 | 696 | 681 | 131.8 |
| B | 0 | 183 | 22411 | 164.82 | 696 | 681 | 131.8 |
| B | 10 | 247 | 15935 | 115.7 | 696 | 681 | 131.8 |
| C | 0 | 10 | 156808 | 965.54 | 696 | 701 | 161.7 |
| C | 14 | 238 | 112603 | 692.12 | 696 | 701 | 161.7 |
| C | 10 | 22 | 18523 | 110.23 | 696 | 701 | 161.7 |
| D | 8 | 195 | 319801 | 1955.3 | 705 | 691 | 163.2 |
| D | 2 | 250 | 32763 | 196.52 | 705 | 691 | 163.2 |
| D | 13 | 174 | 23601 | 140.38 | 705 | 691 | 163.2 |
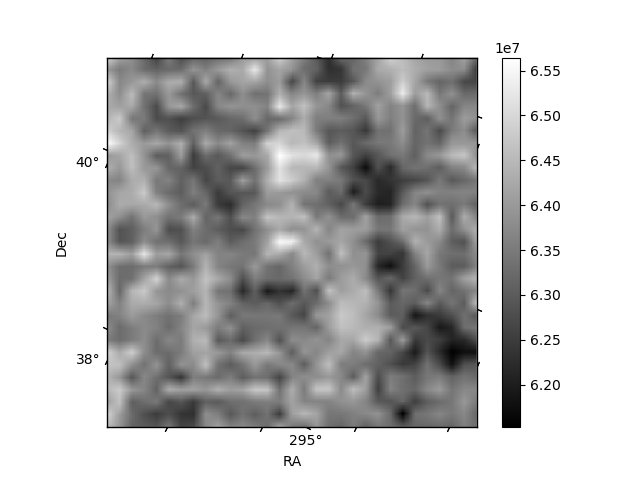
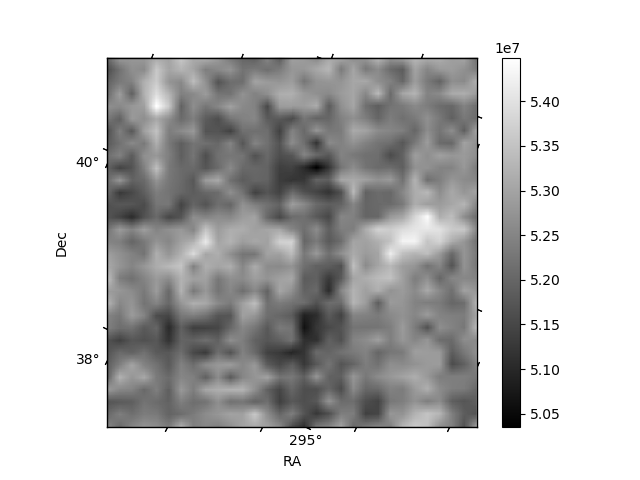
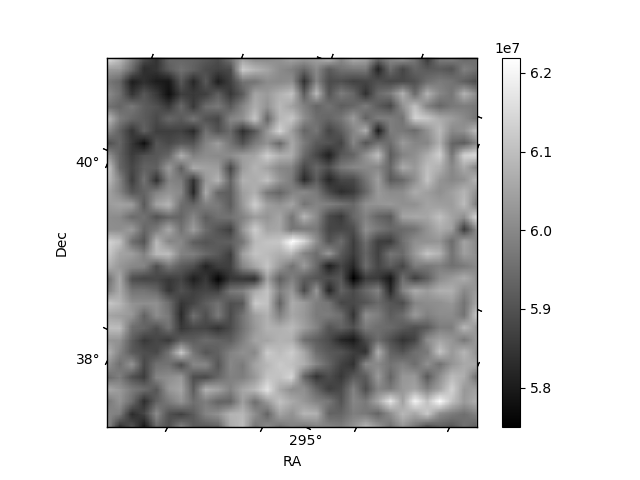
Histogram calculated using DETX and DETY for each event in the final _common_clean file
| Quadrant A | 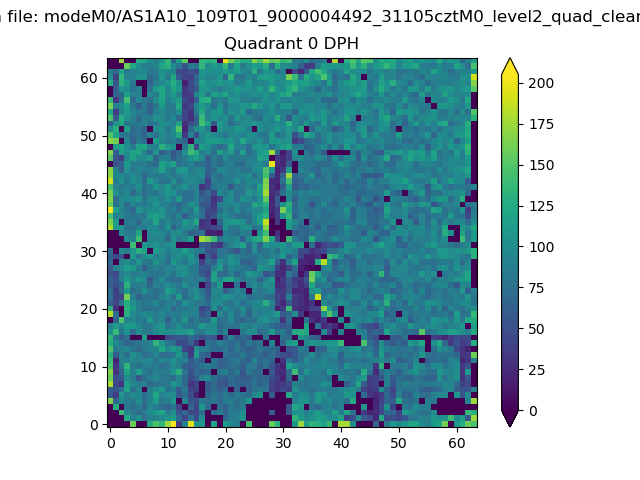 |
 |
Quadrant B |
|---|---|---|---|
| Quadrant D |  |
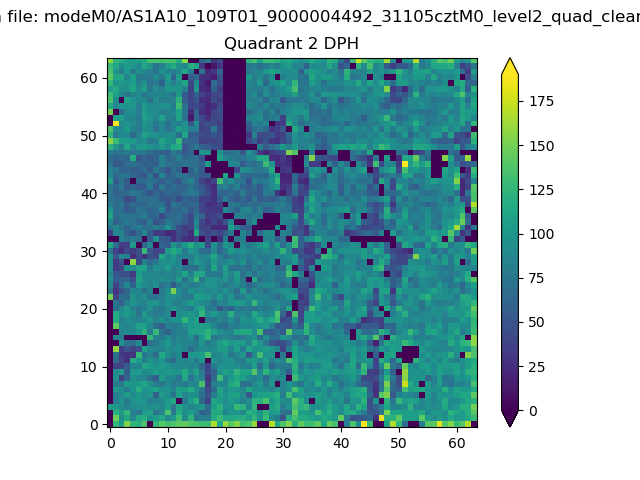 |
Quadrant C |
| Plot type | Count rate plots | Images |
|---|---|---|
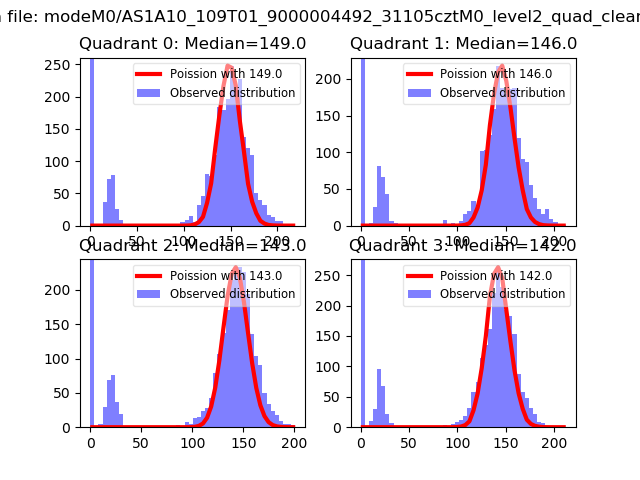
| Comparison with Poisson distribution Blue bars denote a histogram of data divided into 1 sec bins. Red curve is a Poisson curve with rate = median count rate of data. |
 |
 |
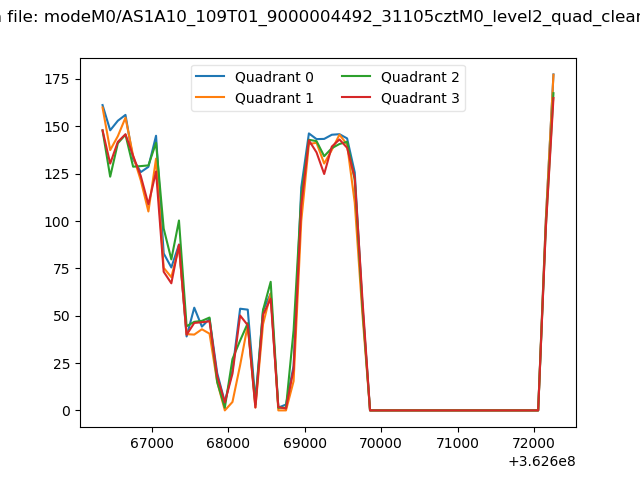
| Quadrant-wise count rates Data is divided into 100 sec bins |
 |
|
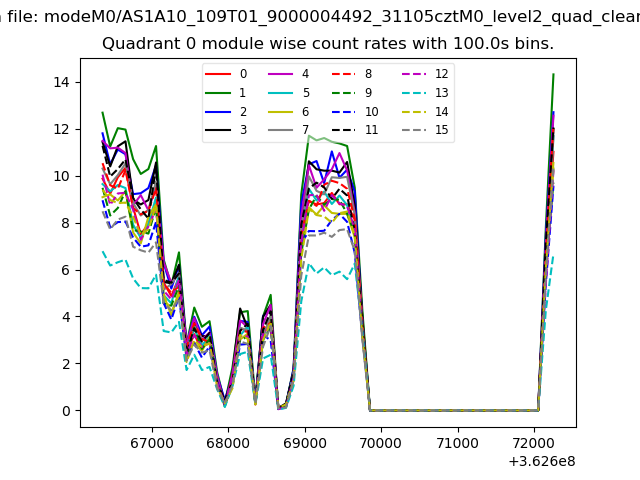
| Module-wise count rates for Quadrant A Data is divided into 100 sec bins |
 |
 |
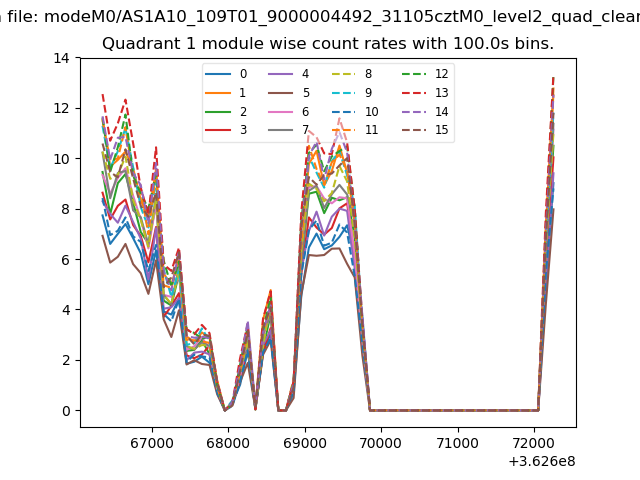
| Module-wise count rates for Quadrant B Data is divided into 100 sec bins |
 |
 |
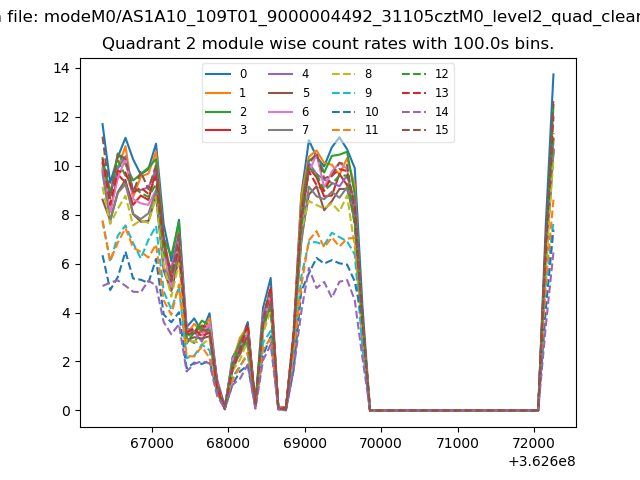
| Module-wise count rates for Quadrant C Data is divided into 100 sec bins |
 |
 |
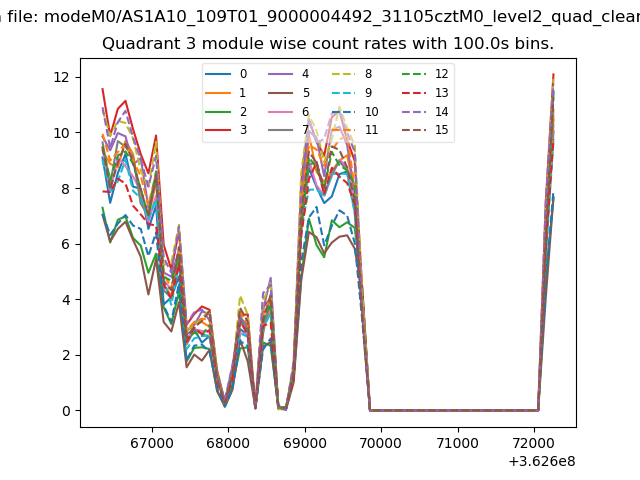
| Module-wise count rates for Quadrant D Data is divided into 100 sec bins |
 |
 |
| Parameter | Plot |
|---|---|
| CZT HV Monitor |  |
| D_VDD | 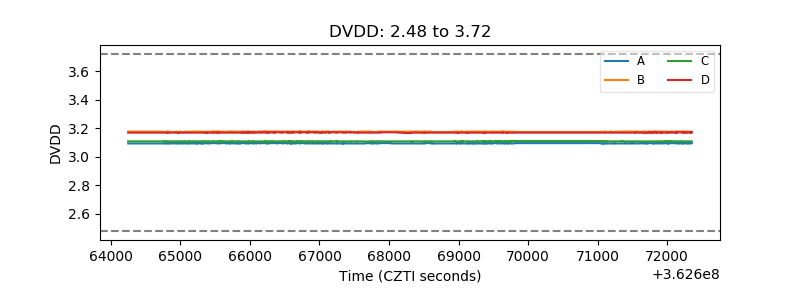 |
| Temperature 1 | 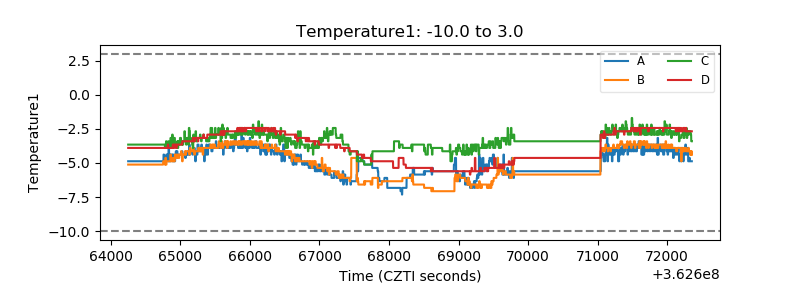 |
| Veto HV Monitor | 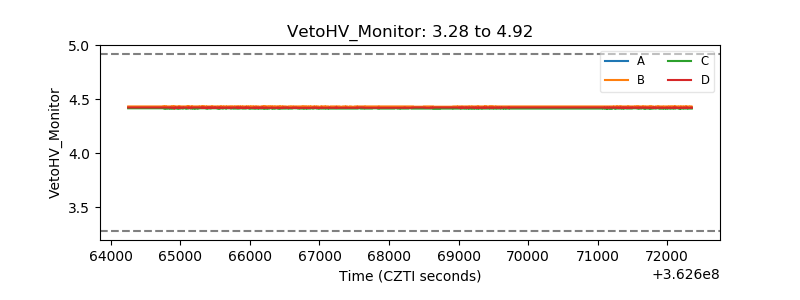 |
| Veto LLD | 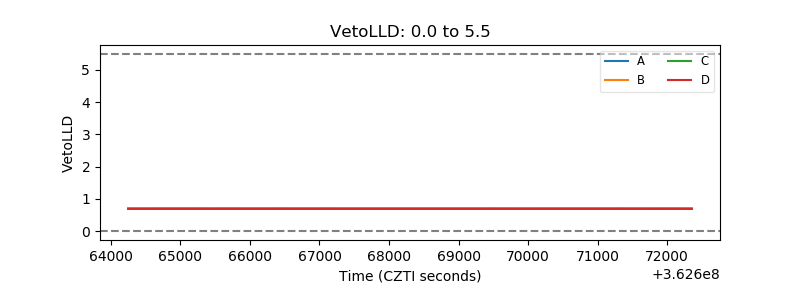 |
| Alpha Counter | 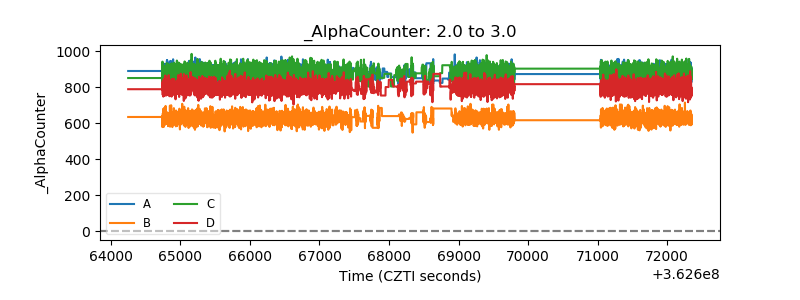 |
| _CPM_Rate | 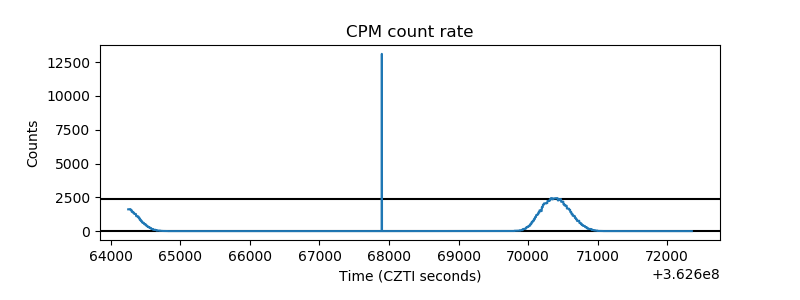 |
| CZT Counter | 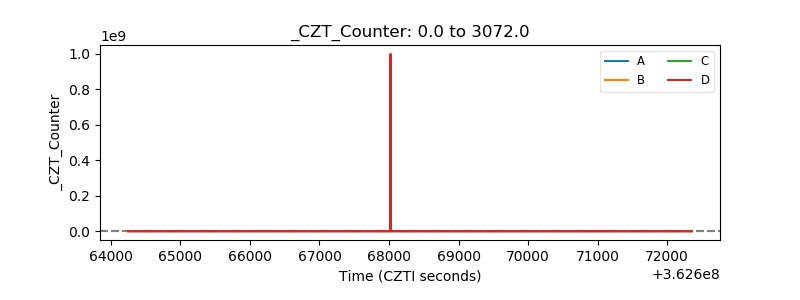 |
| +2.5 Volts monitor |  |
| +5 Volts monitor | 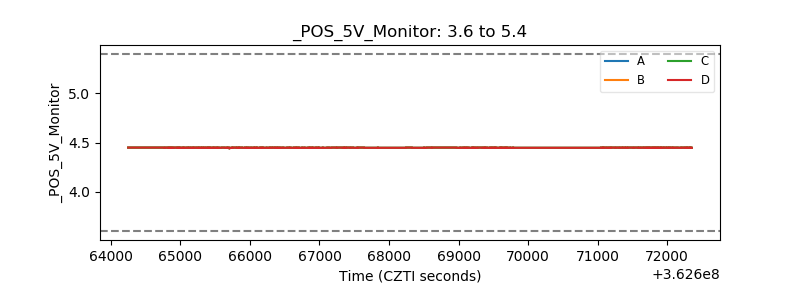 |
| _ROLL_ROT | 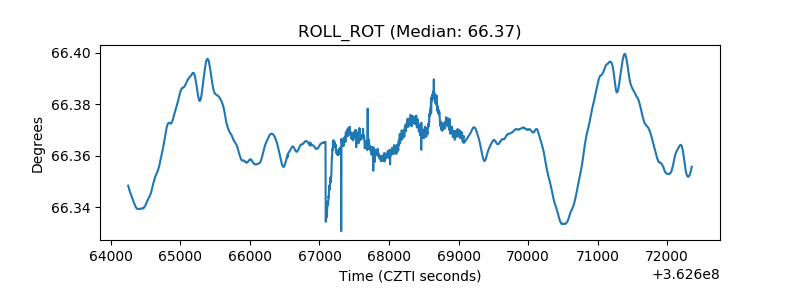 |
| _Roll_DEC | 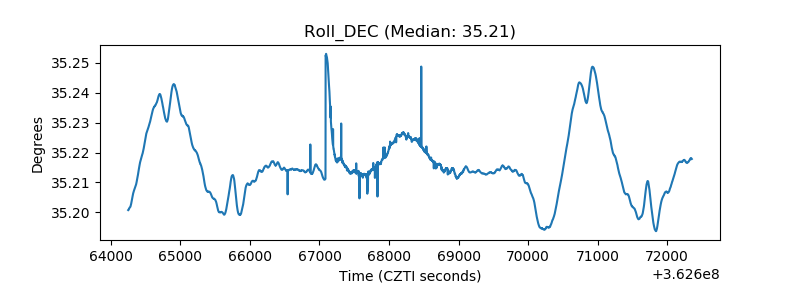 |
| _Roll_RA |  |
| Veto Counter | 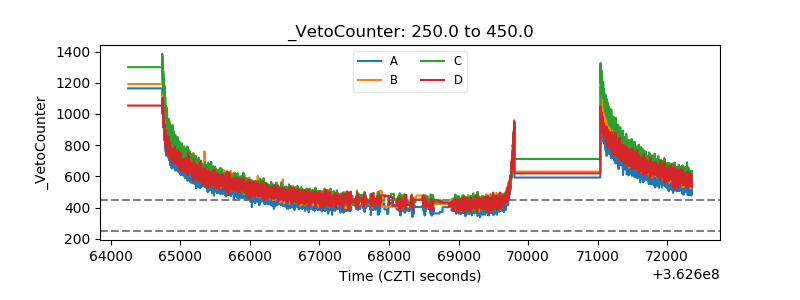 |