| Param | Original file | Final file |
|---|---|---|
| Filename | modeM0/AS1A10_109T01_9000004492_31106cztM0_level2.evt | modeM0/AS1A10_109T01_9000004492_31106cztM0_level2_quad_clean.evt |
| Size (bytes) | 599,653,440 | 111,502,080 |
| Size | 571.9 MB | 106.3 MB |
| Events in quadrant A | 3,766,418 | 745,889 |
| Events in quadrant B | 5,550,597 | 739,922 |
| Events in quadrant C | 4,105,658 | 720,489 |
| Events in quadrant D | 4,290,569 | 709,528 |
| Mode M0 | |||
|---|---|---|---|
| Quadrant | BADHDUFLAG | Total packets | Discarded packets |
| A | 0 | 15605 | 2 |
| B | 0 | 20641 | 2 |
| C | 0 | 16630 | 2 |
| D | 0 | 17264 | 2 |
| Mode SS | |||
|---|---|---|---|
| Quadrant | BADHDUFLAG | Total packets | Discarded packets |
| A | 0 | 136 | 0 |
| B | 0 | 136 | 0 |
| C | 0 | 136 | 0 |
| D | 0 | 136 | 0 |
| Mode M9 | |||
|---|---|---|---|
| Quadrant | BADHDUFLAG | Total packets | Discarded packets |
| A | 0 | 25 | 0 |
| B | 0 | 25 | 0 |
| C | 0 | 25 | 0 |
| D | 0 | 25 | 0 |
| Quadrant | Total seconds | Saturated seconds | Saturation percentage |
|---|---|---|---|
| A | 6616 | 128 | 1.934704% |
| B | 6616 | 236 | 3.567110% |
| C | 6616 | 316 | 4.776300% |
| D | 6616 | 133 | 2.010278% |
Noise dominated data is calculated using 1-second bins in cleaned event files. If a bin has >2000 counts, and if more than 50% of those come from <1% of pixels, then it is considered to be noise-dominated and hence unusable.
| Quadrant | # 1 sec bins | Bins with >0 counts | Bins with >2000 counts | High rate bins dominated by noise | Noise dominated (total time) | Noise dominated (detector-on time) | Marked lightcurve |
|---|---|---|---|---|---|---|---|
| A | 9176 | 6618 | 0 | 0 | 0.00% | 0.00% |  |
| B | 9176 | 6618 | 3 | 3 | 0.03% | 0.05% |  |
| C | 9176 | 6618 | 36 | 36 | 0.39% | 0.54% |  |
| D | 9176 | 6618 | 11 | 11 | 0.12% | 0.17% |  |
Top three noisy pixels from each quadrant. If the there are fewer than three noisy pixels in the level2.evt file, extra rows are filled as -1
| Pixel properties | Quadrant properties | ||||||
|---|---|---|---|---|---|---|---|
| Quadrant | DetID | PixID | Counts | Sigma | Mean | Median | Sigma |
| A | 13 | 254 | 11796 | 56.35 | 977 | 962 | 192.2 |
| A | 3 | 137 | 9059 | 42.12 | 977 | 962 | 192.2 |
| A | 0 | 226 | 8221 | 37.76 | 977 | 962 | 192.2 |
| B | 6 | 159 | 1754617 | 9946.04 | 955 | 936 | 176.3 |
| B | 10 | 247 | 22426 | 121.88 | 955 | 936 | 176.3 |
| B | 12 | 111 | 21024 | 113.93 | 955 | 936 | 176.3 |
| C | 0 | 10 | 245580 | 1128.87 | 938 | 951 | 216.7 |
| C | 14 | 238 | 153855 | 705.59 | 938 | 951 | 216.7 |
| C | 2 | 114 | 15456 | 66.93 | 938 | 951 | 216.7 |
| D | 8 | 195 | 496544 | 2227.07 | 955 | 936 | 222.5 |
| D | 13 | 174 | 129750 | 578.84 | 955 | 936 | 222.5 |
| D | 2 | 250 | 35707 | 156.24 | 955 | 936 | 222.5 |
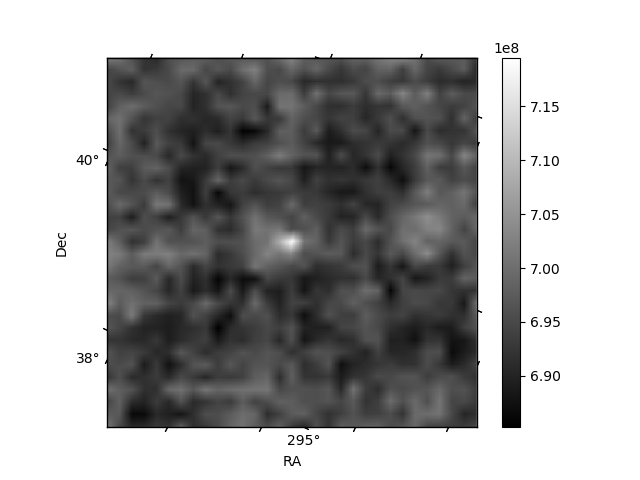
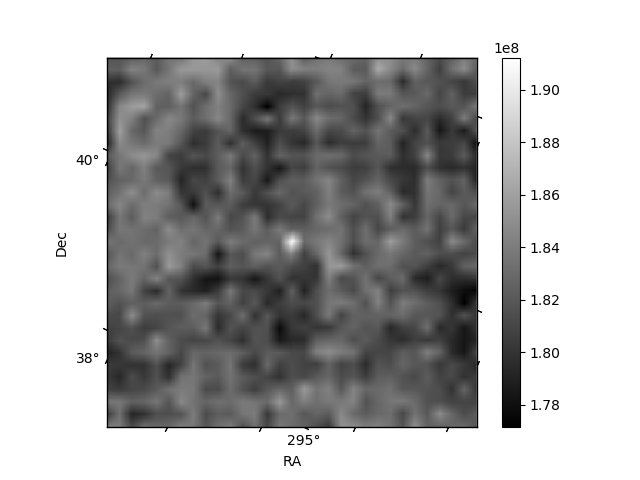
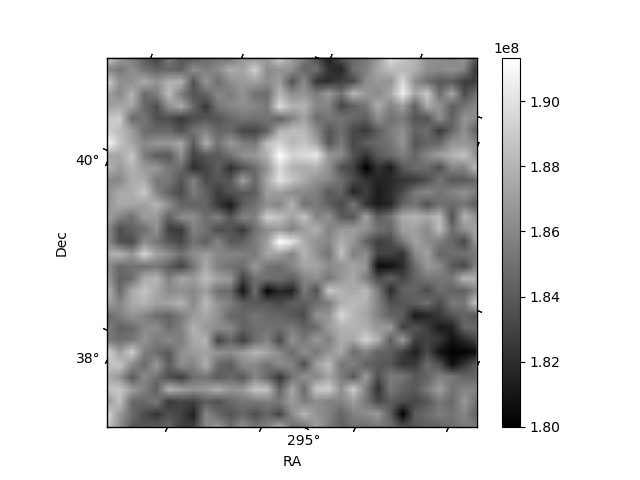
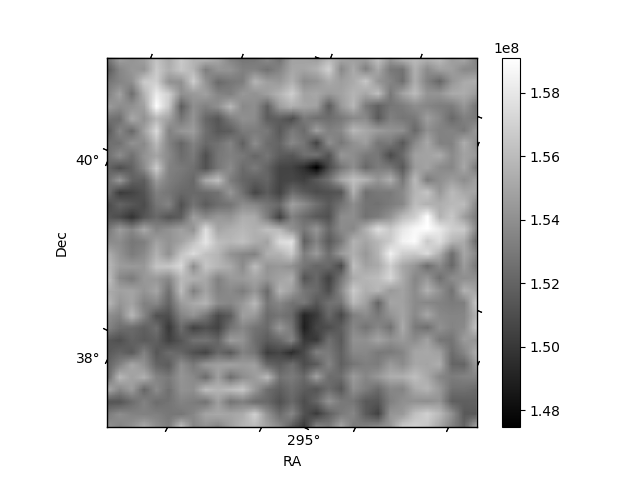
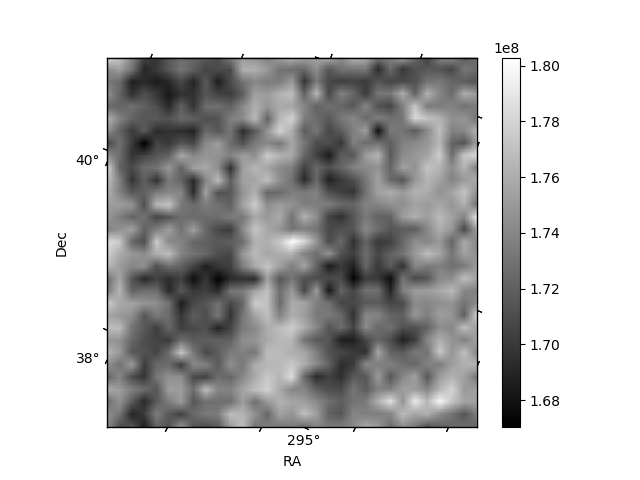
Histogram calculated using DETX and DETY for each event in the final _common_clean file
| Quadrant A | 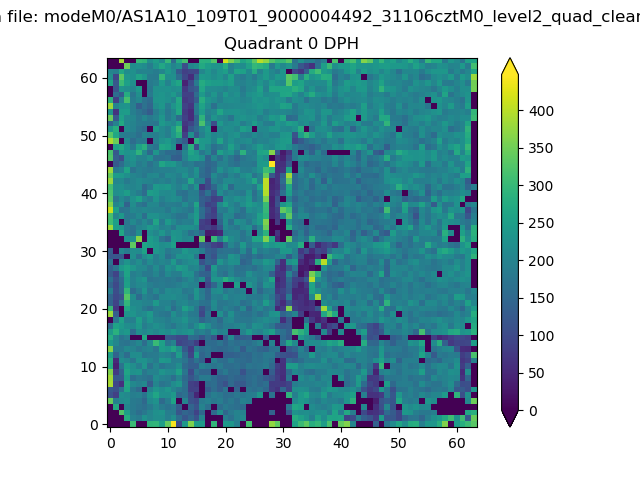 |
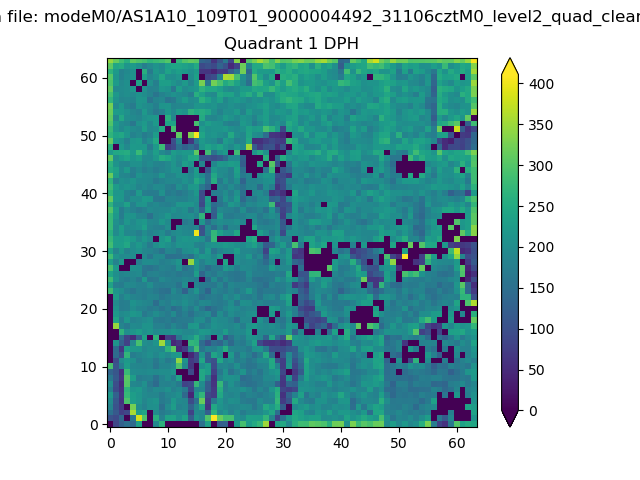 |
Quadrant B |
|---|---|---|---|
| Quadrant D | 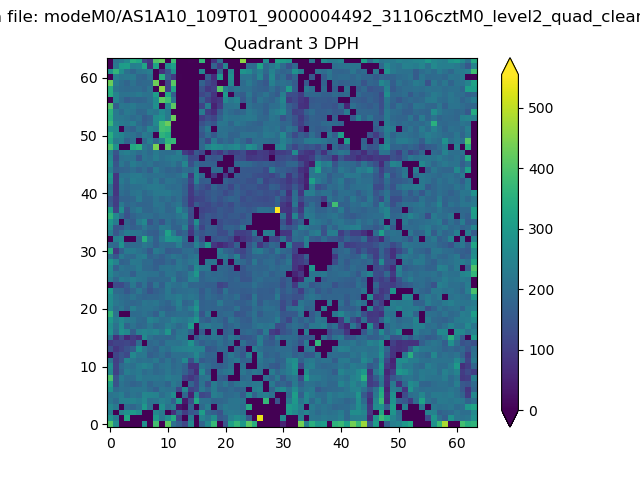 |
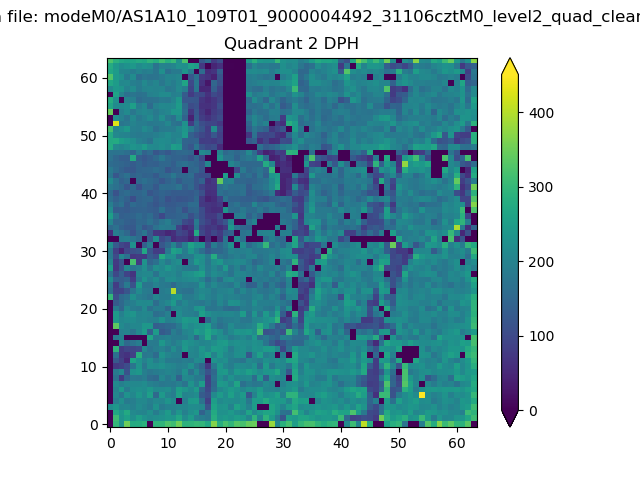 |
Quadrant C |
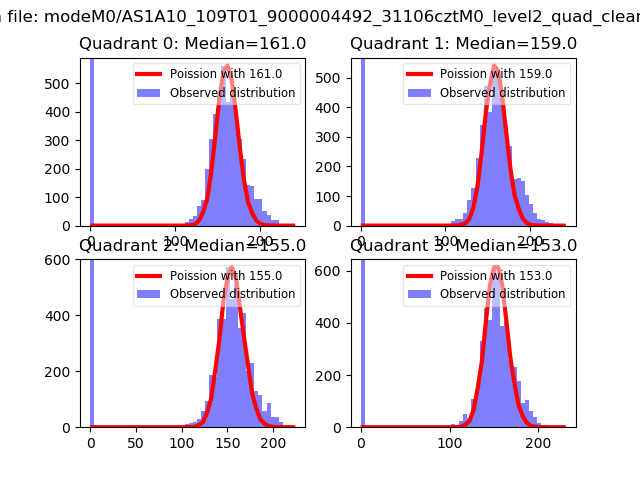
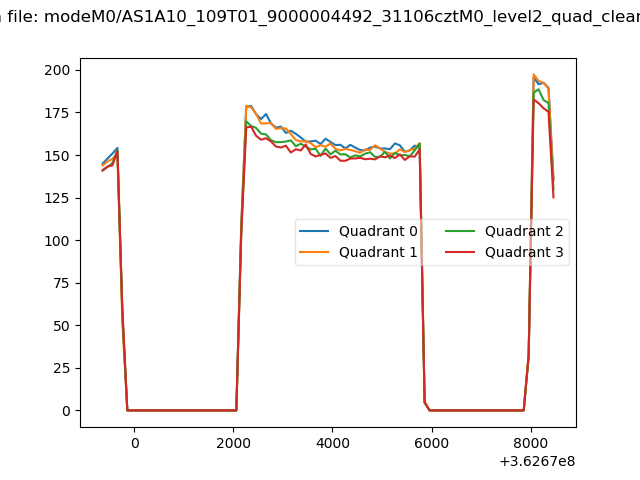
| Plot type | Count rate plots | Images |
|---|---|---|
| Comparison with Poisson distribution Blue bars denote a histogram of data divided into 1 sec bins. Red curve is a Poisson curve with rate = median count rate of data. |
 |
 |
| Quadrant-wise count rates Data is divided into 100 sec bins |
 |
|
| Module-wise count rates for Quadrant A Data is divided into 100 sec bins |
 |
 |
| Module-wise count rates for Quadrant B Data is divided into 100 sec bins |
 |
 |
| Module-wise count rates for Quadrant C Data is divided into 100 sec bins |
 |
 |
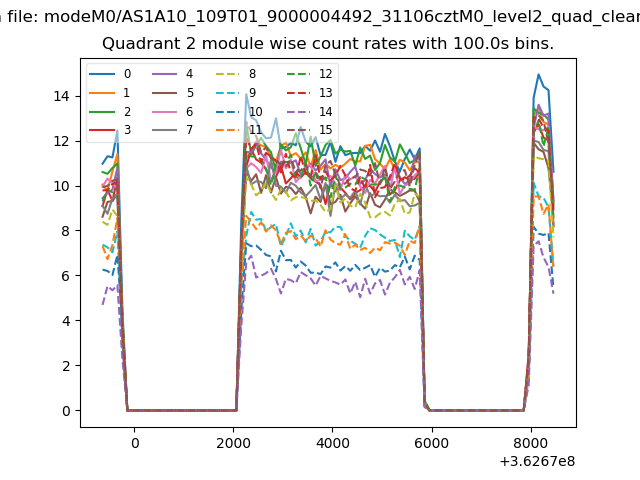
| Module-wise count rates for Quadrant D Data is divided into 100 sec bins |
 |
 |
| Parameter | Plot |
|---|---|
| CZT HV Monitor | 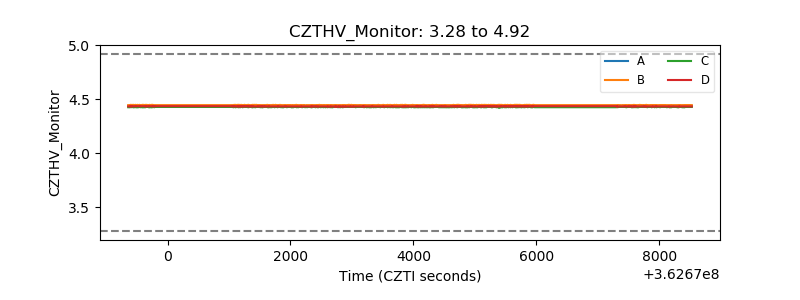 |
| D_VDD |  |
| Temperature 1 |  |
| Veto HV Monitor | 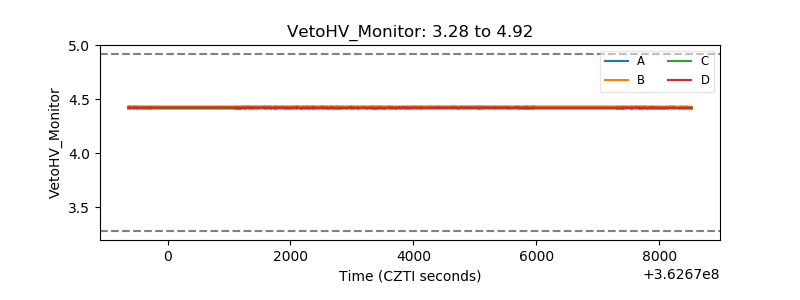 |
| Veto LLD |  |
| Alpha Counter | 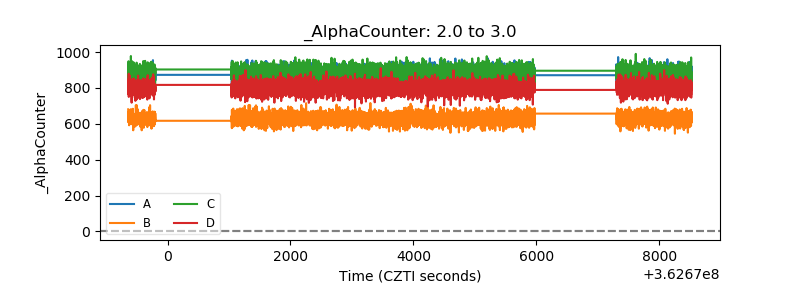 |
| _CPM_Rate | 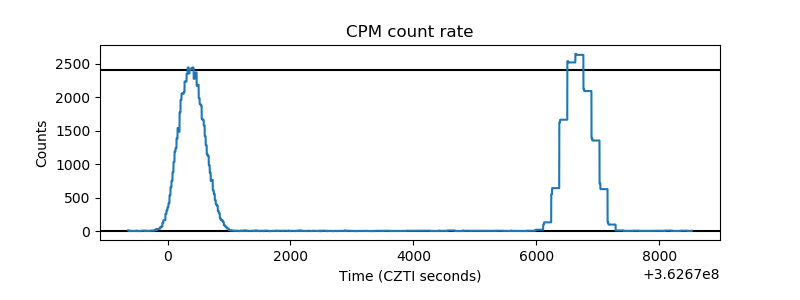 |
| CZT Counter | 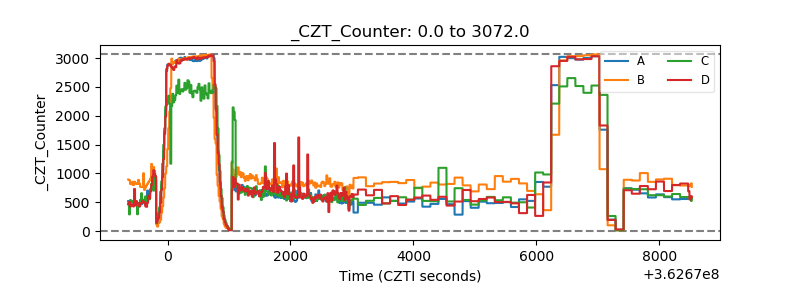 |
| +2.5 Volts monitor |  |
| +5 Volts monitor | 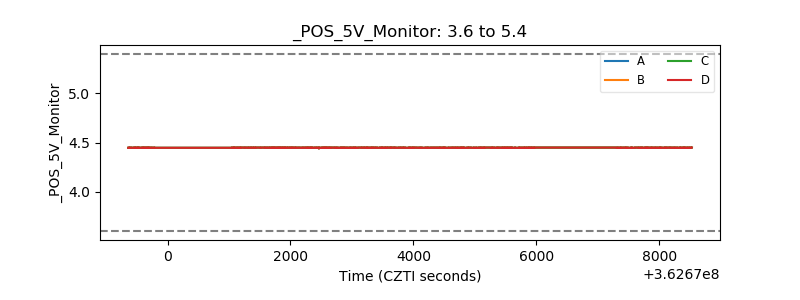 |
| _ROLL_ROT | 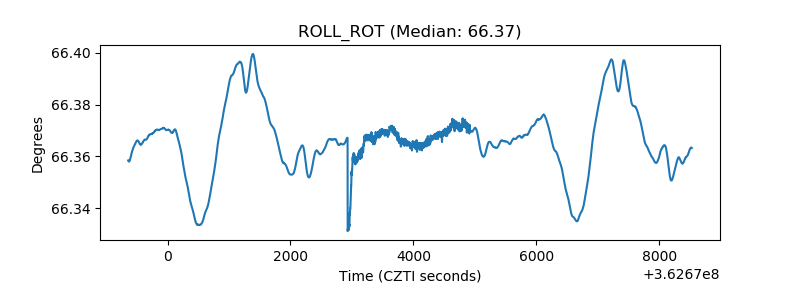 |
| _Roll_DEC | 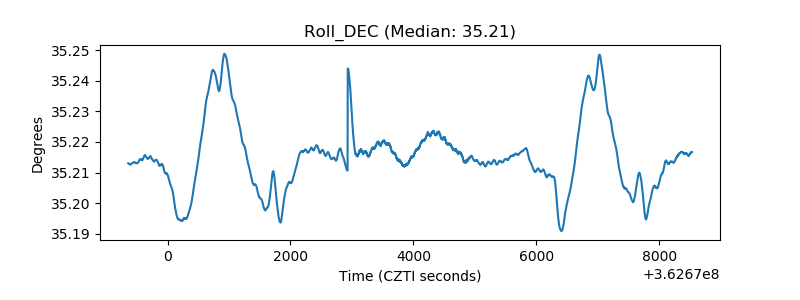 |
| _Roll_RA | 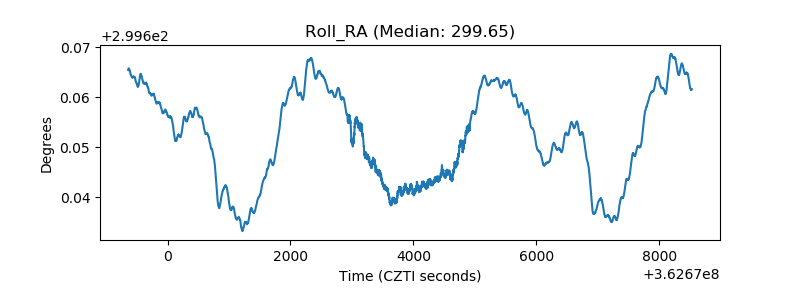 |
| Veto Counter | 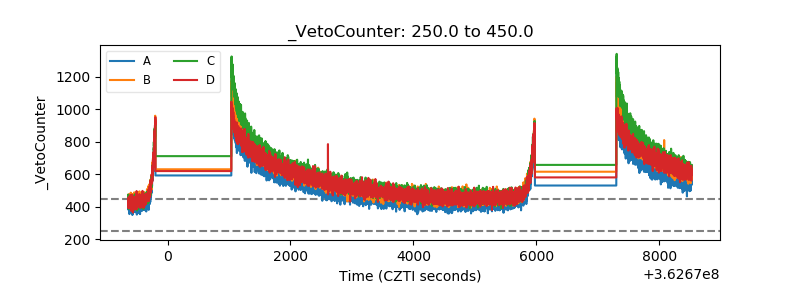 |