| Param | Original file | Final file |
|---|---|---|
| Filename | modeM0/AS1A10_109T01_9000004492_31107cztM0_level2.evt | modeM0/AS1A10_109T01_9000004492_31107cztM0_level2_quad_clean.evt |
| Size (bytes) | 602,628,480 | 120,836,160 |
| Size | 574.7 MB | 115.2 MB |
| Events in quadrant A | 3,680,939 | 815,581 |
| Events in quadrant B | 5,470,152 | 818,679 |
| Events in quadrant C | 4,071,747 | 796,724 |
| Events in quadrant D | 4,590,402 | 777,758 |
| Mode M0 | |||
|---|---|---|---|
| Quadrant | BADHDUFLAG | Total packets | Discarded packets |
| A | 0 | 15236 | 3 |
| B | 0 | 20196 | 3 |
| C | 0 | 16527 | 3 |
| D | 0 | 18262 | 3 |
| Mode SS | |||
|---|---|---|---|
| Quadrant | BADHDUFLAG | Total packets | Discarded packets |
| A | 0 | 134 | 0 |
| B | 0 | 134 | 0 |
| C | 0 | 136 | 0 |
| D | 0 | 136 | 0 |
| Mode M9 | |||
|---|---|---|---|
| Quadrant | BADHDUFLAG | Total packets | Discarded packets |
| A | 0 | 26 | 0 |
| B | 0 | 26 | 0 |
| C | 0 | 26 | 0 |
| D | 0 | 26 | 0 |
| Quadrant | Total seconds | Saturated seconds | Saturation percentage |
|---|---|---|---|
| A | 6463 | 149 | 2.305431% |
| B | 6463 | 266 | 4.115736% |
| C | 6463 | 361 | 5.585641% |
| D | 6464 | 174 | 2.691832% |
Noise dominated data is calculated using 1-second bins in cleaned event files. If a bin has >2000 counts, and if more than 50% of those come from <1% of pixels, then it is considered to be noise-dominated and hence unusable.
| Quadrant | # 1 sec bins | Bins with >0 counts | Bins with >2000 counts | High rate bins dominated by noise | Noise dominated (total time) | Noise dominated (detector-on time) | Marked lightcurve |
|---|---|---|---|---|---|---|---|
| A | 9158 | 6466 | 0 | 0 | 0.00% | 0.00% | 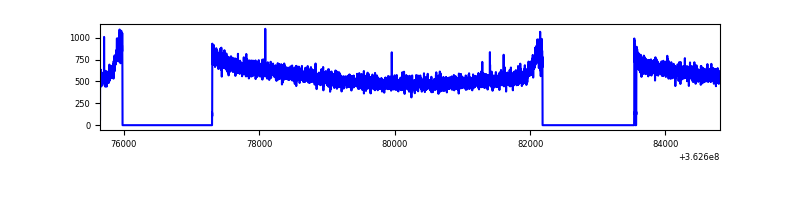 |
| B | 9158 | 6466 | 2 | 2 | 0.02% | 0.03% | 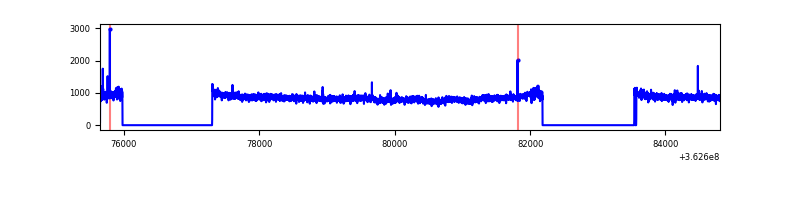 |
| C | 9158 | 6466 | 43 | 43 | 0.47% | 0.67% | 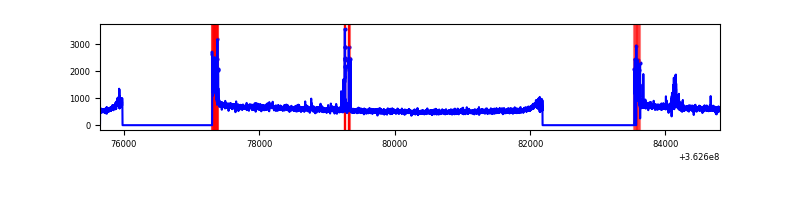 |
| D | 9159 | 6467 | 32 | 32 | 0.35% | 0.49% | 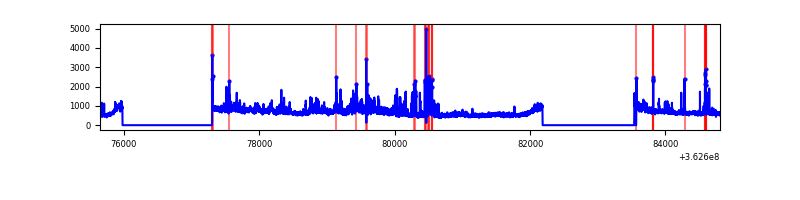 |
Top three noisy pixels from each quadrant. If the there are fewer than three noisy pixels in the level2.evt file, extra rows are filled as -1
| Pixel properties | Quadrant properties | ||||||
|---|---|---|---|---|---|---|---|
| Quadrant | DetID | PixID | Counts | Sigma | Mean | Median | Sigma |
| A | 13 | 254 | 12172 | 59.76 | 954 | 938 | 188.0 |
| A | 3 | 137 | 8723 | 41.41 | 954 | 938 | 188.0 |
| A | 0 | 226 | 8111 | 38.16 | 954 | 938 | 188.0 |
| B | 6 | 159 | 1737652 | 9957.55 | 938 | 918 | 174.4 |
| B | 12 | 111 | 20776 | 113.86 | 938 | 918 | 174.4 |
| B | 11 | 111 | 18990 | 103.62 | 938 | 918 | 174.4 |
| C | 0 | 10 | 164951 | 770.34 | 926 | 938 | 212.9 |
| C | 14 | 238 | 150623 | 703.04 | 926 | 938 | 212.9 |
| C | 10 | 22 | 125273 | 583.98 | 926 | 938 | 212.9 |
| D | 8 | 195 | 495149 | 2266.01 | 939 | 922 | 218.1 |
| D | 13 | 174 | 437884 | 2003.45 | 939 | 922 | 218.1 |
| D | 2 | 250 | 83661 | 379.35 | 939 | 922 | 218.1 |
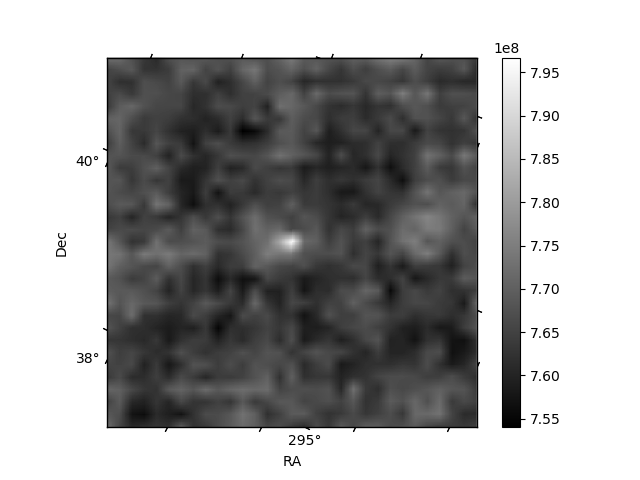
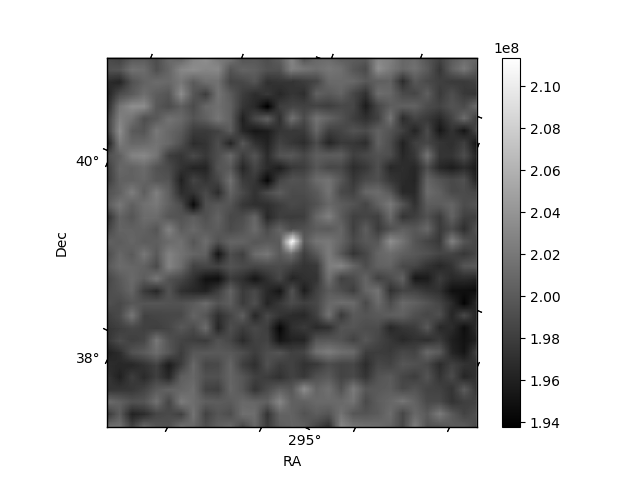
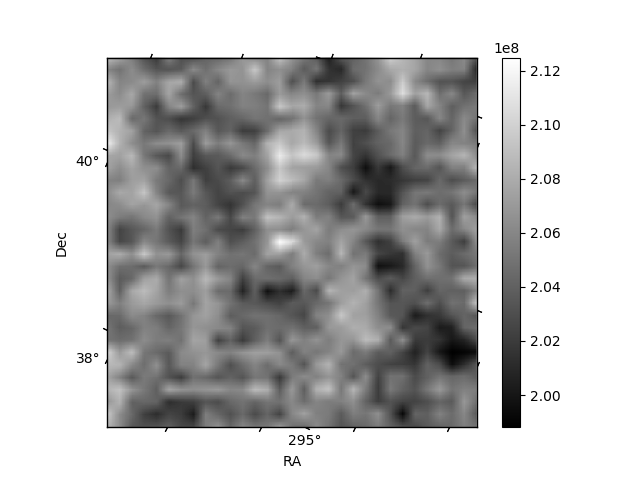
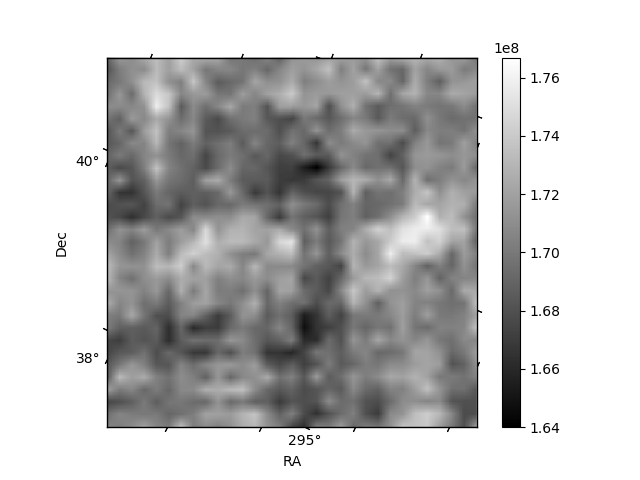
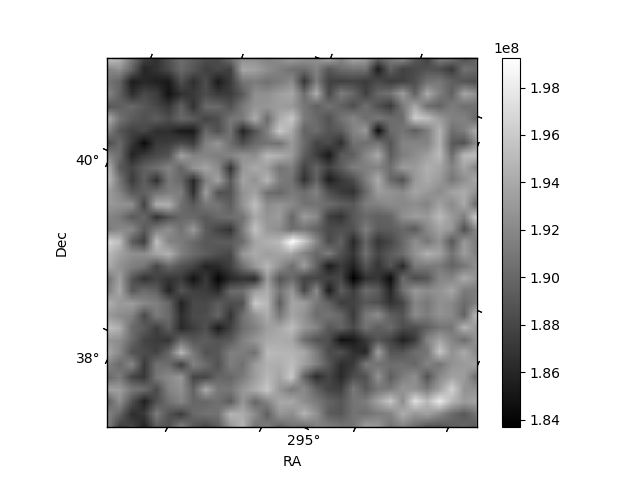
Histogram calculated using DETX and DETY for each event in the final _common_clean file
| Quadrant A | 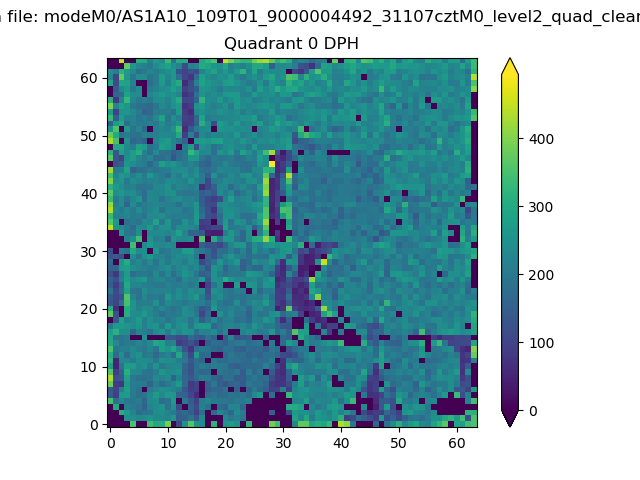 |
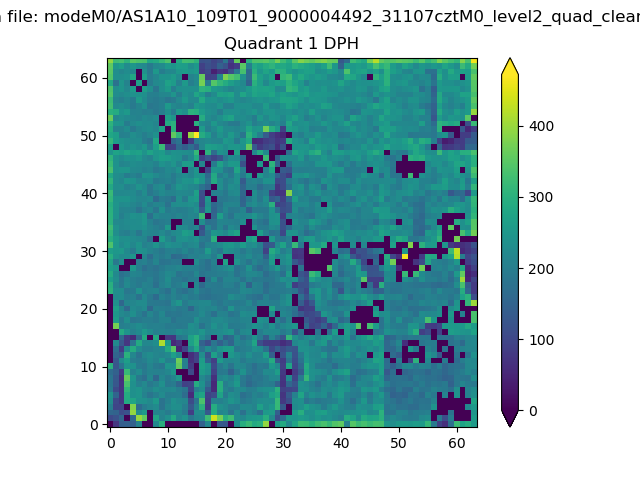 |
Quadrant B |
|---|---|---|---|
| Quadrant D | 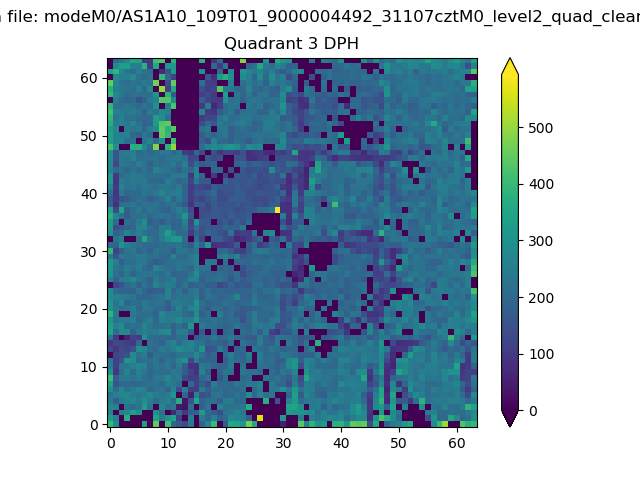 |
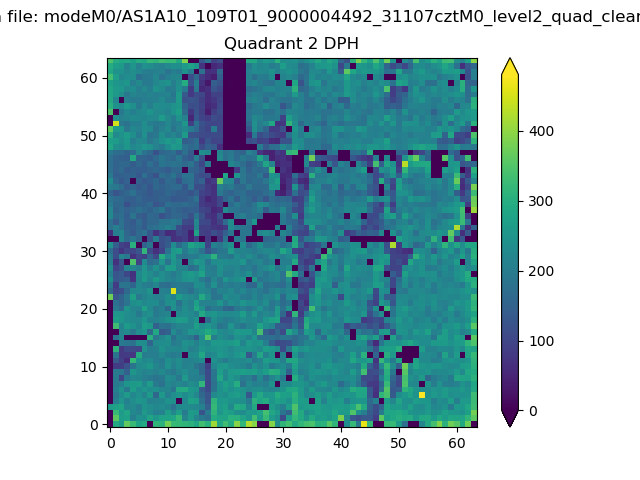 |
Quadrant C |
| Plot type | Count rate plots | Images |
|---|---|---|
| Comparison with Poisson distribution Blue bars denote a histogram of data divided into 1 sec bins. Red curve is a Poisson curve with rate = median count rate of data. |
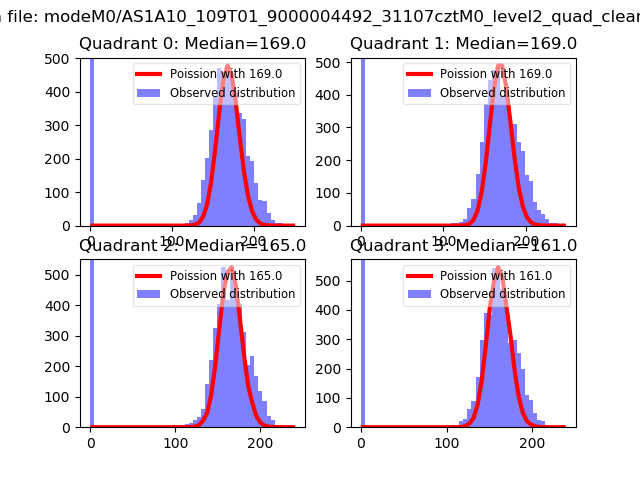 |
 |
| Quadrant-wise count rates Data is divided into 100 sec bins |
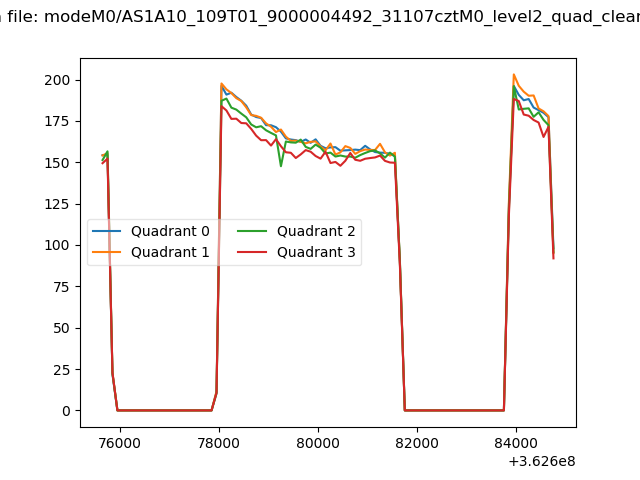 |
|
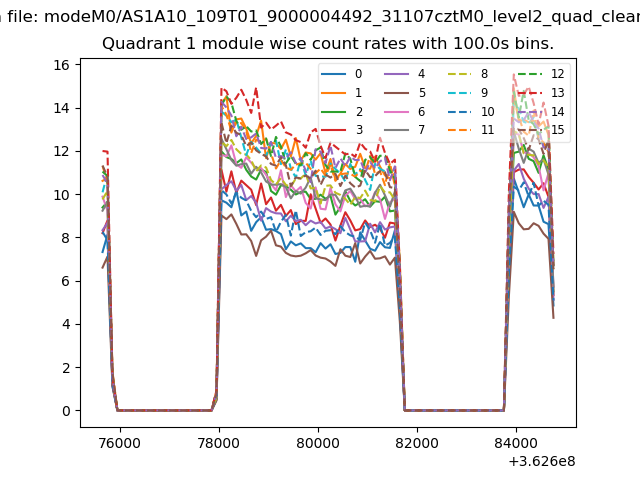
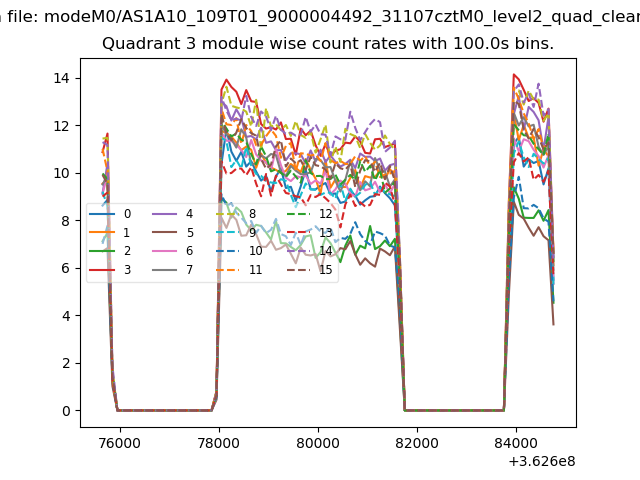
| Module-wise count rates for Quadrant A Data is divided into 100 sec bins |
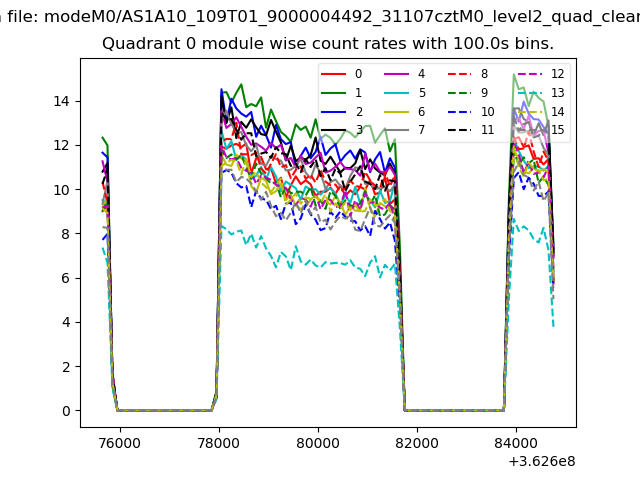 |
 |
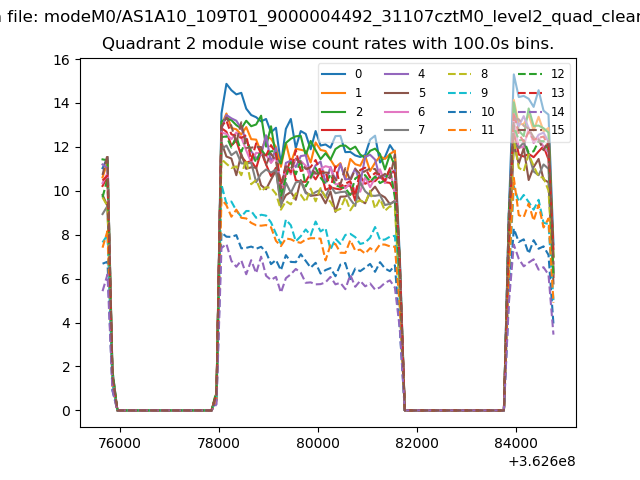
| Module-wise count rates for Quadrant B Data is divided into 100 sec bins |
 |
 |
| Module-wise count rates for Quadrant C Data is divided into 100 sec bins |
 |
 |
| Module-wise count rates for Quadrant D Data is divided into 100 sec bins |
 |
 |
| Parameter | Plot |
|---|---|
| CZT HV Monitor | 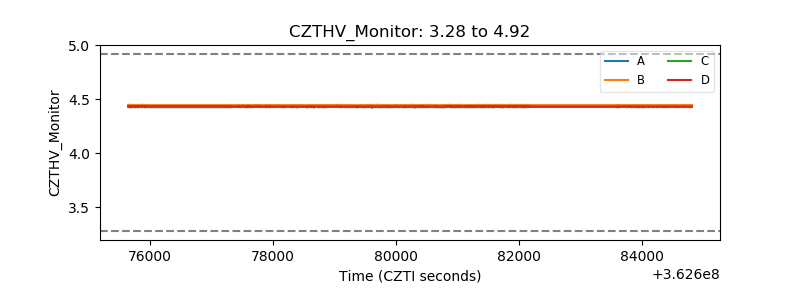 |
| D_VDD |  |
| Temperature 1 |  |
| Veto HV Monitor | 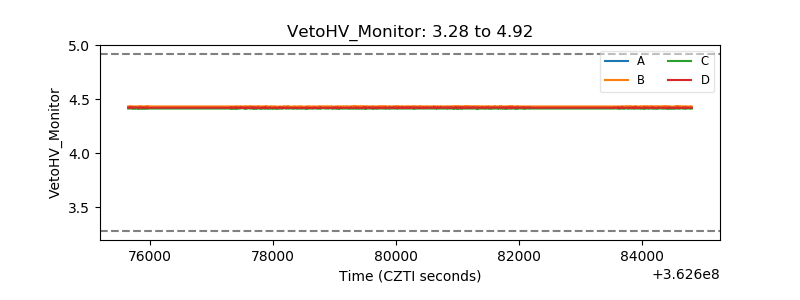 |
| Veto LLD |  |
| Alpha Counter |  |
| _CPM_Rate | 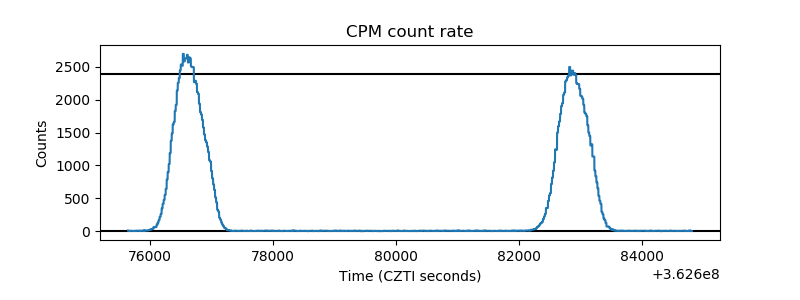 |
| CZT Counter | 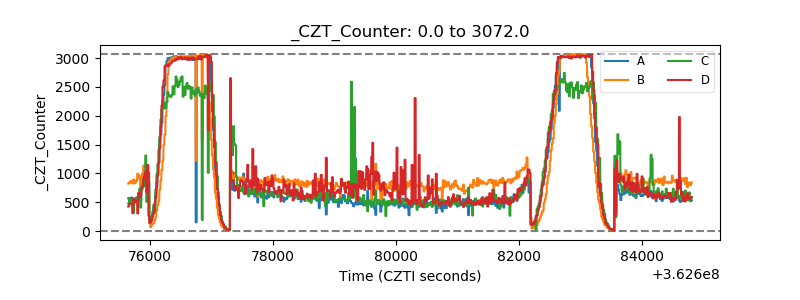 |
| +2.5 Volts monitor |  |
| +5 Volts monitor | 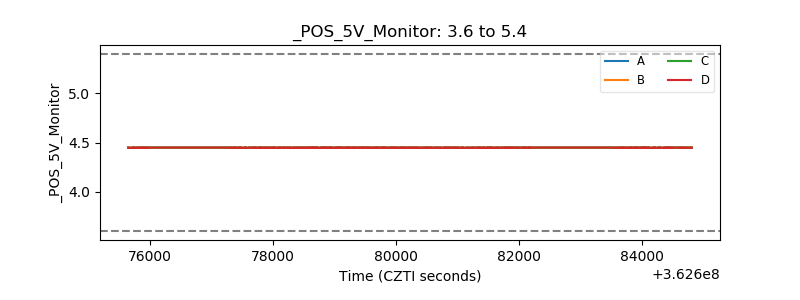 |
| _ROLL_ROT | 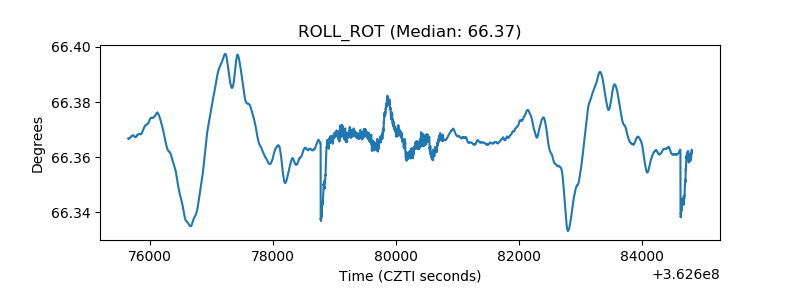 |
| _Roll_DEC | 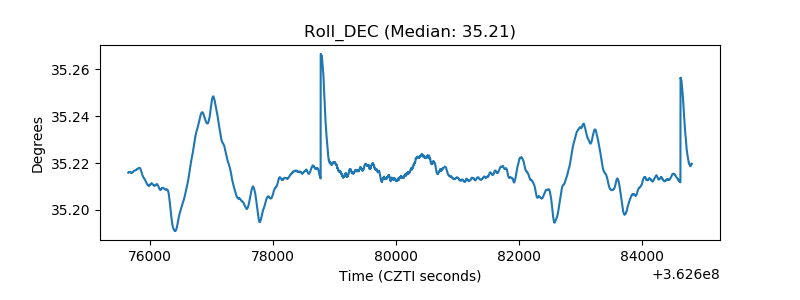 |
| _Roll_RA | 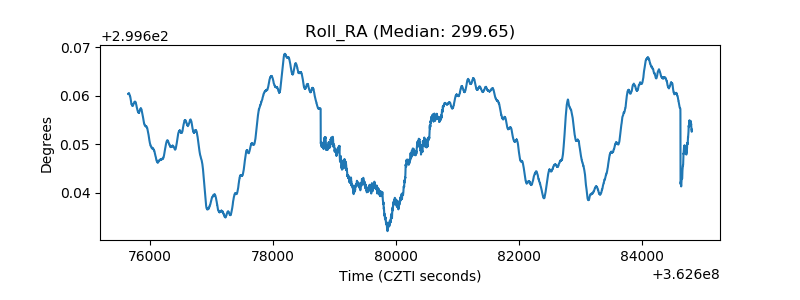 |
| Veto Counter | 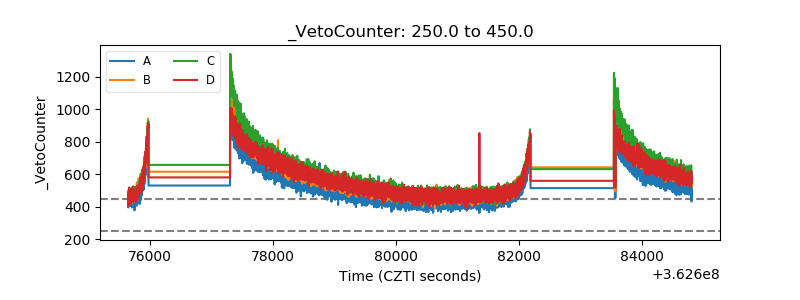 |