| Param | Original file | Final file |
|---|---|---|
| Filename | modeM0/AS1A10_109T01_9000004492_31108cztM0_level2.evt | modeM0/AS1A10_109T01_9000004492_31108cztM0_level2_quad_clean.evt |
| Size (bytes) | 590,405,760 | 123,935,040 |
| Size | 563.1 MB | 118.2 MB |
| Events in quadrant A | 3,633,130 | 836,242 |
| Events in quadrant B | 5,534,738 | 838,471 |
| Events in quadrant C | 4,012,291 | 821,169 |
| Events in quadrant D | 4,249,480 | 793,369 |
| Mode M0 | |||
|---|---|---|---|
| Quadrant | BADHDUFLAG | Total packets | Discarded packets |
| A | 0 | 14996 | 3 |
| B | 0 | 20637 | 3 |
| C | 0 | 16272 | 3 |
| D | 0 | 17257 | 3 |
| Mode SS | |||
|---|---|---|---|
| Quadrant | BADHDUFLAG | Total packets | Discarded packets |
| A | 0 | 138 | 0 |
| B | 0 | 138 | 0 |
| C | 0 | 138 | 0 |
| D | 0 | 138 | 0 |
| Mode M9 | |||
|---|---|---|---|
| Quadrant | BADHDUFLAG | Total packets | Discarded packets |
| A | 0 | 27 | 0 |
| B | 0 | 27 | 0 |
| C | 0 | 27 | 0 |
| D | 0 | 27 | 0 |
| Quadrant | Total seconds | Saturated seconds | Saturation percentage |
|---|---|---|---|
| A | 6661 | 122 | 1.831557% |
| B | 6661 | 259 | 3.888305% |
| C | 6661 | 284 | 4.263624% |
| D | 6662 | 157 | 2.356650% |
Noise dominated data is calculated using 1-second bins in cleaned event files. If a bin has >2000 counts, and if more than 50% of those come from <1% of pixels, then it is considered to be noise-dominated and hence unusable.
| Quadrant | # 1 sec bins | Bins with >0 counts | Bins with >2000 counts | High rate bins dominated by noise | Noise dominated (total time) | Noise dominated (detector-on time) | Marked lightcurve |
|---|---|---|---|---|---|---|---|
| A | 9366 | 6664 | 0 | 0 | 0.00% | 0.00% | 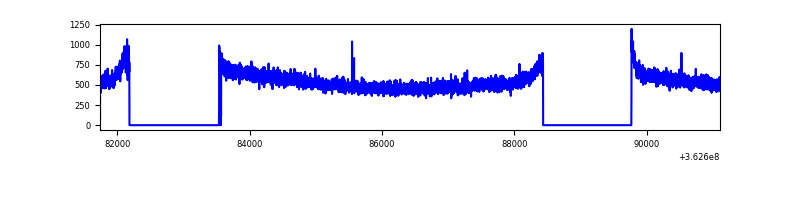 |
| B | 9366 | 6664 | 2 | 2 | 0.02% | 0.03% | 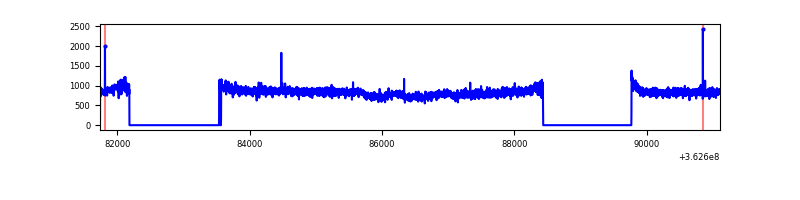 |
| C | 9366 | 6664 | 15 | 15 | 0.16% | 0.23% | 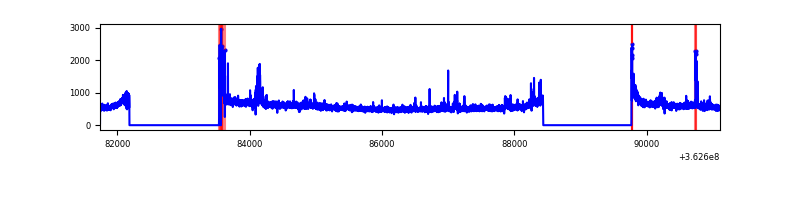 |
| D | 9367 | 6665 | 50 | 50 | 0.53% | 0.75% | 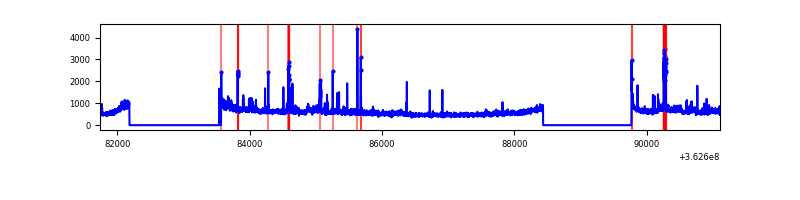 |
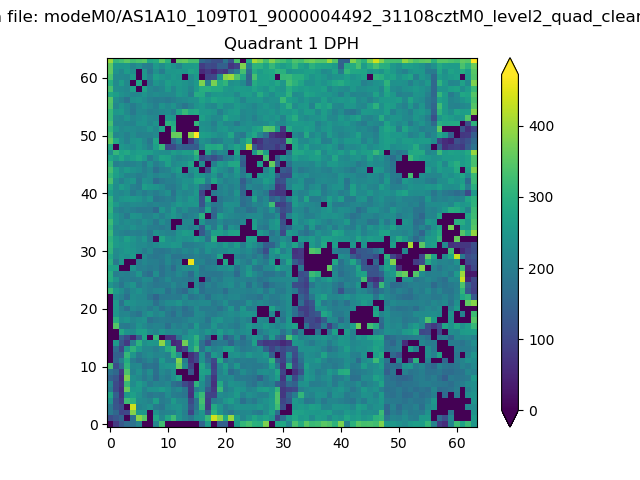
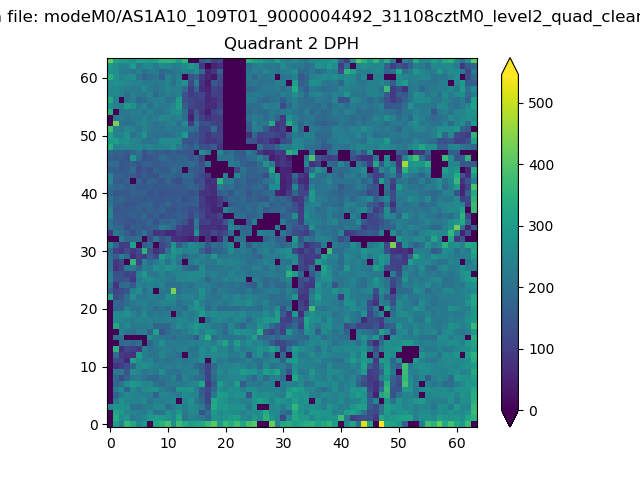
Top three noisy pixels from each quadrant. If the there are fewer than three noisy pixels in the level2.evt file, extra rows are filled as -1
| Pixel properties | Quadrant properties | ||||||
|---|---|---|---|---|---|---|---|
| Quadrant | DetID | PixID | Counts | Sigma | Mean | Median | Sigma |
| A | 13 | 254 | 11945 | 59.31 | 942 | 929 | 185.7 |
| A | 3 | 137 | 8870 | 42.75 | 942 | 929 | 185.7 |
| A | 0 | 226 | 7824 | 37.12 | 942 | 929 | 185.7 |
| B | 6 | 159 | 1835284 | 10474.61 | 931 | 912 | 175.1 |
| B | 0 | 183 | 25516 | 140.49 | 931 | 912 | 175.1 |
| B | 12 | 111 | 20703 | 113.01 | 931 | 912 | 175.1 |
| C | 0 | 10 | 166203 | 779.04 | 921 | 935 | 212.1 |
| C | 14 | 238 | 148519 | 695.68 | 921 | 935 | 212.1 |
| C | 10 | 22 | 86812 | 404.81 | 921 | 935 | 212.1 |
| D | 8 | 195 | 465430 | 2148.33 | 925 | 906 | 216.2 |
| D | 2 | 250 | 88159 | 403.53 | 925 | 906 | 216.2 |
| D | 2 | 153 | 79741 | 364.6 | 925 | 906 | 216.2 |
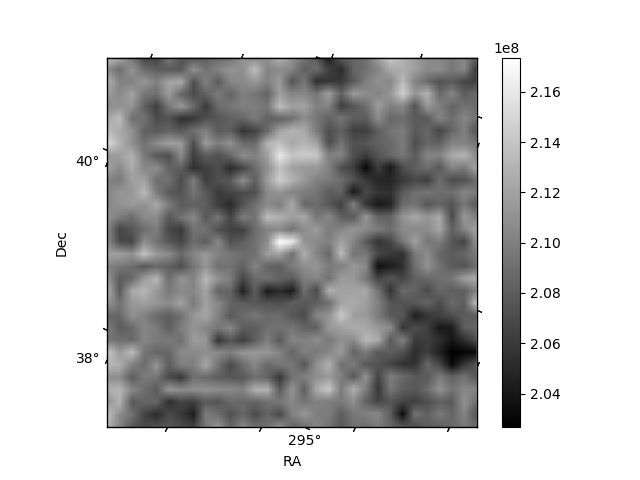
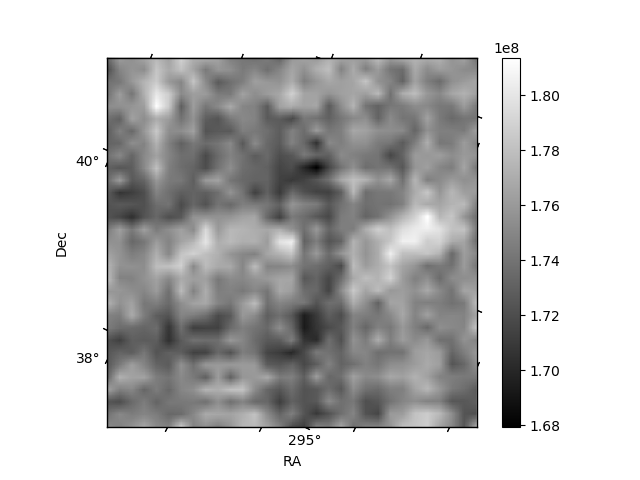
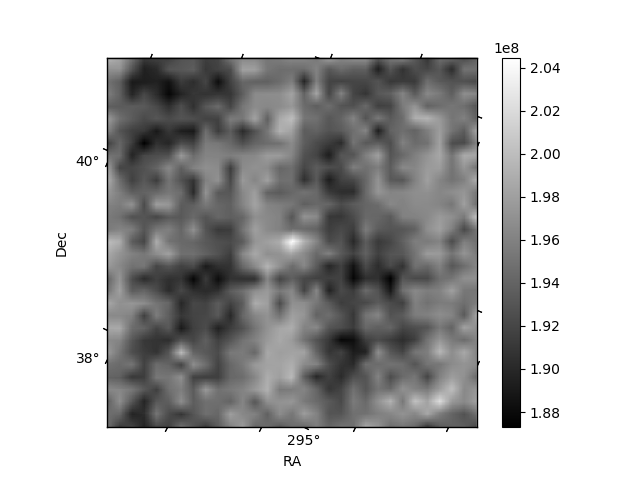
Histogram calculated using DETX and DETY for each event in the final _common_clean file
| Quadrant A | 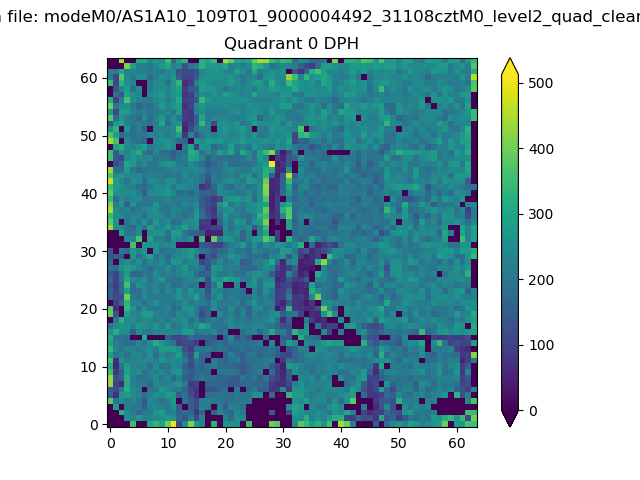 |
 |
Quadrant B |
|---|---|---|---|
| Quadrant D | 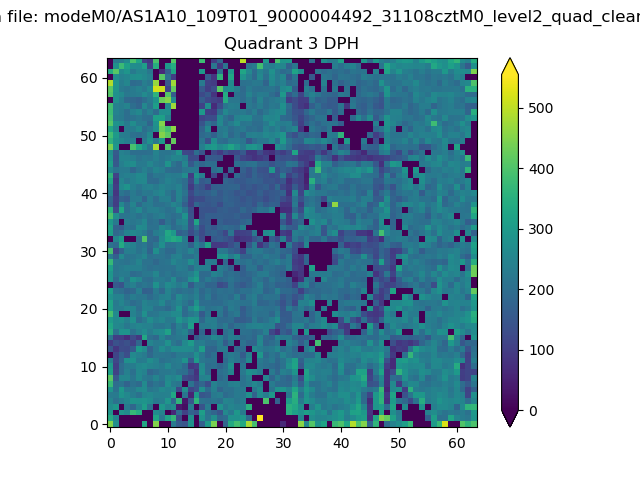 |
 |
Quadrant C |
| Plot type | Count rate plots | Images |
|---|---|---|
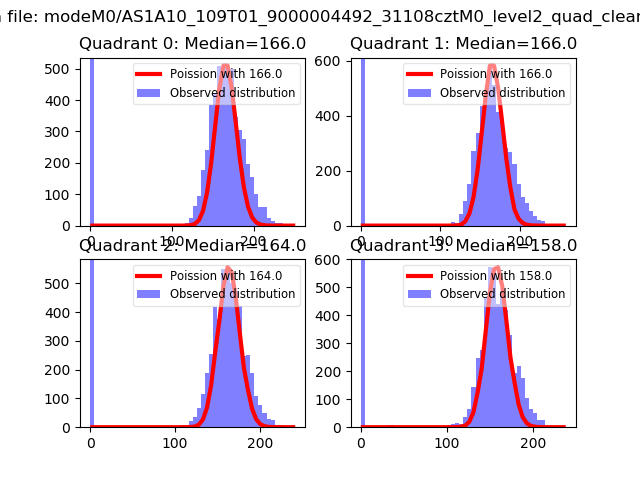
| Comparison with Poisson distribution Blue bars denote a histogram of data divided into 1 sec bins. Red curve is a Poisson curve with rate = median count rate of data. |
 |
 |
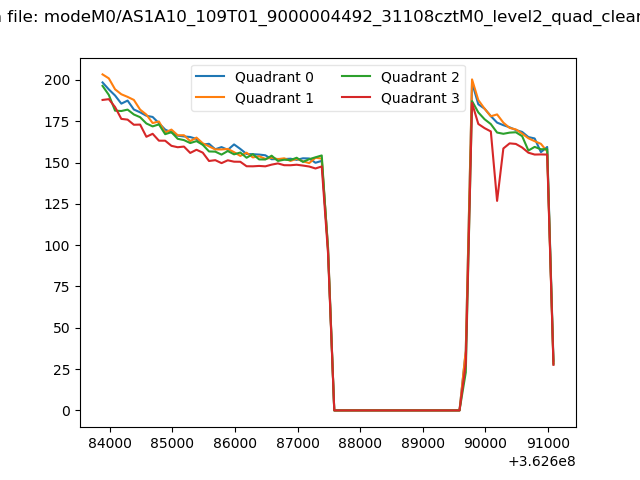
| Quadrant-wise count rates Data is divided into 100 sec bins |
 |
|
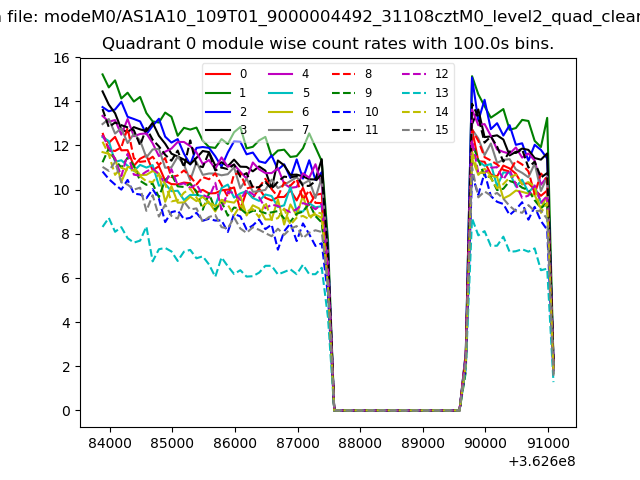
| Module-wise count rates for Quadrant A Data is divided into 100 sec bins |
 |
 |
| Module-wise count rates for Quadrant B Data is divided into 100 sec bins |
 |
 |
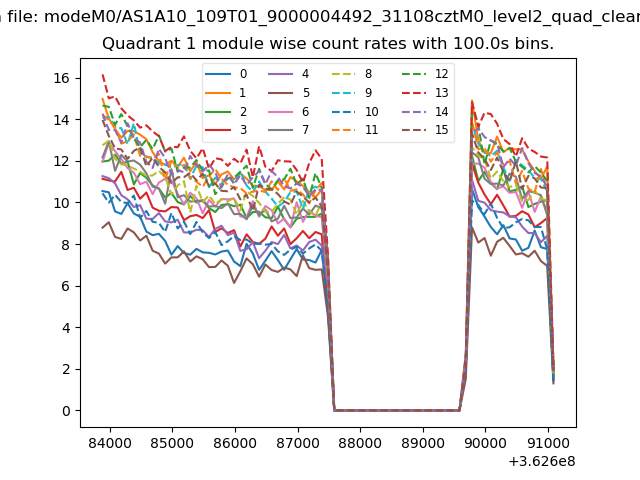
| Module-wise count rates for Quadrant C Data is divided into 100 sec bins |
 |
 |
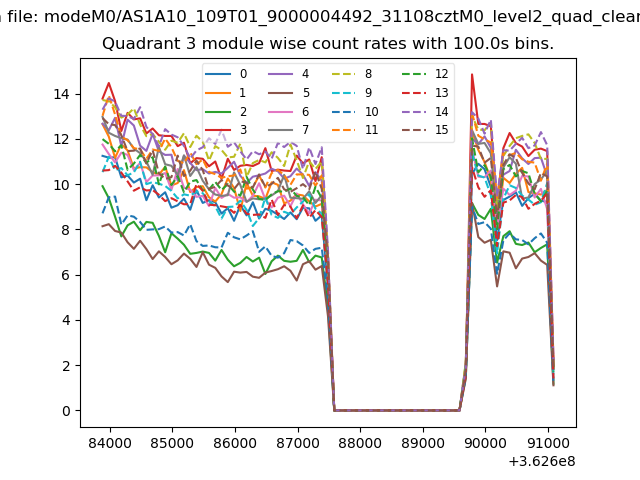
| Module-wise count rates for Quadrant D Data is divided into 100 sec bins |
 |
 |
| Parameter | Plot |
|---|---|
| CZT HV Monitor | 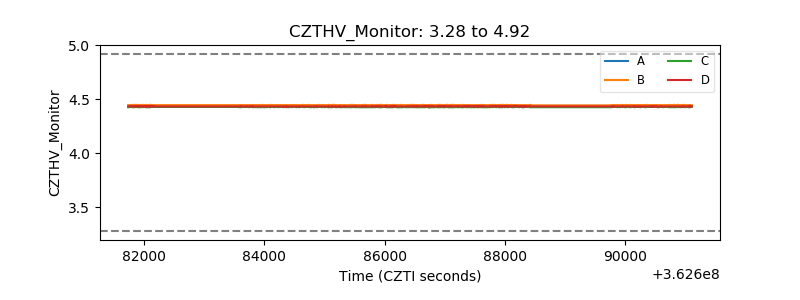 |
| D_VDD | 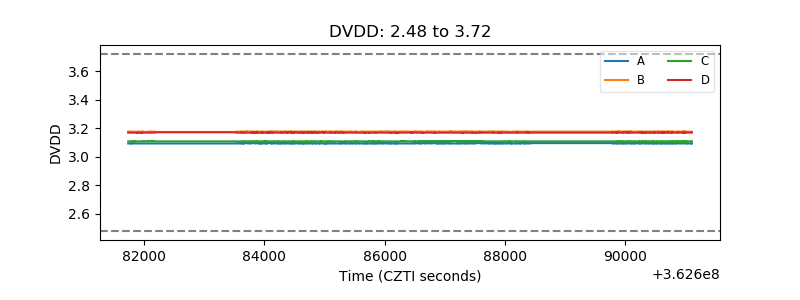 |
| Temperature 1 | 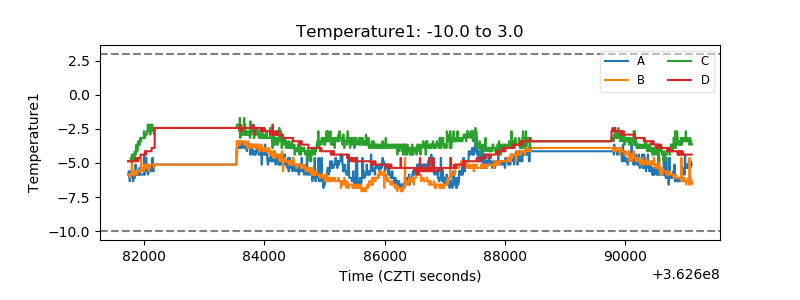 |
| Veto HV Monitor | 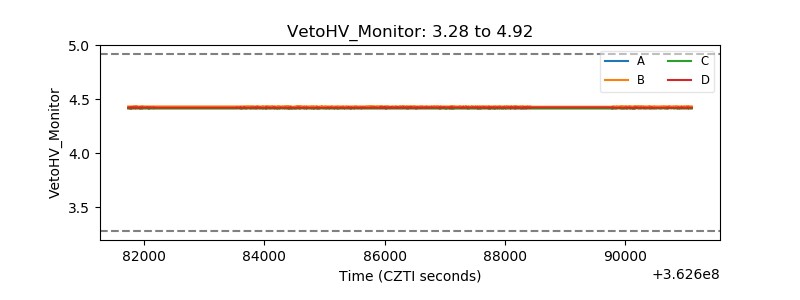 |
| Veto LLD | 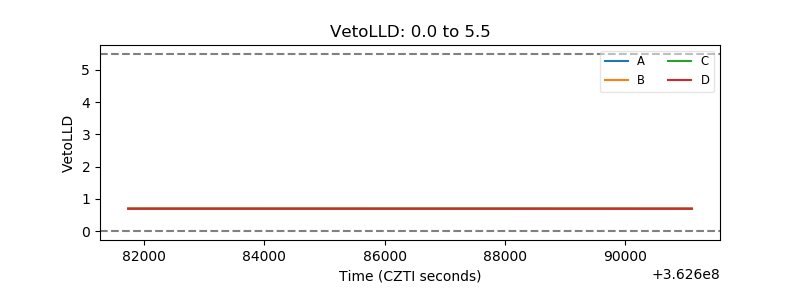 |
| Alpha Counter | 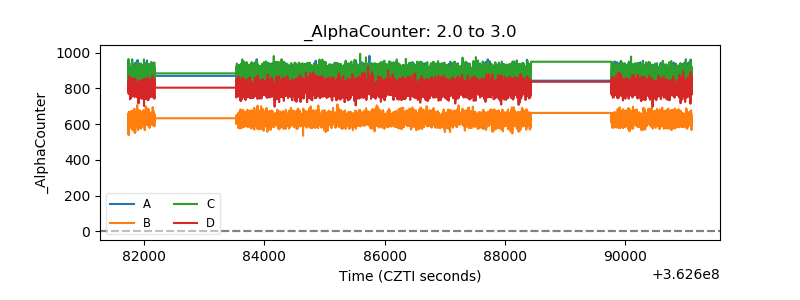 |
| _CPM_Rate | 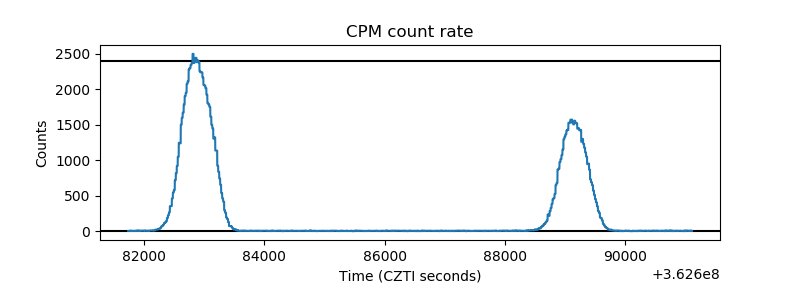 |
| CZT Counter | 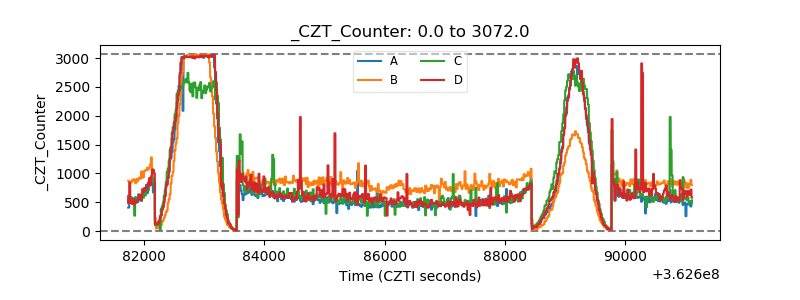 |
| +2.5 Volts monitor |  |
| +5 Volts monitor | 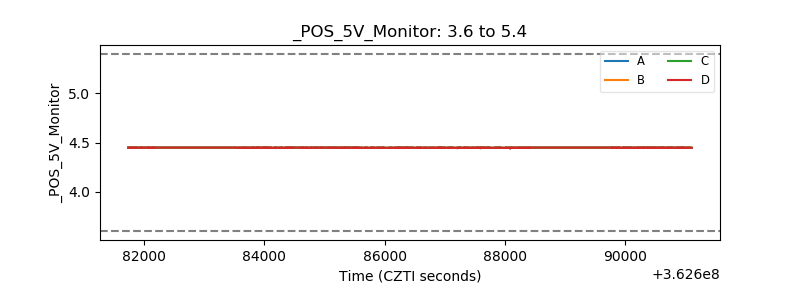 |
| _ROLL_ROT | 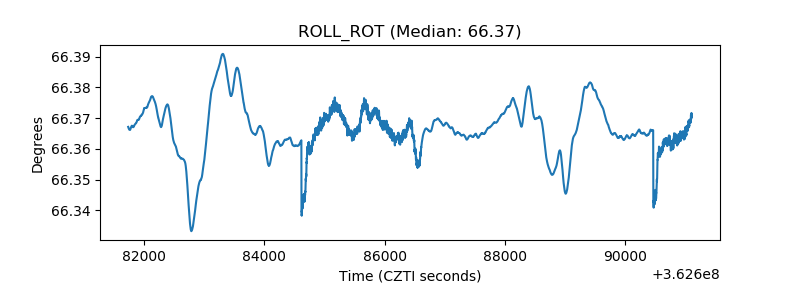 |
| _Roll_DEC | 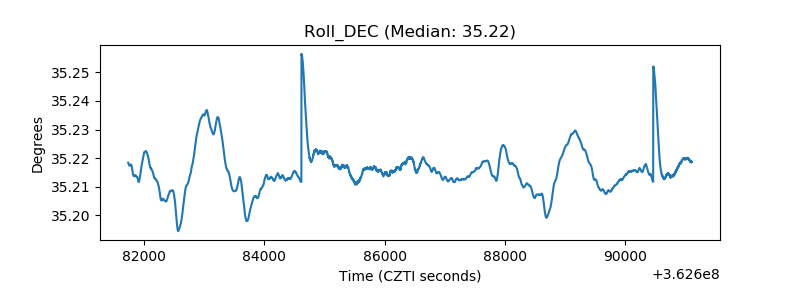 |
| _Roll_RA | 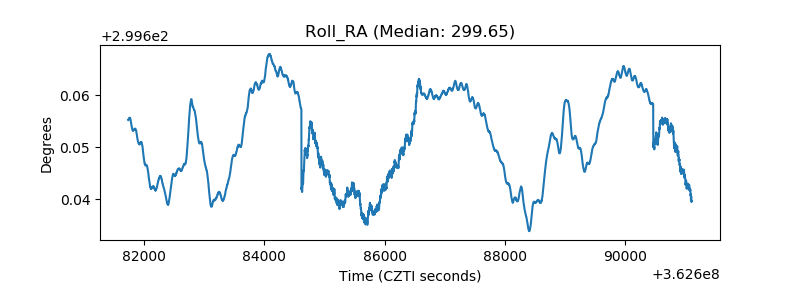 |
| Veto Counter |  |