| Param | Original file | Final file |
|---|---|---|
| Filename | modeM0/AS1A10_109T01_9000004492_31109cztM0_level2.evt | modeM0/AS1A10_109T01_9000004492_31109cztM0_level2_quad_clean.evt |
| Size (bytes) | 586,036,800 | 117,198,720 |
| Size | 558.9 MB | 111.8 MB |
| Events in quadrant A | 3,525,524 | 783,571 |
| Events in quadrant B | 5,553,920 | 782,489 |
| Events in quadrant C | 3,858,802 | 763,224 |
| Events in quadrant D | 4,348,136 | 744,716 |
| Mode M0 | |||
|---|---|---|---|
| Quadrant | BADHDUFLAG | Total packets | Discarded packets |
| A | 0 | 14718 | 2 |
| B | 0 | 20922 | 3 |
| C | 0 | 15786 | 2 |
| D | 0 | 17600 | 2 |
| Mode SS | |||
|---|---|---|---|
| Quadrant | BADHDUFLAG | Total packets | Discarded packets |
| A | 0 | 140 | 0 |
| B | 0 | 140 | 0 |
| C | 0 | 140 | 0 |
| D | 0 | 140 | 0 |
| Mode M9 | |||
|---|---|---|---|
| Quadrant | BADHDUFLAG | Total packets | Discarded packets |
| A | 0 | 25 | 0 |
| B | 0 | 25 | 0 |
| C | 0 | 25 | 0 |
| D | 0 | 25 | 0 |
| Quadrant | Total seconds | Saturated seconds | Saturation percentage |
|---|---|---|---|
| A | 6826 | 62 | 0.908292% |
| B | 6826 | 222 | 3.252271% |
| C | 6826 | 233 | 3.413419% |
| D | 6826 | 103 | 1.508936% |
Noise dominated data is calculated using 1-second bins in cleaned event files. If a bin has >2000 counts, and if more than 50% of those come from <1% of pixels, then it is considered to be noise-dominated and hence unusable.
| Quadrant | # 1 sec bins | Bins with >0 counts | Bins with >2000 counts | High rate bins dominated by noise | Noise dominated (total time) | Noise dominated (detector-on time) | Marked lightcurve |
|---|---|---|---|---|---|---|---|
| A | 9261 | 6828 | 0 | 0 | 0.00% | 0.00% | 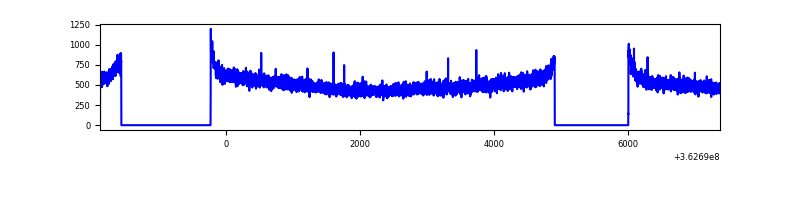 |
| B | 9261 | 6828 | 1 | 1 | 0.01% | 0.01% | 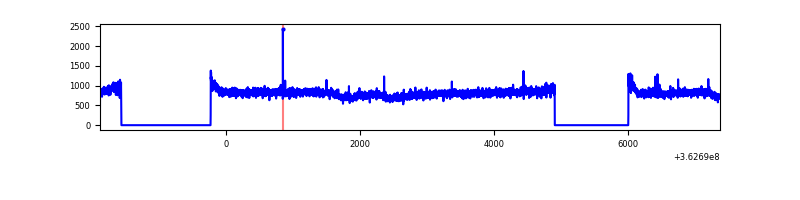 |
| C | 9261 | 6828 | 10 | 10 | 0.11% | 0.15% | 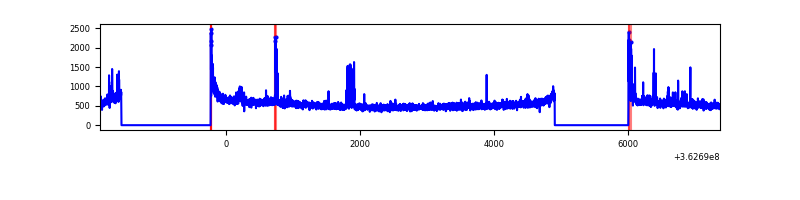 |
| D | 9261 | 6828 | 38 | 38 | 0.41% | 0.56% | 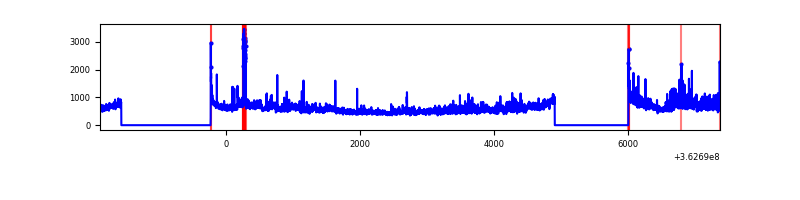 |
Top three noisy pixels from each quadrant. If the there are fewer than three noisy pixels in the level2.evt file, extra rows are filled as -1
| Pixel properties | Quadrant properties | ||||||
|---|---|---|---|---|---|---|---|
| Quadrant | DetID | PixID | Counts | Sigma | Mean | Median | Sigma |
| A | 13 | 254 | 11683 | 58.88 | 914 | 901 | 183.1 |
| A | 3 | 137 | 9037 | 44.43 | 914 | 901 | 183.1 |
| A | 0 | 226 | 7460 | 35.82 | 914 | 901 | 183.1 |
| B | 6 | 159 | 1974456 | 11519.25 | 903 | 882 | 171.3 |
| B | 0 | 183 | 24096 | 135.49 | 903 | 882 | 171.3 |
| B | 12 | 111 | 20903 | 116.86 | 903 | 882 | 171.3 |
| C | 14 | 238 | 142390 | 682.16 | 890 | 900 | 207.4 |
| C | 0 | 10 | 117993 | 564.54 | 890 | 900 | 207.4 |
| C | 8 | 229 | 46042 | 217.64 | 890 | 900 | 207.4 |
| D | 8 | 195 | 459269 | 2162.27 | 891 | 869 | 212.0 |
| D | 13 | 174 | 329902 | 1552.05 | 891 | 869 | 212.0 |
| D | 12 | 218 | 88983 | 415.63 | 891 | 869 | 212.0 |
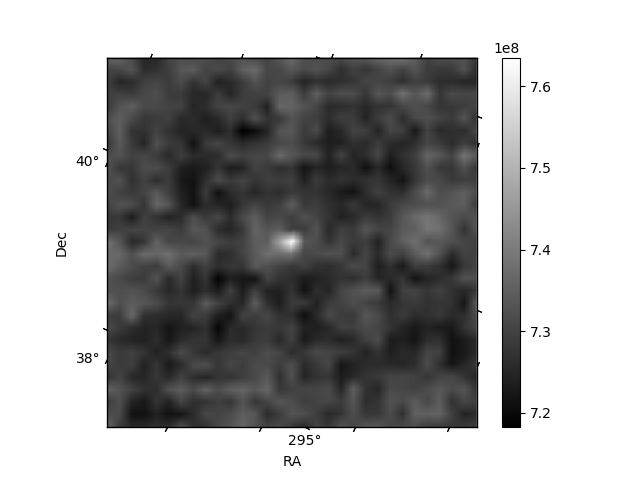
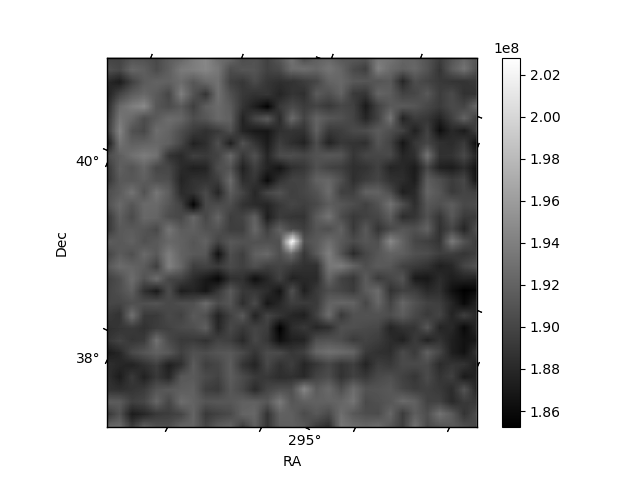
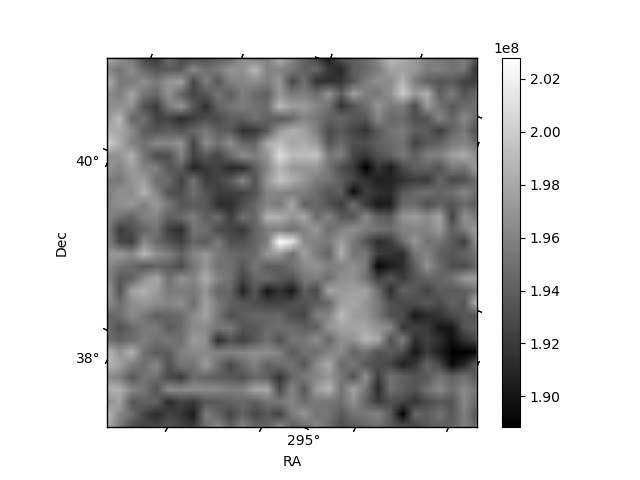
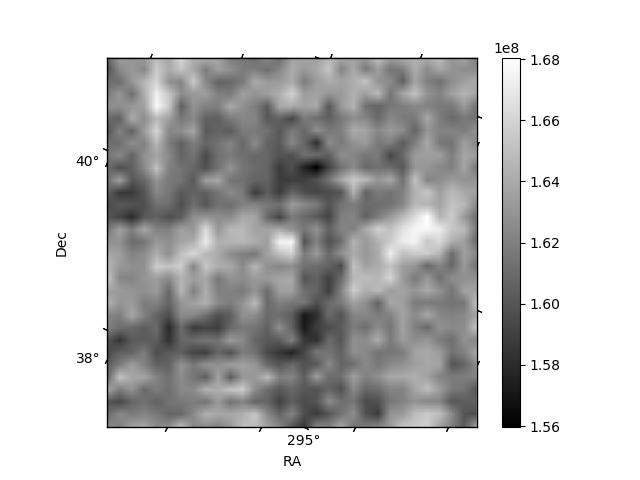
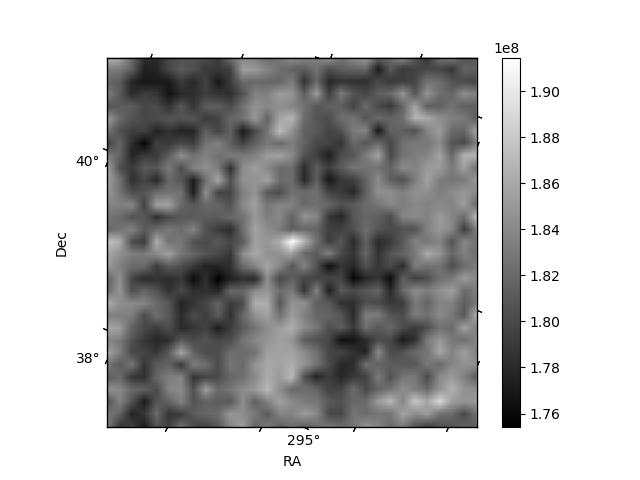
Histogram calculated using DETX and DETY for each event in the final _common_clean file
| Quadrant A | 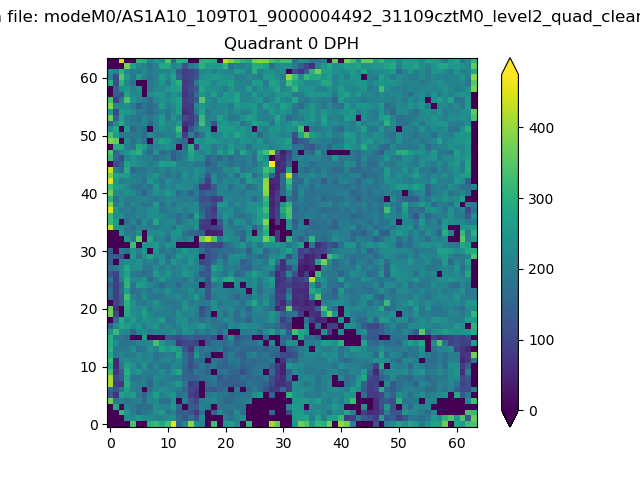 |
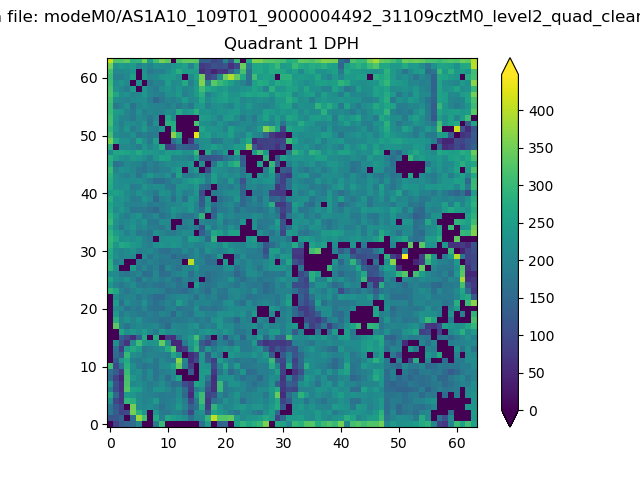 |
Quadrant B |
|---|---|---|---|
| Quadrant D | 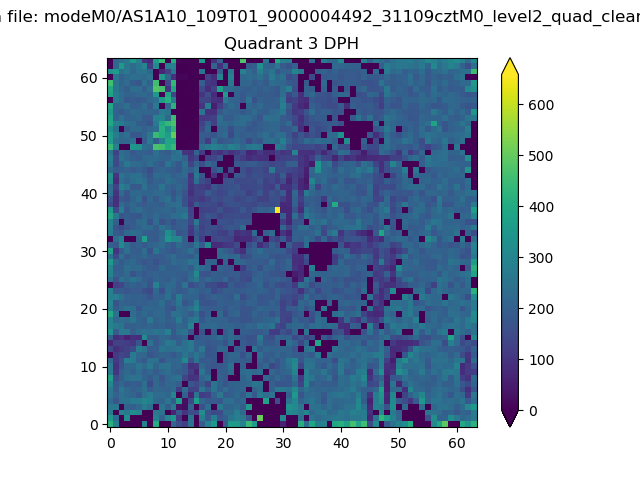 |
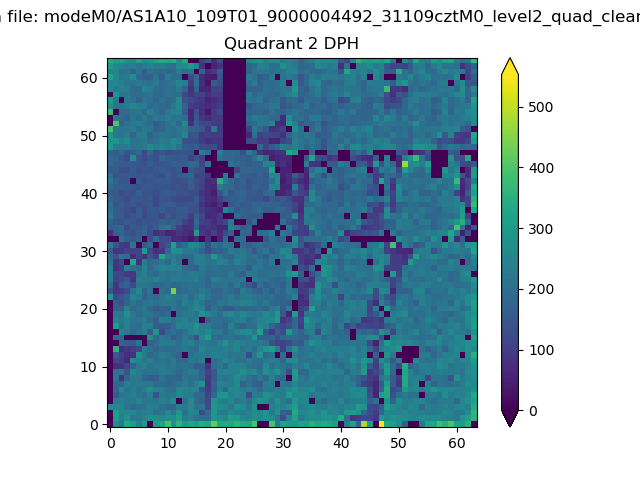 |
Quadrant C |
| Plot type | Count rate plots | Images |
|---|---|---|
| Comparison with Poisson distribution Blue bars denote a histogram of data divided into 1 sec bins. Red curve is a Poisson curve with rate = median count rate of data. |
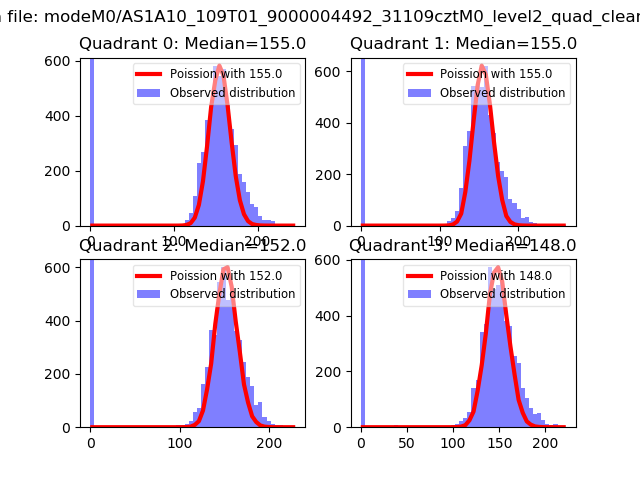 |
 |
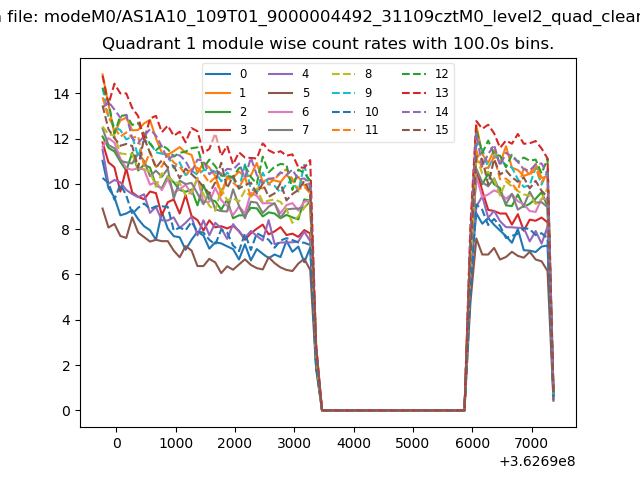
| Quadrant-wise count rates Data is divided into 100 sec bins |
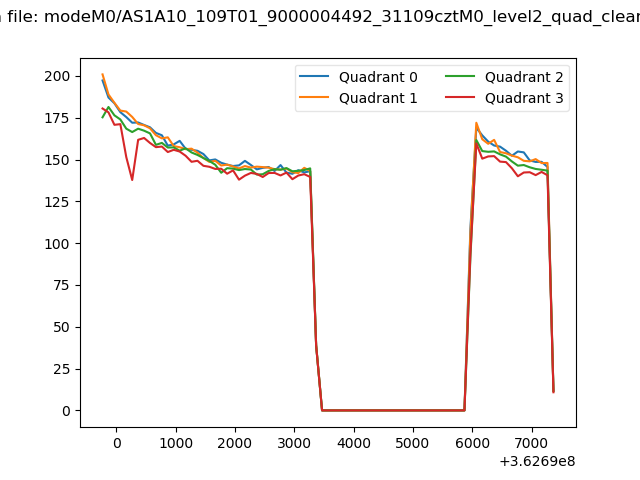 |
|
| Module-wise count rates for Quadrant A Data is divided into 100 sec bins |
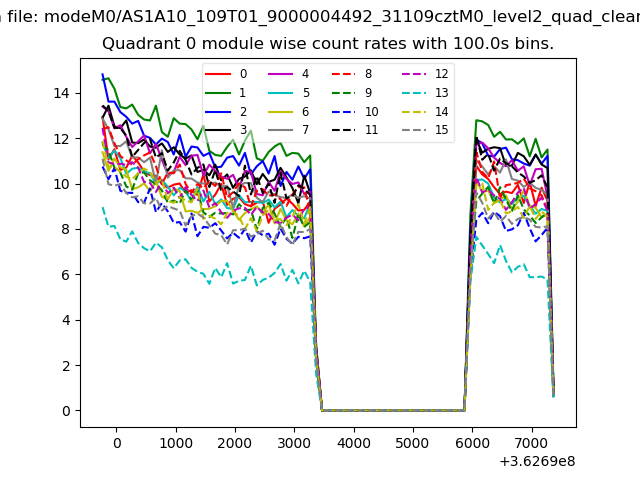 |
 |
| Module-wise count rates for Quadrant B Data is divided into 100 sec bins |
 |
 |
| Module-wise count rates for Quadrant C Data is divided into 100 sec bins |
 |
 |
| Module-wise count rates for Quadrant D Data is divided into 100 sec bins |
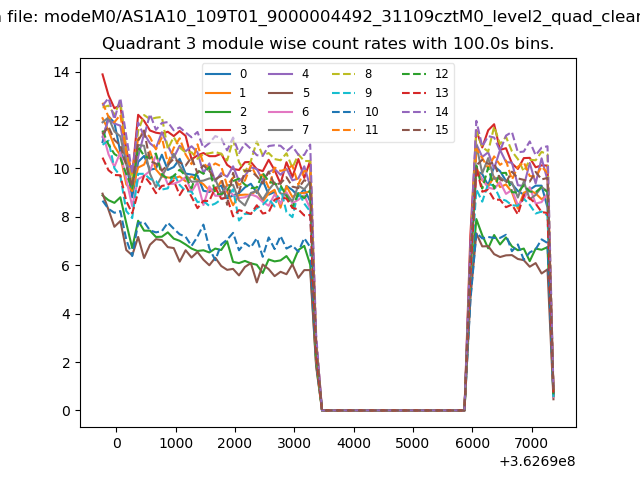 |
 |
| Parameter | Plot |
|---|---|
| CZT HV Monitor | 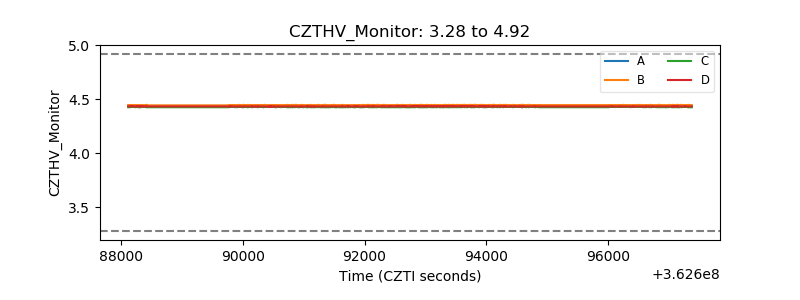 |
| D_VDD | 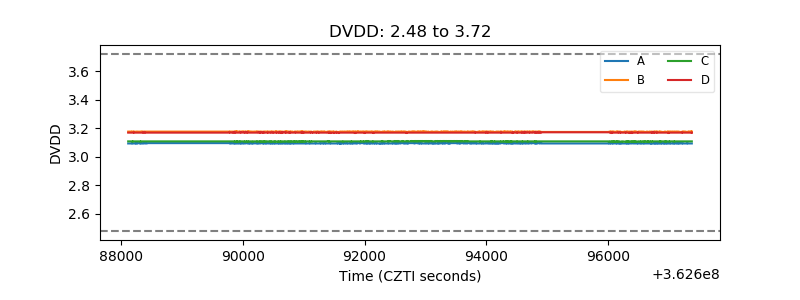 |
| Temperature 1 | 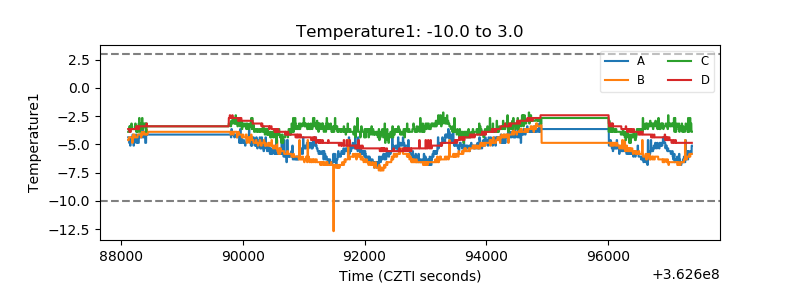 |
| Veto HV Monitor | 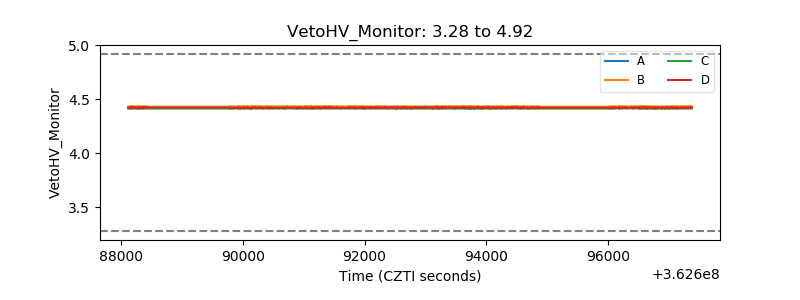 |
| Veto LLD | 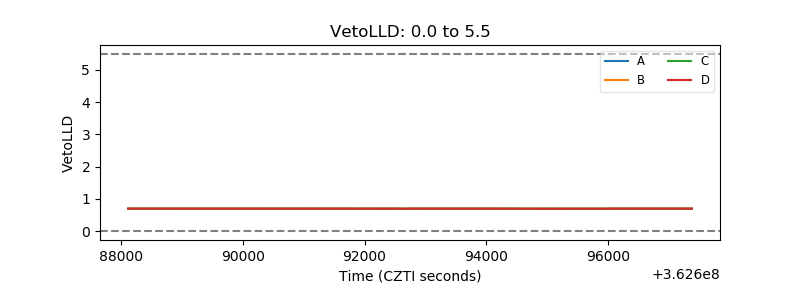 |
| Alpha Counter | 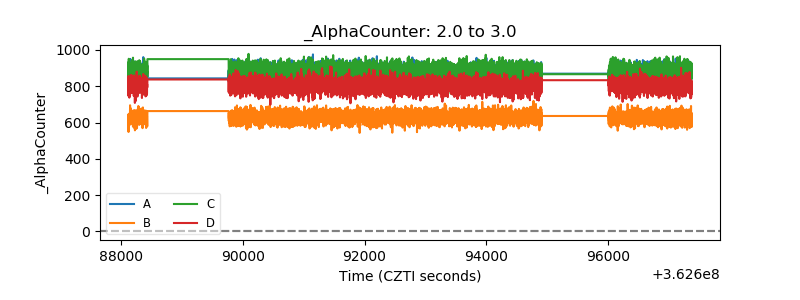 |
| _CPM_Rate | 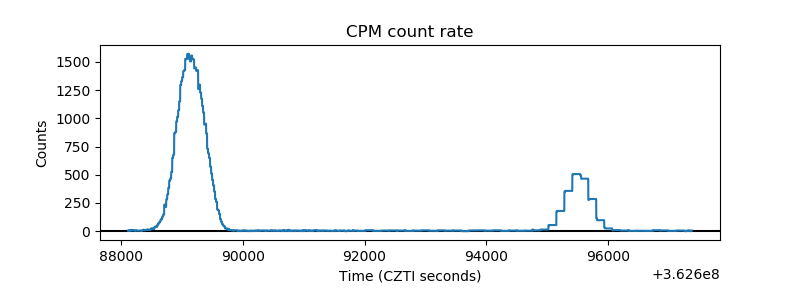 |
| CZT Counter |  |
| +2.5 Volts monitor |  |
| +5 Volts monitor | 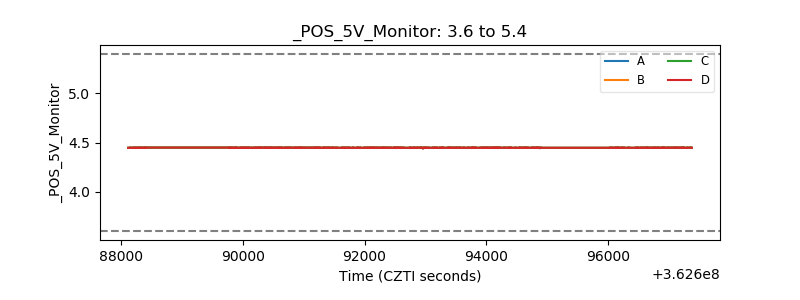 |
| _ROLL_ROT | 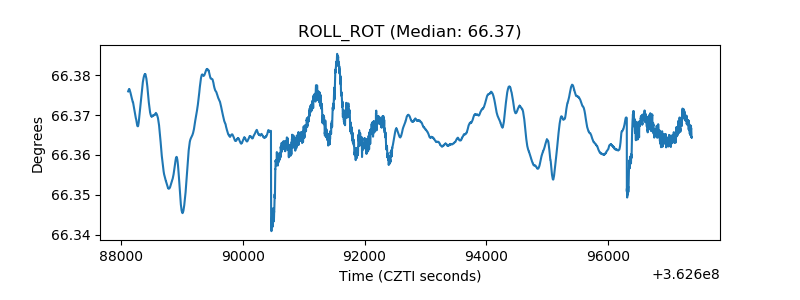 |
| _Roll_DEC | 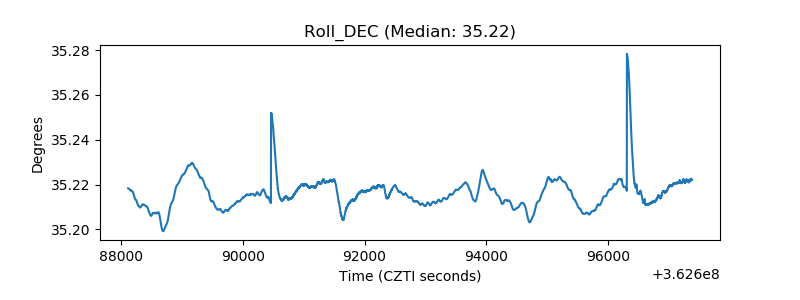 |
| _Roll_RA | 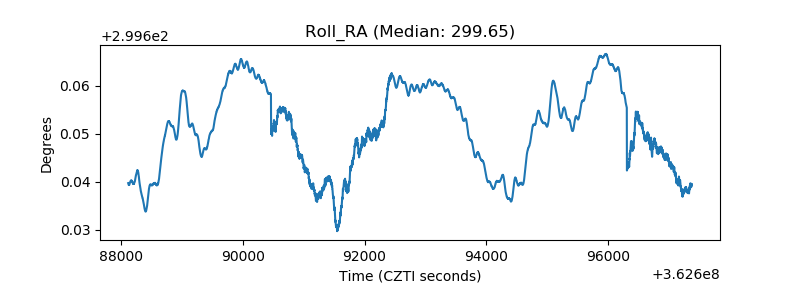 |
| Veto Counter |  |