| Param | Original file | Final file |
|---|---|---|
| Filename | modeM0/AS1A10_109T01_9000004492_31110cztM0_level2.evt | modeM0/AS1A10_109T01_9000004492_31110cztM0_level2_quad_clean.evt |
| Size (bytes) | 591,433,920 | 105,471,360 |
| Size | 564.0 MB | 100.6 MB |
| Events in quadrant A | 3,455,240 | 693,019 |
| Events in quadrant B | 5,489,277 | 689,324 |
| Events in quadrant C | 4,190,687 | 666,777 |
| Events in quadrant D | 4,304,809 | 659,763 |
| Mode M0 | |||
|---|---|---|---|
| Quadrant | BADHDUFLAG | Total packets | Discarded packets |
| A | 0 | 14650 | 2 |
| B | 0 | 21215 | 2 |
| C | 0 | 16856 | 2 |
| D | 0 | 17448 | 2 |
| Mode SS | |||
|---|---|---|---|
| Quadrant | BADHDUFLAG | Total packets | Discarded packets |
| A | 0 | 144 | 0 |
| B | 0 | 144 | 0 |
| C | 0 | 144 | 0 |
| D | 0 | 144 | 0 |
| Mode M9 | |||
|---|---|---|---|
| Quadrant | BADHDUFLAG | Total packets | Discarded packets |
| A | 0 | 18 | 0 |
| B | 0 | 18 | 0 |
| C | 0 | 18 | 0 |
| D | 0 | 18 | 0 |
| Quadrant | Total seconds | Saturated seconds | Saturation percentage |
|---|---|---|---|
| A | 6965 | 38 | 0.545585% |
| B | 6966 | 188 | 2.698823% |
| C | 6966 | 446 | 6.402527% |
| D | 6966 | 73 | 1.047947% |
Noise dominated data is calculated using 1-second bins in cleaned event files. If a bin has >2000 counts, and if more than 50% of those come from <1% of pixels, then it is considered to be noise-dominated and hence unusable.
| Quadrant | # 1 sec bins | Bins with >0 counts | Bins with >2000 counts | High rate bins dominated by noise | Noise dominated (total time) | Noise dominated (detector-on time) | Marked lightcurve |
|---|---|---|---|---|---|---|---|
| A | 8795 | 6967 | 0 | 0 | 0.00% | 0.00% | 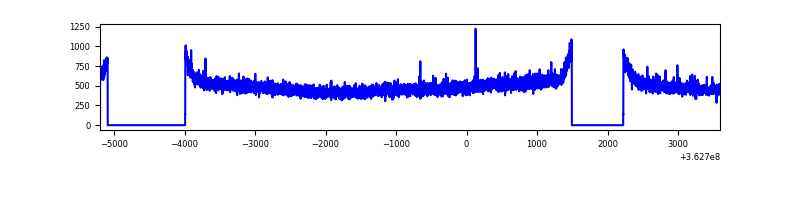 |
| B | 8796 | 6968 | 1 | 1 | 0.01% | 0.01% | 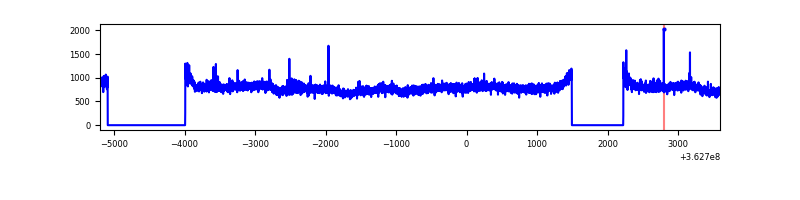 |
| C | 8796 | 6968 | 140 | 140 | 1.59% | 2.01% |  |
| D | 8796 | 6968 | 14 | 14 | 0.16% | 0.20% | 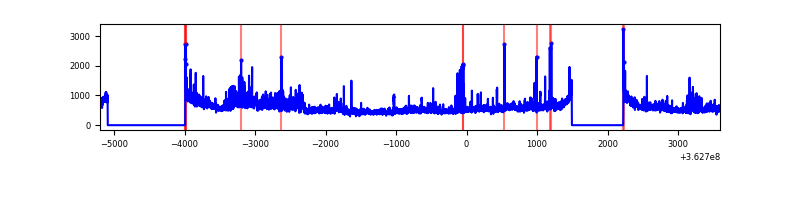 |
Top three noisy pixels from each quadrant. If the there are fewer than three noisy pixels in the level2.evt file, extra rows are filled as -1
| Pixel properties | Quadrant properties | ||||||
|---|---|---|---|---|---|---|---|
| Quadrant | DetID | PixID | Counts | Sigma | Mean | Median | Sigma |
| A | 13 | 254 | 11524 | 59.3 | 895 | 878 | 179.5 |
| A | 3 | 137 | 9070 | 45.63 | 895 | 878 | 179.5 |
| A | 0 | 226 | 7318 | 35.87 | 895 | 878 | 179.5 |
| B | 6 | 159 | 1973600 | 11605.17 | 884 | 863 | 170.0 |
| B | 0 | 183 | 28870 | 164.76 | 884 | 863 | 170.0 |
| B | 12 | 111 | 21164 | 119.42 | 884 | 863 | 170.0 |
| C | 10 | 22 | 507568 | 2536.35 | 849 | 856 | 199.8 |
| C | 0 | 10 | 183403 | 913.74 | 849 | 856 | 199.8 |
| C | 14 | 238 | 134172 | 667.31 | 849 | 856 | 199.8 |
| D | 8 | 195 | 434858 | 2096.08 | 871 | 850 | 207.1 |
| D | 13 | 174 | 408012 | 1966.43 | 871 | 850 | 207.1 |
| D | 7 | 64 | 76728 | 366.46 | 871 | 850 | 207.1 |
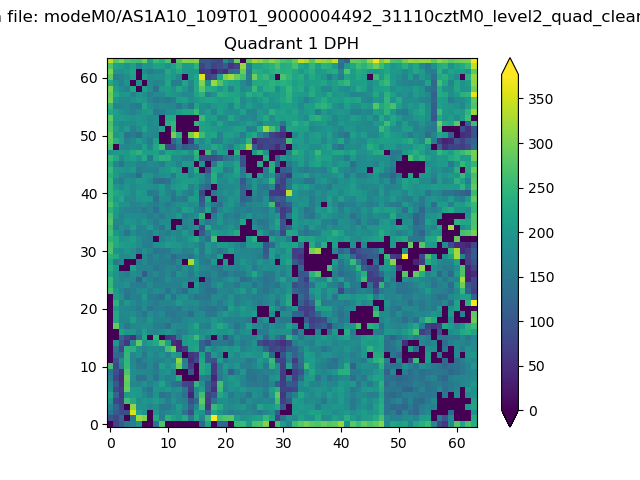
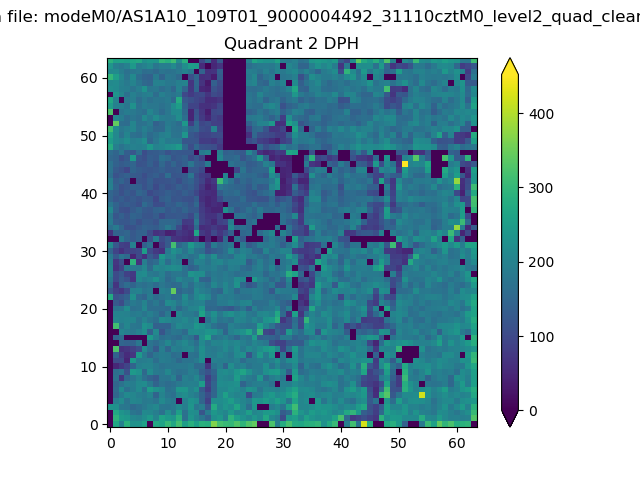
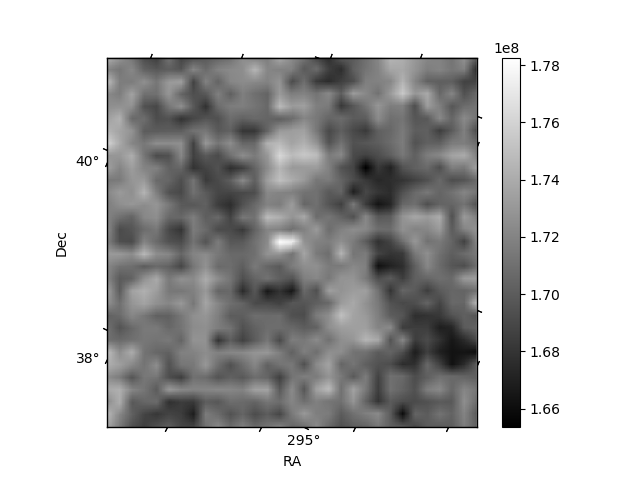
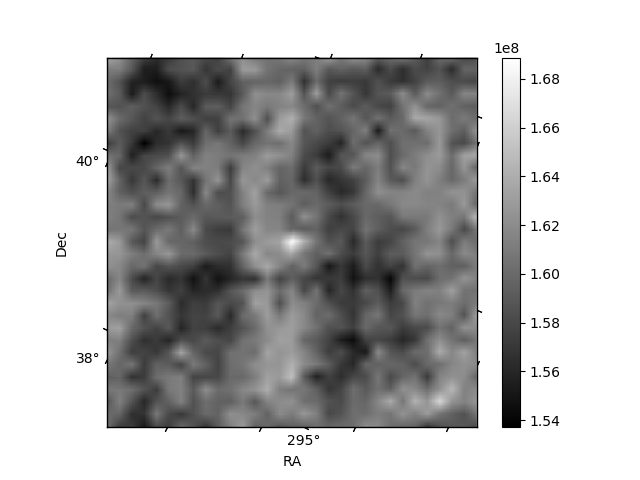
Histogram calculated using DETX and DETY for each event in the final _common_clean file
| Quadrant A | 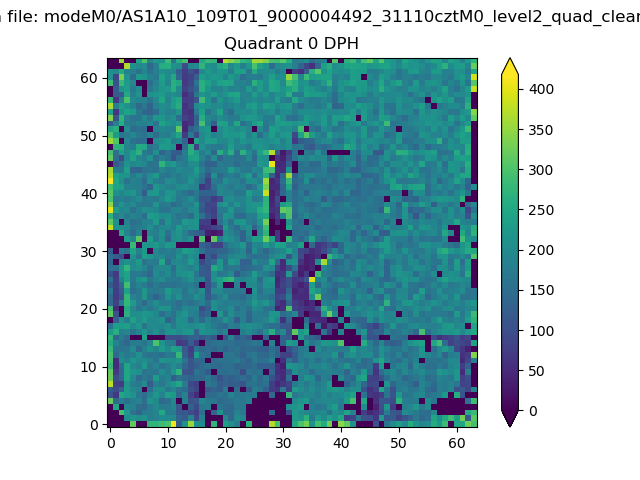 |
 |
Quadrant B |
|---|---|---|---|
| Quadrant D | 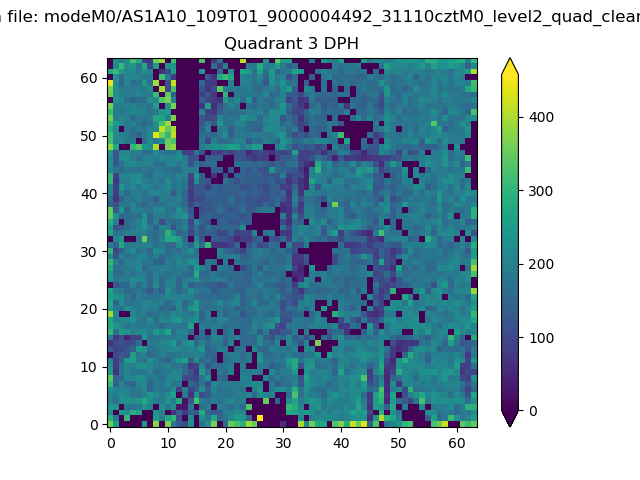 |
 |
Quadrant C |
| Plot type | Count rate plots | Images |
|---|---|---|
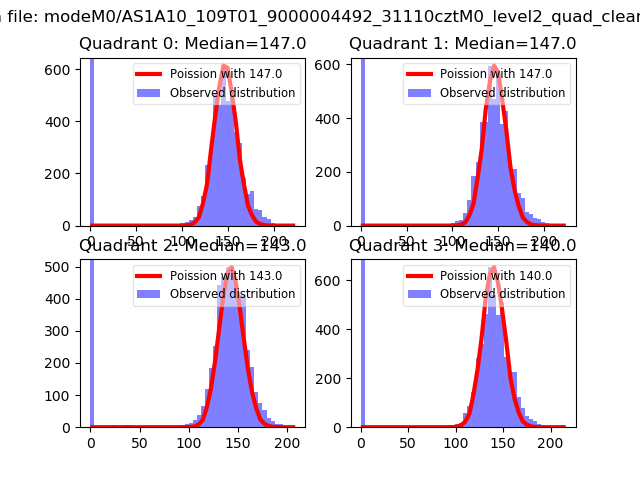
| Comparison with Poisson distribution Blue bars denote a histogram of data divided into 1 sec bins. Red curve is a Poisson curve with rate = median count rate of data. |
 |
 |
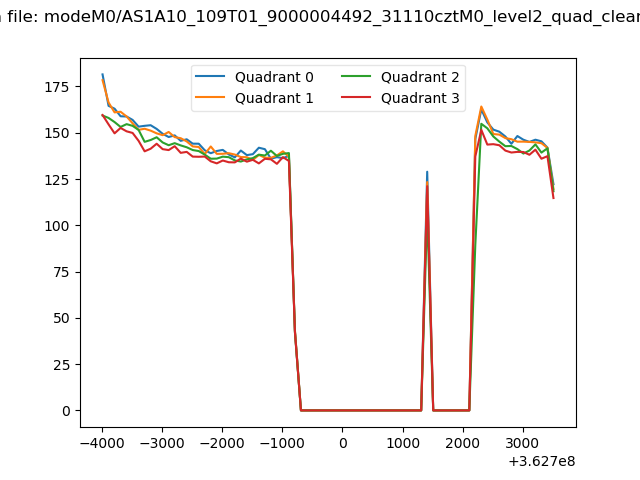
| Quadrant-wise count rates Data is divided into 100 sec bins |
 |
|
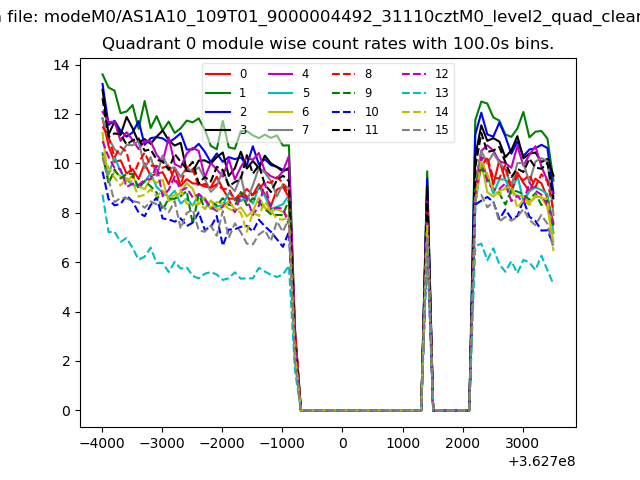
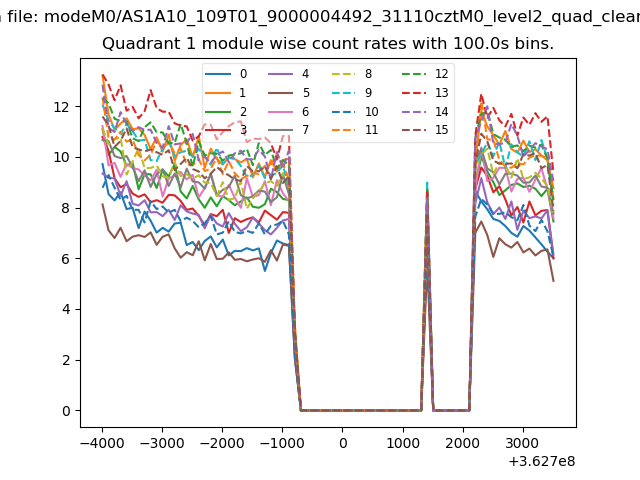
| Module-wise count rates for Quadrant A Data is divided into 100 sec bins |
 |
 |
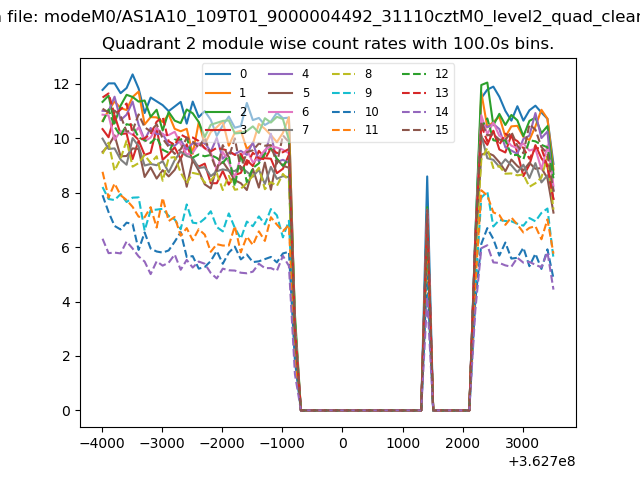
| Module-wise count rates for Quadrant B Data is divided into 100 sec bins |
 |
 |
| Module-wise count rates for Quadrant C Data is divided into 100 sec bins |
 |
 |
| Module-wise count rates for Quadrant D Data is divided into 100 sec bins |
 |
 |
| Parameter | Plot |
|---|---|
| CZT HV Monitor | 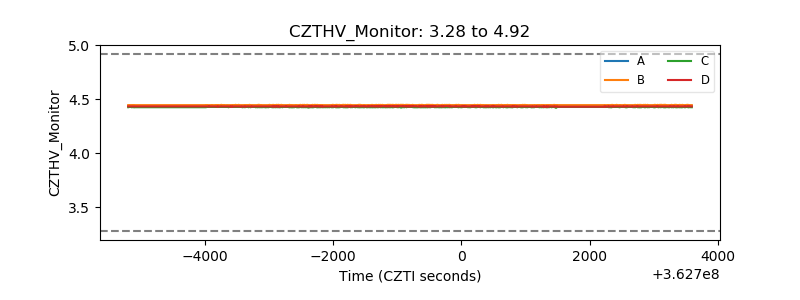 |
| D_VDD | 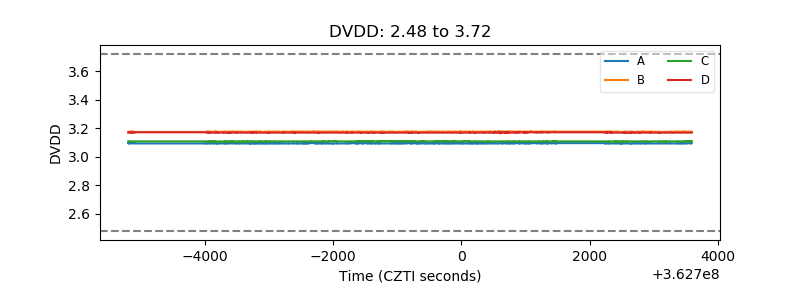 |
| Temperature 1 | 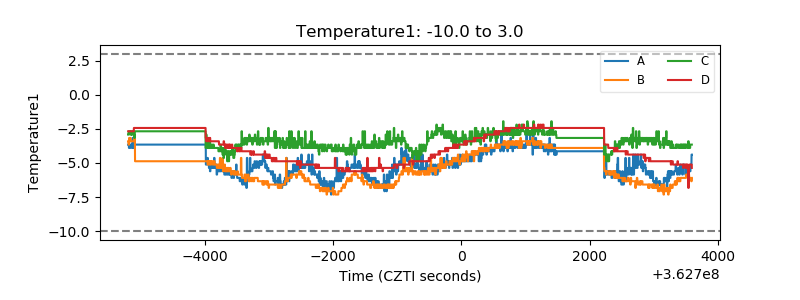 |
| Veto HV Monitor | 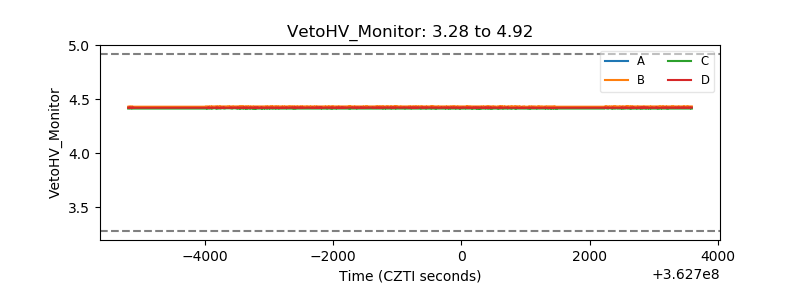 |
| Veto LLD | 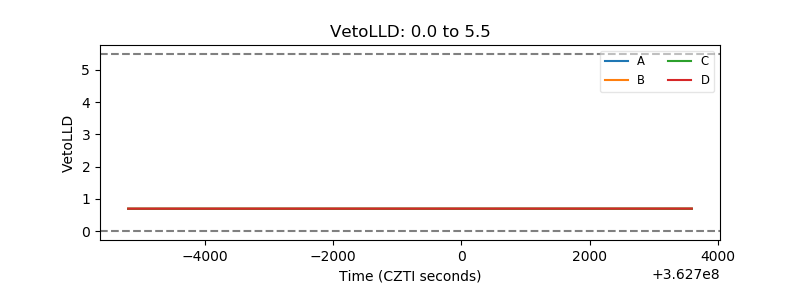 |
| Alpha Counter | 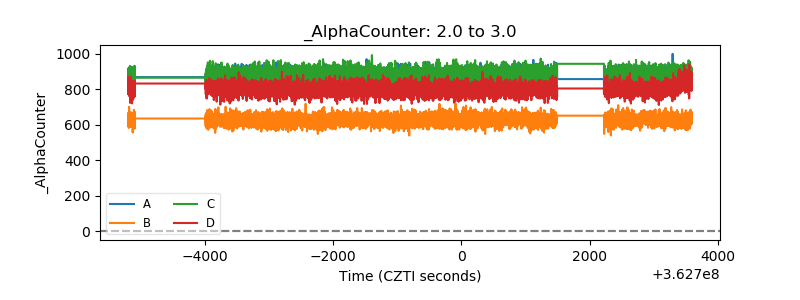 |
| _CPM_Rate | 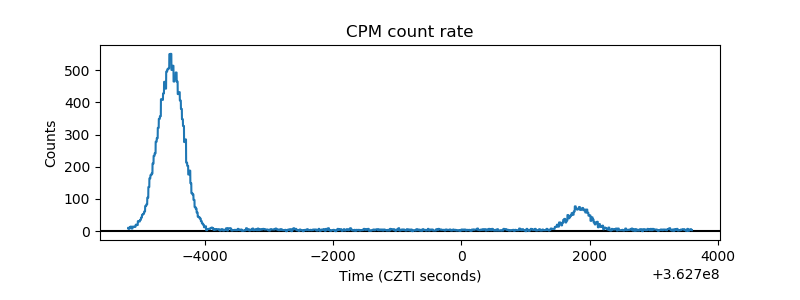 |
| CZT Counter | 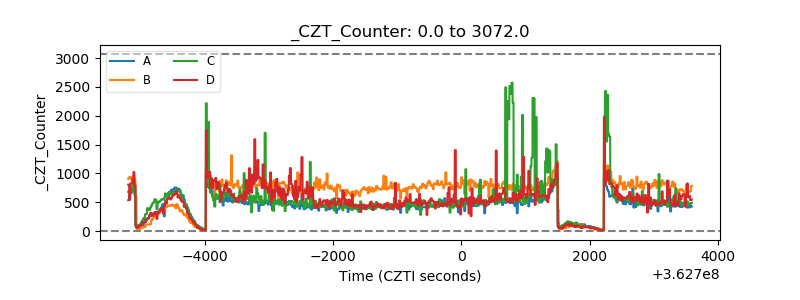 |
| +2.5 Volts monitor |  |
| +5 Volts monitor |  |
| _ROLL_ROT | 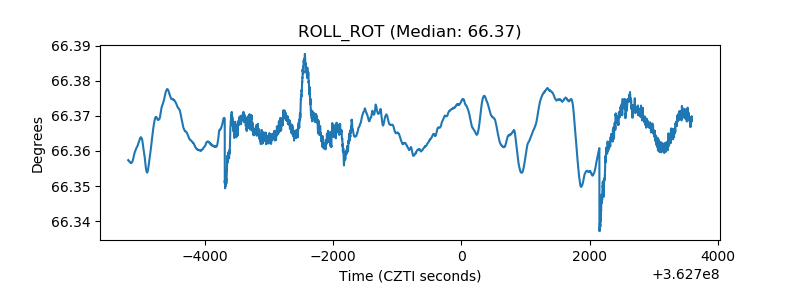 |
| _Roll_DEC | 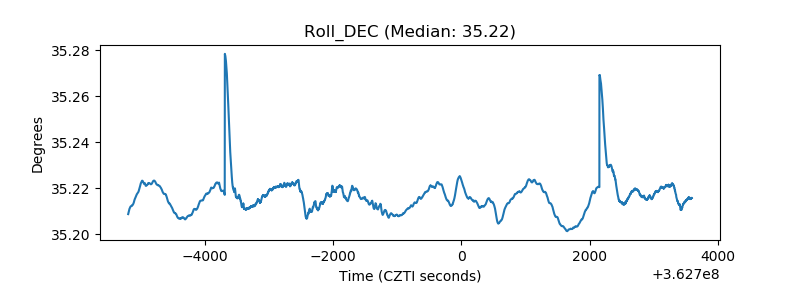 |
| _Roll_RA | 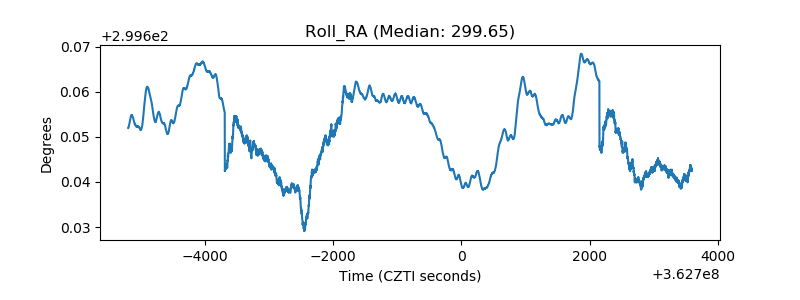 |
| Veto Counter | 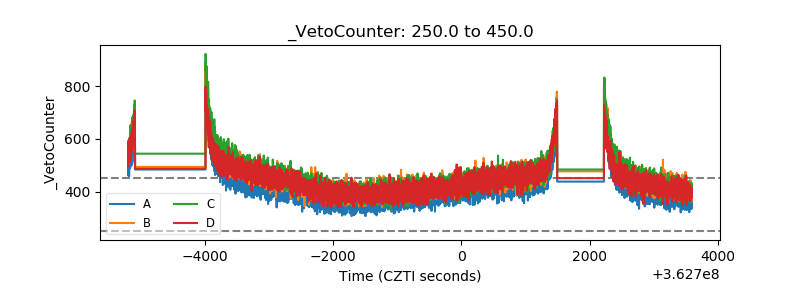 |