| Param | Original file | Final file |
|---|---|---|
| Filename | modeM0/AS1A10_109T01_9000004492_31111cztM0_level2.evt | modeM0/AS1A10_109T01_9000004492_31111cztM0_level2_quad_clean.evt |
| Size (bytes) | 665,144,640 | 117,452,160 |
| Size | 634.3 MB | 112.0 MB |
| Events in quadrant A | 3,815,073 | 784,393 |
| Events in quadrant B | 5,997,802 | 775,729 |
| Events in quadrant C | 5,227,322 | 726,391 |
| Events in quadrant D | 4,589,199 | 741,385 |
| Mode M0 | |||
|---|---|---|---|
| Quadrant | BADHDUFLAG | Total packets | Discarded packets |
| A | 0 | 16244 | 2 |
| B | 0 | 23388 | 2 |
| C | 0 | 20443 | 2 |
| D | 0 | 18716 | 2 |
| Mode SS | |||
|---|---|---|---|
| Quadrant | BADHDUFLAG | Total packets | Discarded packets |
| A | 0 | 158 | 0 |
| B | 0 | 158 | 0 |
| C | 0 | 158 | 0 |
| D | 0 | 158 | 0 |
| Mode M9 | |||
|---|---|---|---|
| Quadrant | BADHDUFLAG | Total packets | Discarded packets |
| A | 0 | 10 | 0 |
| B | 0 | 10 | 0 |
| C | 0 | 10 | 0 |
| D | 0 | 10 | 0 |
| Quadrant | Total seconds | Saturated seconds | Saturation percentage |
|---|---|---|---|
| A | 7602 | 134 | 1.762694% |
| B | 7603 | 323 | 4.248323% |
| C | 7603 | 868 | 11.416546% |
| D | 7603 | 142 | 1.867684% |
Noise dominated data is calculated using 1-second bins in cleaned event files. If a bin has >2000 counts, and if more than 50% of those come from <1% of pixels, then it is considered to be noise-dominated and hence unusable.
| Quadrant | # 1 sec bins | Bins with >0 counts | Bins with >2000 counts | High rate bins dominated by noise | Noise dominated (total time) | Noise dominated (detector-on time) | Marked lightcurve |
|---|---|---|---|---|---|---|---|
| A | 8562 | 7605 | 0 | 0 | 0.00% | 0.00% | 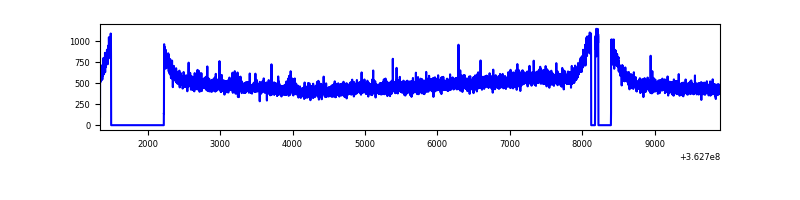 |
| B | 8563 | 7606 | 5 | 5 | 0.06% | 0.07% | 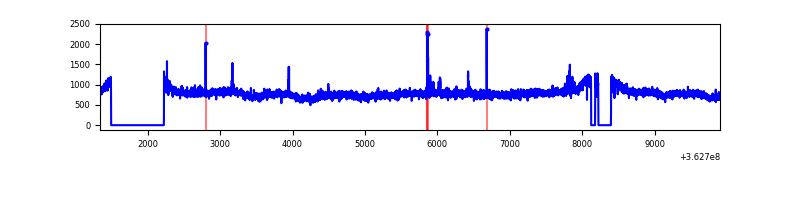 |
| C | 8563 | 7606 | 339 | 339 | 3.96% | 4.46% | 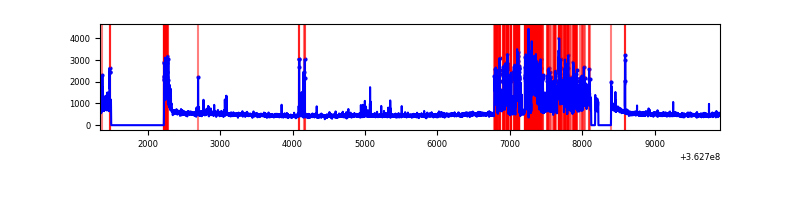 |
| D | 8563 | 7606 | 15 | 15 | 0.18% | 0.20% | 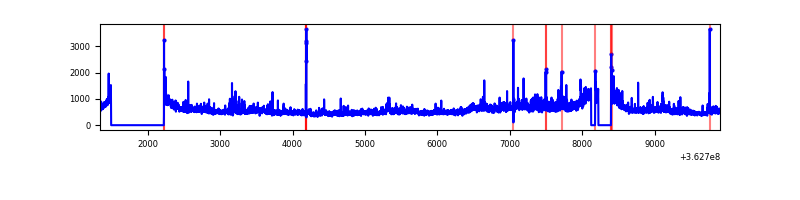 |
Top three noisy pixels from each quadrant. If the there are fewer than three noisy pixels in the level2.evt file, extra rows are filled as -1
| Pixel properties | Quadrant properties | ||||||
|---|---|---|---|---|---|---|---|
| Quadrant | DetID | PixID | Counts | Sigma | Mean | Median | Sigma |
| A | 15 | 174 | 20233 | 98.04 | 984 | 966 | 196.5 |
| A | 13 | 254 | 12556 | 58.97 | 984 | 966 | 196.5 |
| A | 3 | 137 | 10302 | 47.5 | 984 | 966 | 196.5 |
| B | 6 | 159 | 2118927 | 11282.22 | 966 | 943 | 187.7 |
| B | 0 | 183 | 26796 | 137.72 | 966 | 943 | 187.7 |
| B | 0 | 230 | 24688 | 126.49 | 966 | 943 | 187.7 |
| C | 0 | 10 | 1416018 | 6570.64 | 915 | 924 | 215.4 |
| C | 14 | 238 | 143486 | 661.95 | 915 | 924 | 215.4 |
| C | 10 | 22 | 54980 | 251.0 | 915 | 924 | 215.4 |
| D | 8 | 195 | 680927 | 2982.0 | 952 | 928 | 228.0 |
| D | 13 | 174 | 189999 | 829.13 | 952 | 928 | 228.0 |
| D | 2 | 250 | 60857 | 262.81 | 952 | 928 | 228.0 |
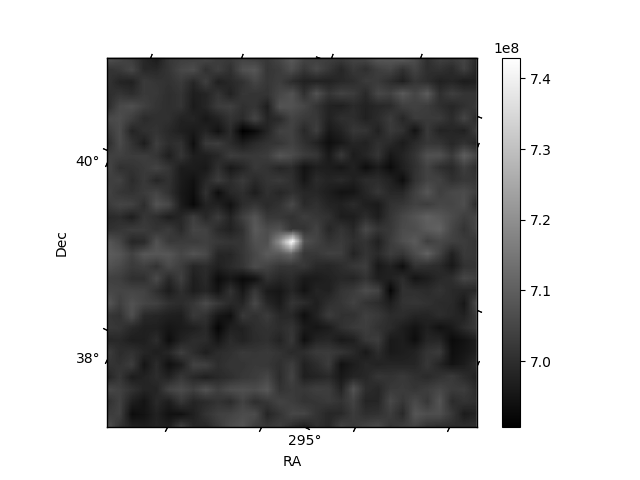
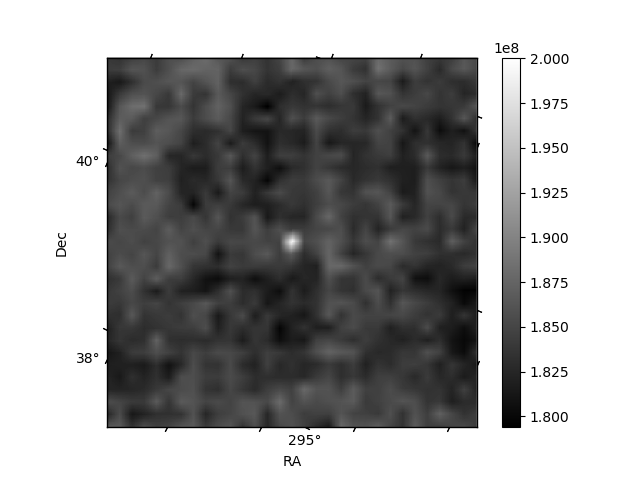
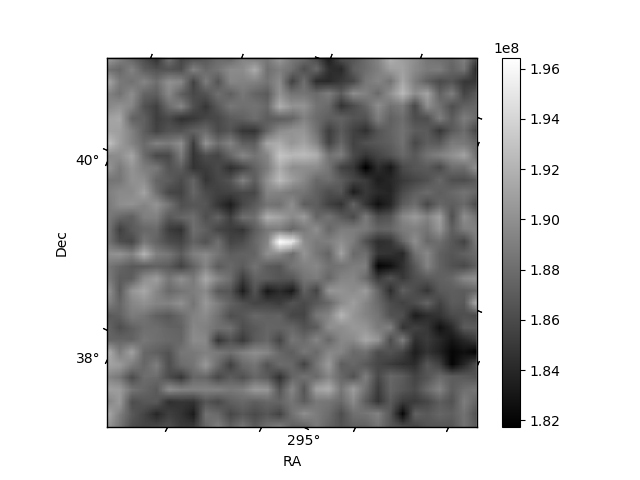
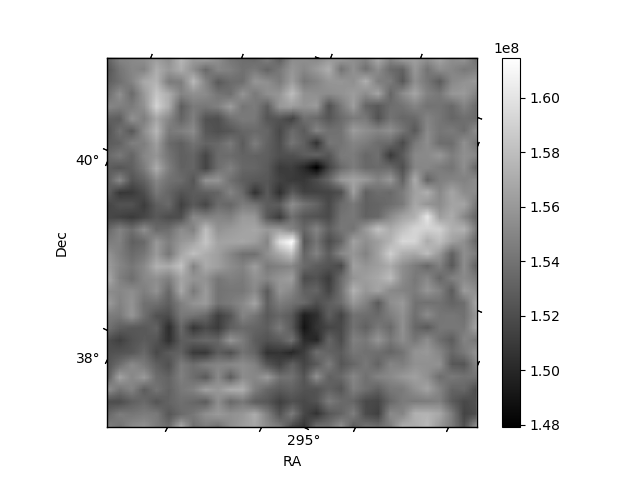
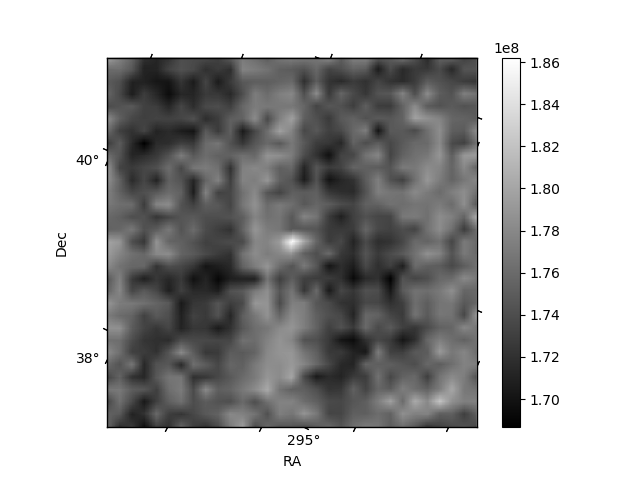
Histogram calculated using DETX and DETY for each event in the final _common_clean file
| Quadrant A | 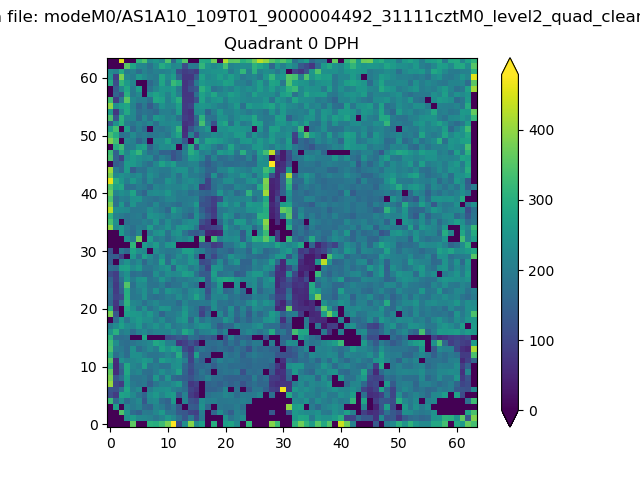 |
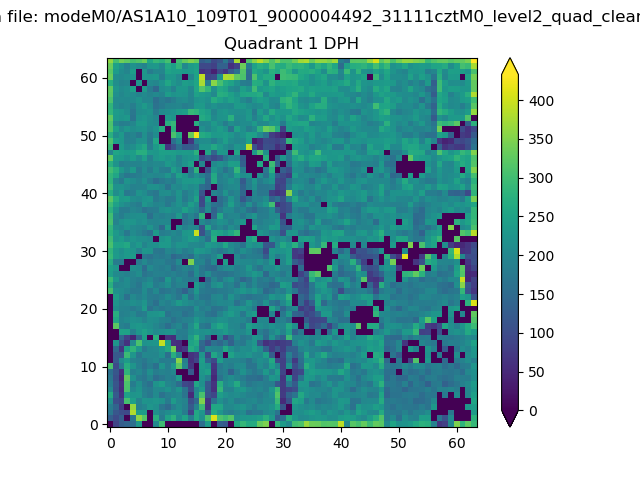 |
Quadrant B |
|---|---|---|---|
| Quadrant D |  |
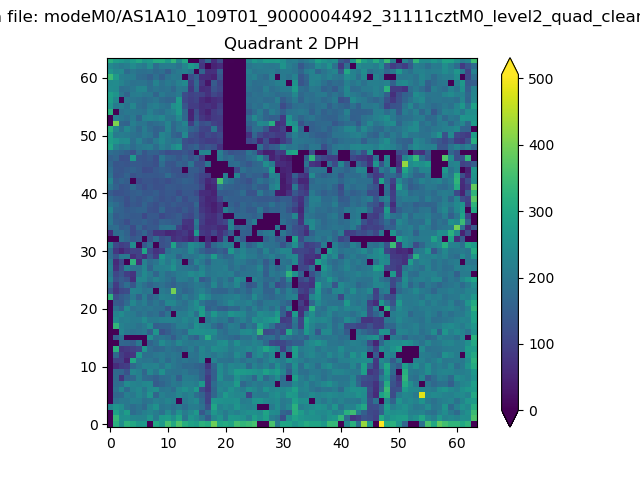 |
Quadrant C |
| Plot type | Count rate plots | Images |
|---|---|---|
| Comparison with Poisson distribution Blue bars denote a histogram of data divided into 1 sec bins. Red curve is a Poisson curve with rate = median count rate of data. |
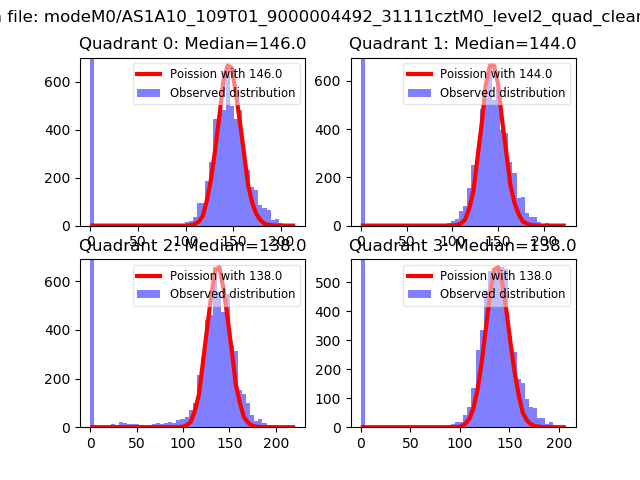 |
 |
| Quadrant-wise count rates Data is divided into 100 sec bins |
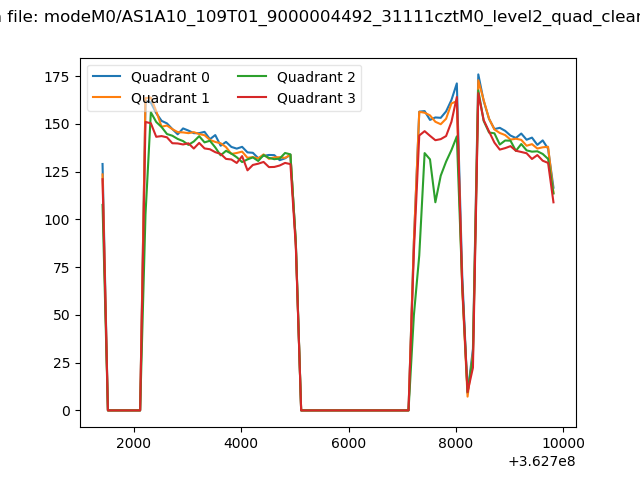 |
|
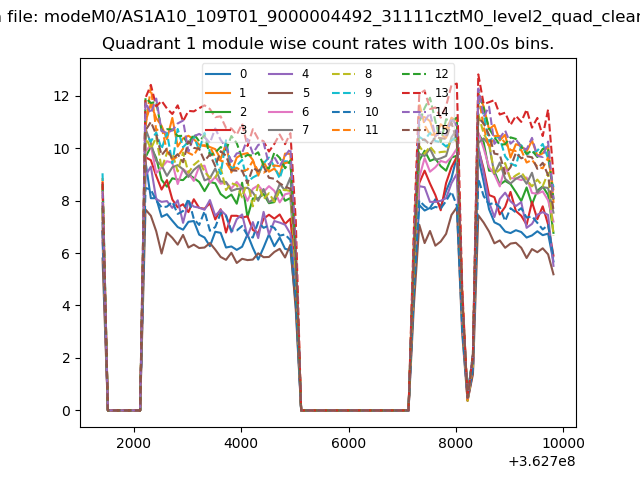
| Module-wise count rates for Quadrant A Data is divided into 100 sec bins |
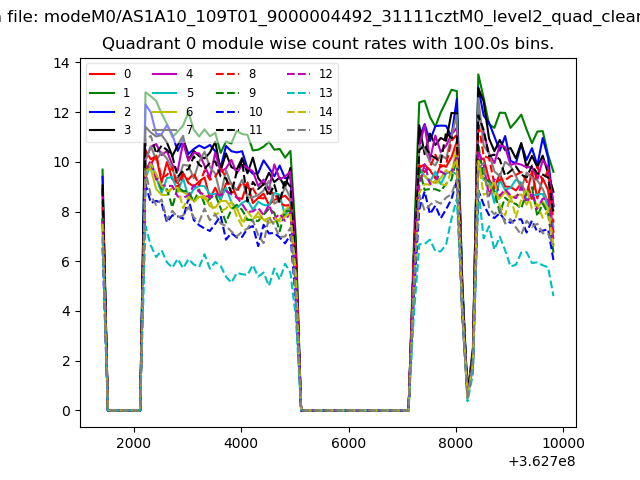 |
 |
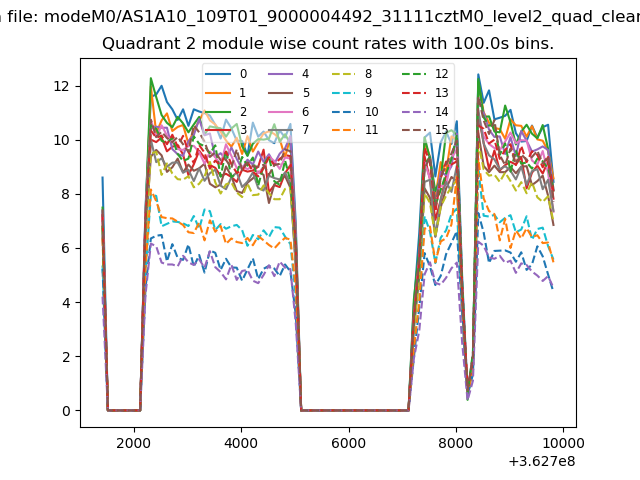
| Module-wise count rates for Quadrant B Data is divided into 100 sec bins |
 |
 |
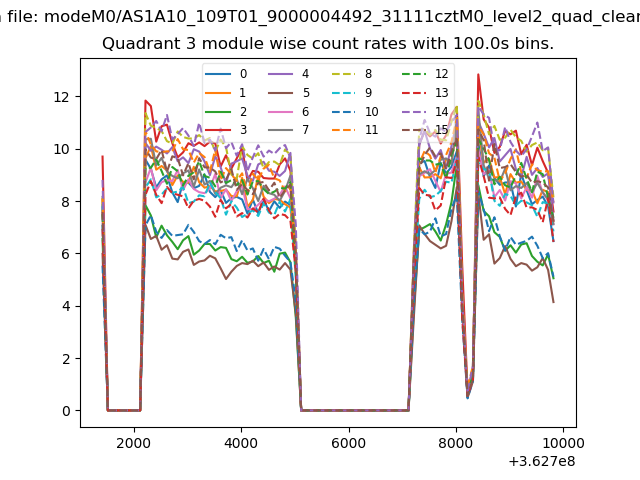
| Module-wise count rates for Quadrant C Data is divided into 100 sec bins |
 |
 |
| Module-wise count rates for Quadrant D Data is divided into 100 sec bins |
 |
 |
| Parameter | Plot |
|---|---|
| CZT HV Monitor | 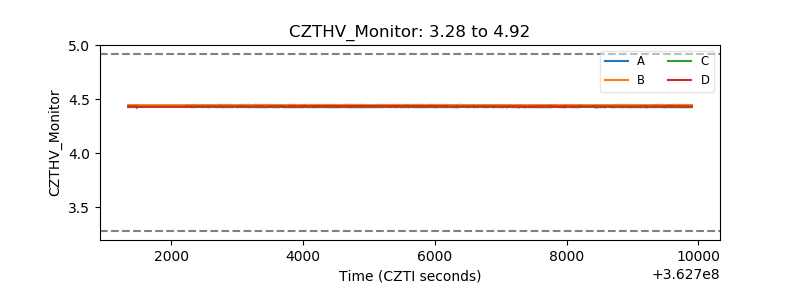 |
| D_VDD | 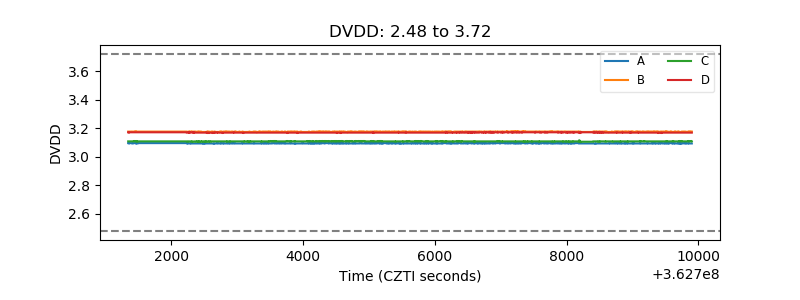 |
| Temperature 1 | 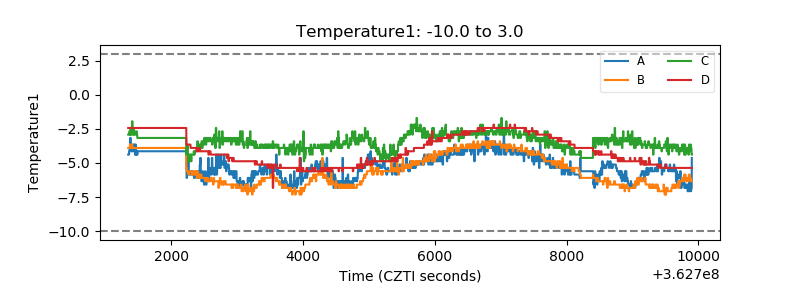 |
| Veto HV Monitor | 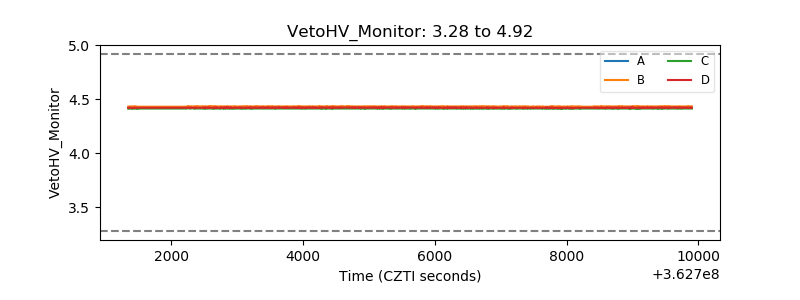 |
| Veto LLD |  |
| Alpha Counter | 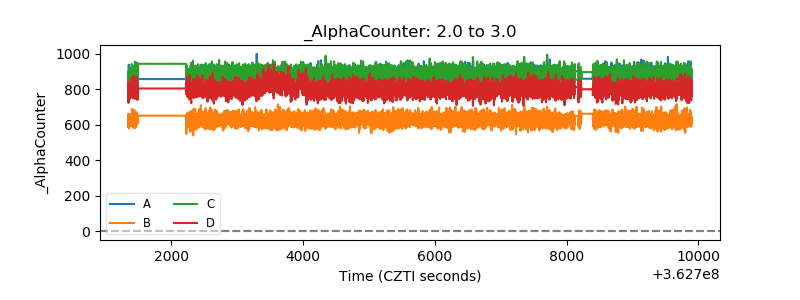 |
| _CPM_Rate | 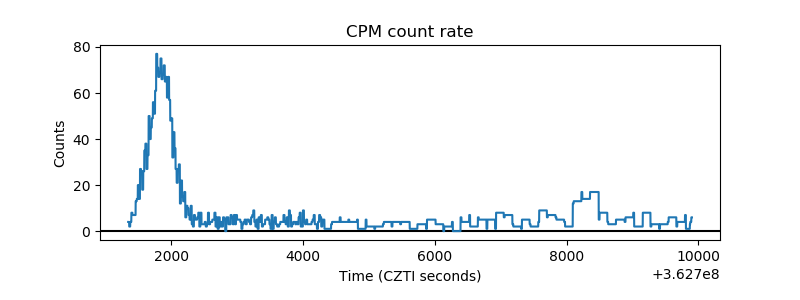 |
| CZT Counter | 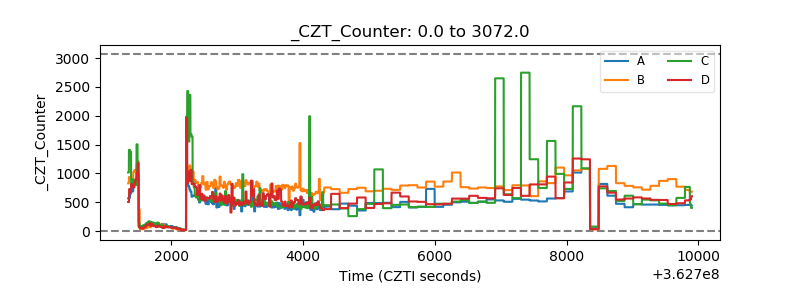 |
| +2.5 Volts monitor |  |
| +5 Volts monitor |  |
| _ROLL_ROT | 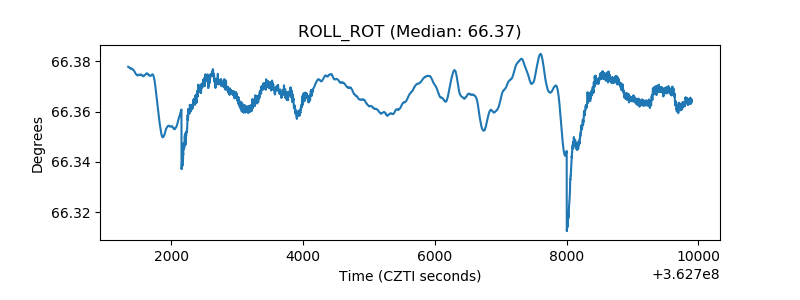 |
| _Roll_DEC | 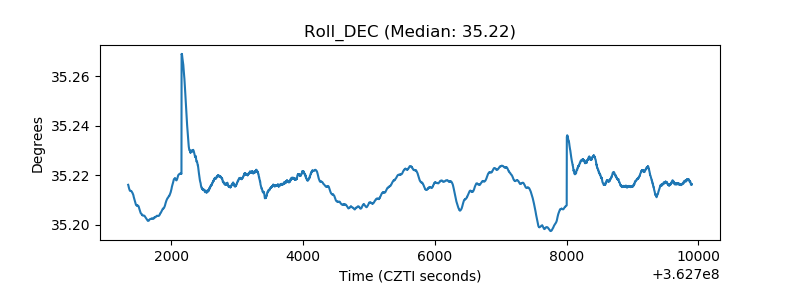 |
| _Roll_RA | 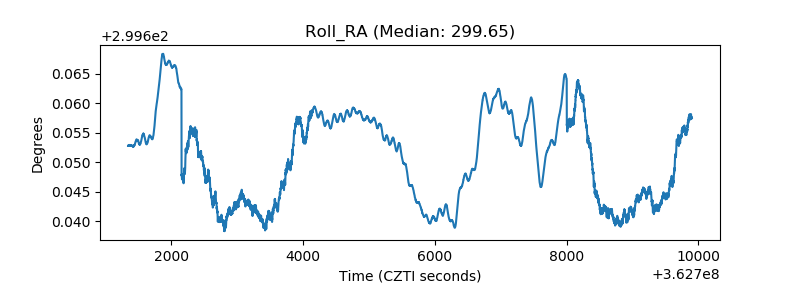 |
| Veto Counter | 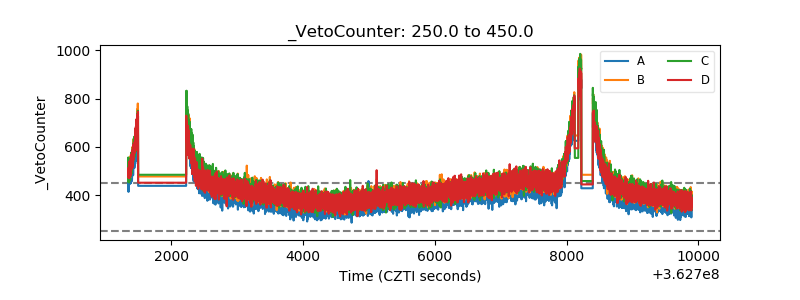 |