| Param | Original file | Final file |
|---|---|---|
| Filename | modeM0/AS1A10_109T01_9000004492_31112cztM0_level2.evt | modeM0/AS1A10_109T01_9000004492_31112cztM0_level2_quad_clean.evt |
| Size (bytes) | 600,171,840 | 116,478,720 |
| Size | 572.4 MB | 111.1 MB |
| Events in quadrant A | 3,629,069 | 770,484 |
| Events in quadrant B | 5,822,123 | 760,026 |
| Events in quadrant C | 3,867,118 | 741,009 |
| Events in quadrant D | 4,346,191 | 730,550 |
| Mode M0 | |||
|---|---|---|---|
| Quadrant | BADHDUFLAG | Total packets | Discarded packets |
| A | 0 | 15667 | 1 |
| B | 0 | 22970 | 1 |
| C | 0 | 16217 | 1 |
| D | 0 | 17665 | 1 |
| Mode SS | |||
|---|---|---|---|
| Quadrant | BADHDUFLAG | Total packets | Discarded packets |
| A | 0 | 152 | 0 |
| B | 0 | 152 | 0 |
| C | 0 | 152 | 0 |
| D | 0 | 152 | 0 |
| Mode M9 | |||
|---|---|---|---|
| Quadrant | BADHDUFLAG | Total packets | Discarded packets |
| A | 0 | 2 | 0 |
| B | 0 | 2 | 0 |
| C | 0 | 2 | 0 |
| D | 0 | 2 | 0 |
| Quadrant | Total seconds | Saturated seconds | Saturation percentage |
|---|---|---|---|
| A | 7557 | 126 | 1.667328% |
| B | 7557 | 244 | 3.228794% |
| C | 7557 | 235 | 3.109700% |
| D | 7558 | 202 | 2.672665% |
Noise dominated data is calculated using 1-second bins in cleaned event files. If a bin has >2000 counts, and if more than 50% of those come from <1% of pixels, then it is considered to be noise-dominated and hence unusable.
| Quadrant | # 1 sec bins | Bins with >0 counts | Bins with >2000 counts | High rate bins dominated by noise | Noise dominated (total time) | Noise dominated (detector-on time) | Marked lightcurve |
|---|---|---|---|---|---|---|---|
| A | 7687 | 7558 | 0 | 0 | 0.00% | 0.00% | 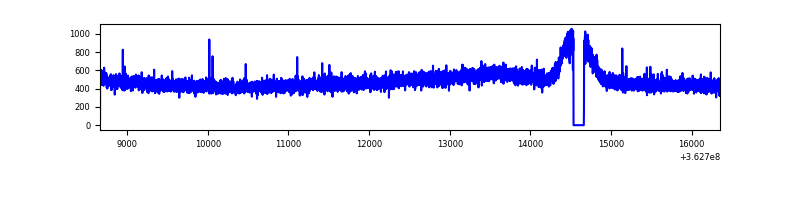 |
| B | 7687 | 7558 | 0 | 0 | 0.00% | 0.00% |  |
| C | 7687 | 7558 | 5 | 5 | 0.07% | 0.07% | 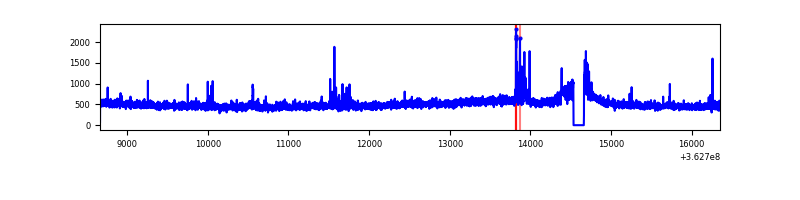 |
| D | 7688 | 7559 | 98 | 98 | 1.27% | 1.30% |  |
Top three noisy pixels from each quadrant. If the there are fewer than three noisy pixels in the level2.evt file, extra rows are filled as -1
| Pixel properties | Quadrant properties | ||||||
|---|---|---|---|---|---|---|---|
| Quadrant | DetID | PixID | Counts | Sigma | Mean | Median | Sigma |
| A | 13 | 254 | 12154 | 59.16 | 941 | 923 | 189.8 |
| A | 3 | 137 | 9965 | 47.63 | 941 | 923 | 189.8 |
| A | 0 | 226 | 7640 | 35.39 | 941 | 923 | 189.8 |
| B | 6 | 159 | 2097840 | 11746.44 | 923 | 903 | 178.5 |
| B | 0 | 190 | 56717 | 312.65 | 923 | 903 | 178.5 |
| B | 12 | 111 | 22877 | 123.09 | 923 | 903 | 178.5 |
| C | 14 | 238 | 144764 | 671.12 | 906 | 914 | 214.3 |
| C | 0 | 10 | 85405 | 394.19 | 906 | 914 | 214.3 |
| C | 10 | 22 | 63881 | 293.77 | 906 | 914 | 214.3 |
| D | 8 | 195 | 388239 | 1656.5 | 902 | 886 | 233.8 |
| D | 14 | 50 | 297579 | 1268.79 | 902 | 886 | 233.8 |
| D | 13 | 174 | 210372 | 895.86 | 902 | 886 | 233.8 |
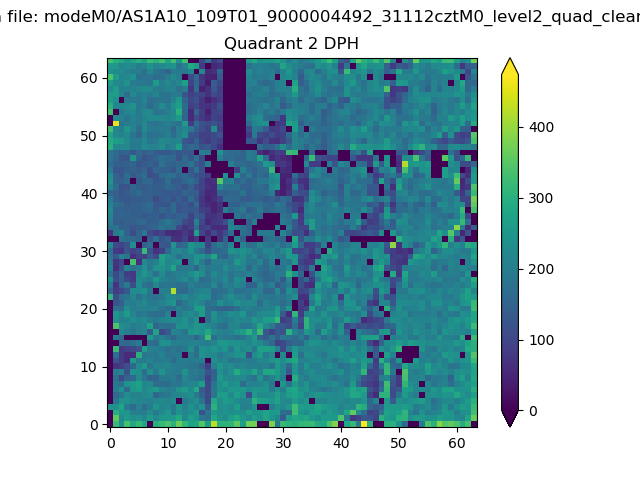
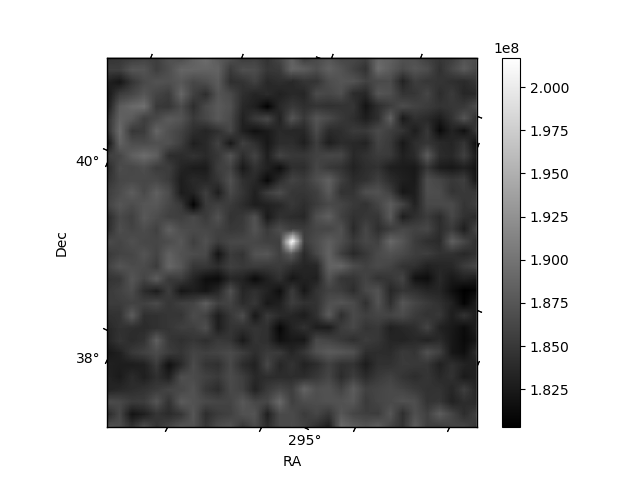
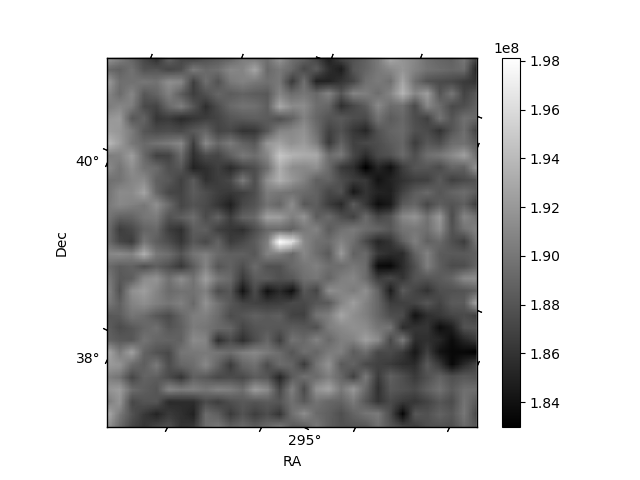
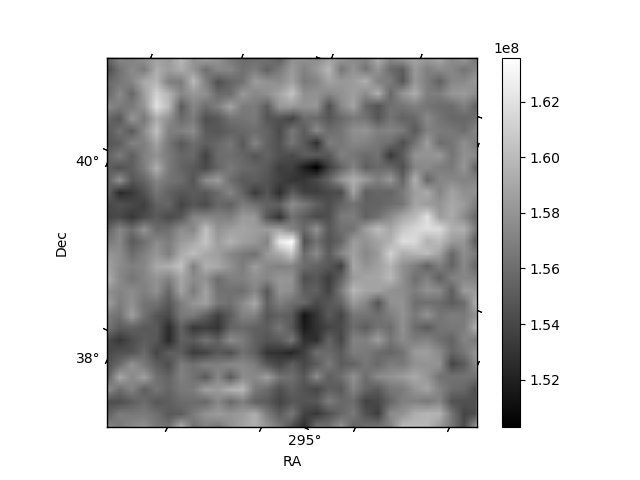
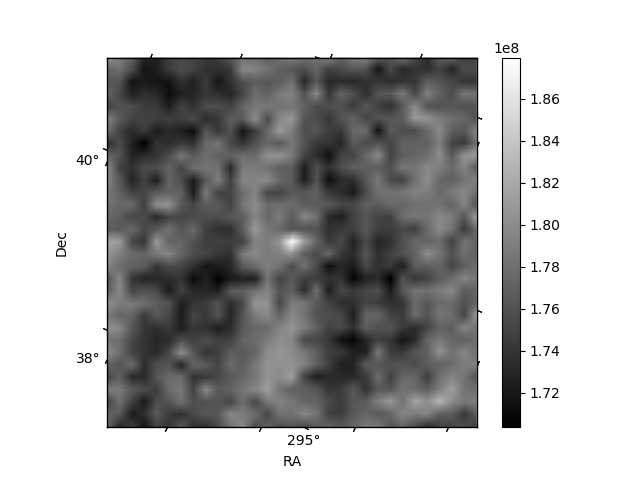
Histogram calculated using DETX and DETY for each event in the final _common_clean file
| Quadrant A | 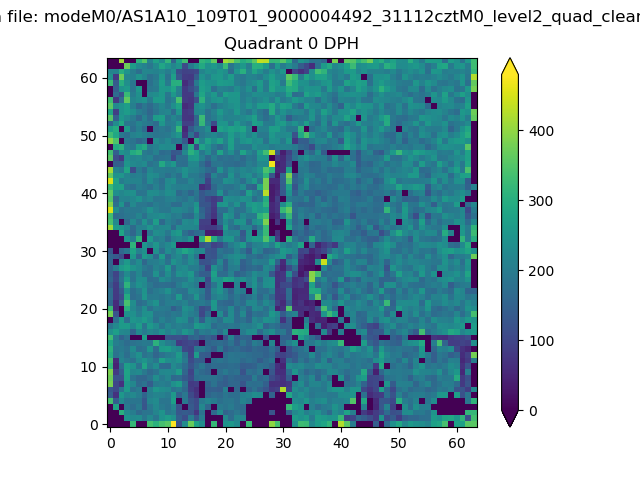 |
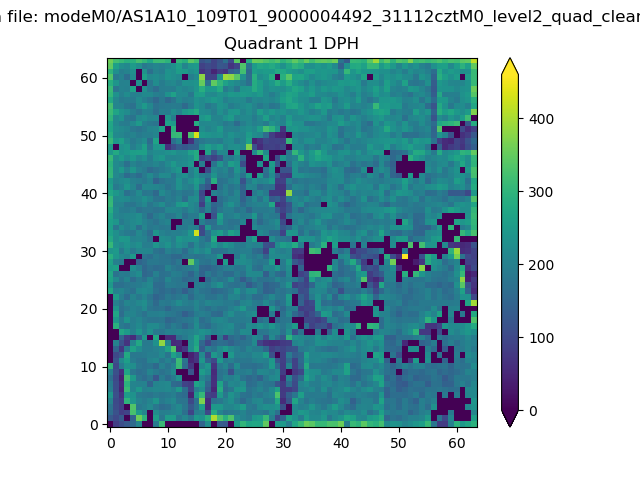 |
Quadrant B |
|---|---|---|---|
| Quadrant D | 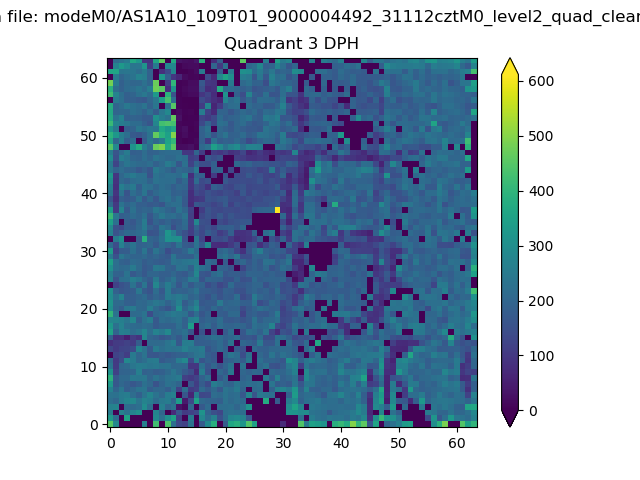 |
 |
Quadrant C |
| Plot type | Count rate plots | Images |
|---|---|---|
| Comparison with Poisson distribution Blue bars denote a histogram of data divided into 1 sec bins. Red curve is a Poisson curve with rate = median count rate of data. |
 |
 |
| Quadrant-wise count rates Data is divided into 100 sec bins |
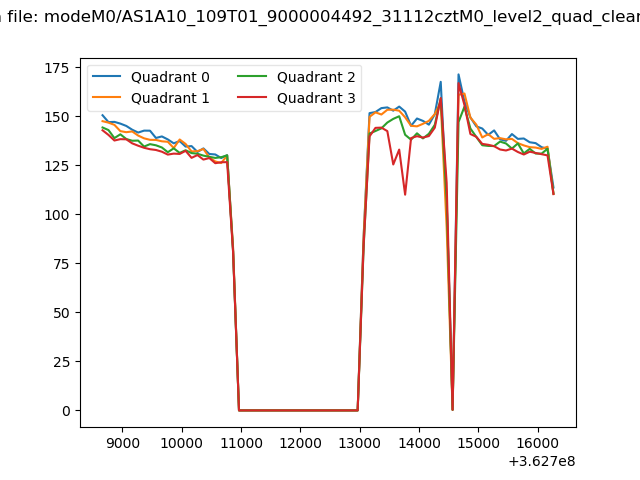 |
|
| Module-wise count rates for Quadrant A Data is divided into 100 sec bins |
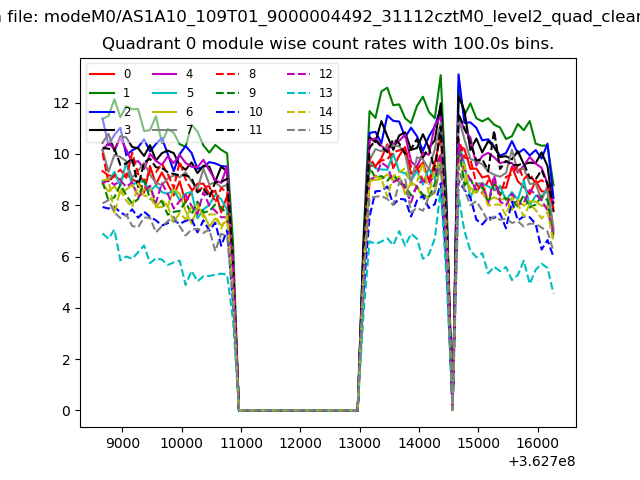 |
 |
| Module-wise count rates for Quadrant B Data is divided into 100 sec bins |
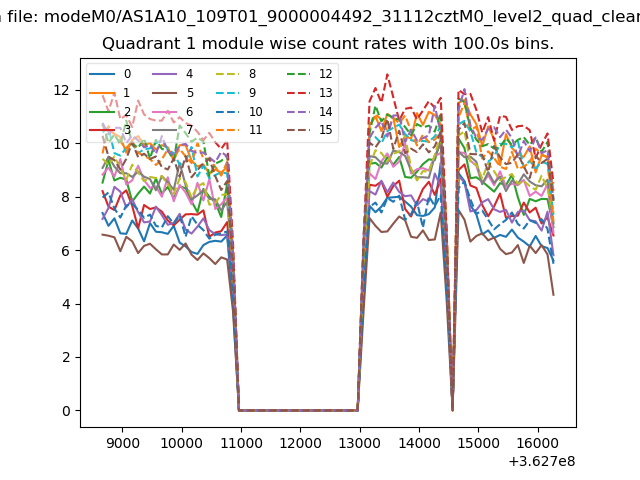 |
 |
| Module-wise count rates for Quadrant C Data is divided into 100 sec bins |
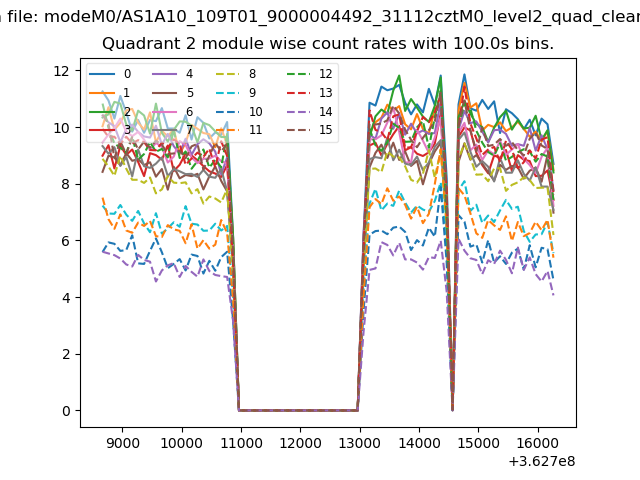 |
 |
| Module-wise count rates for Quadrant D Data is divided into 100 sec bins |
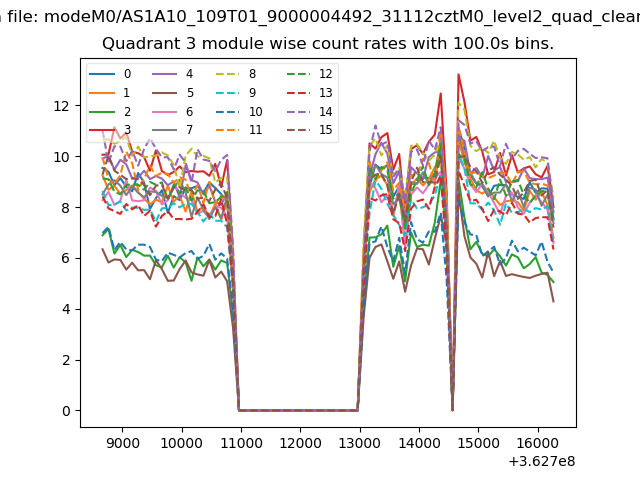 |
 |
| Parameter | Plot |
|---|---|
| CZT HV Monitor | 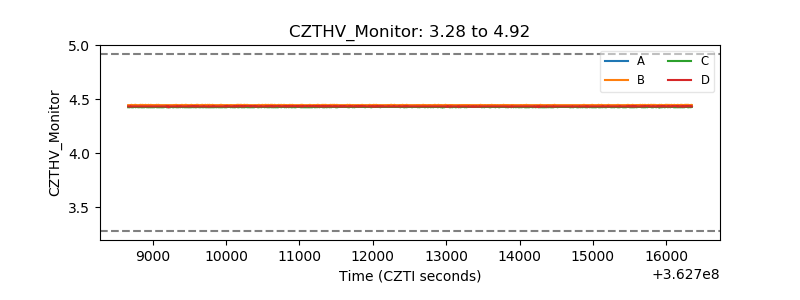 |
| D_VDD | 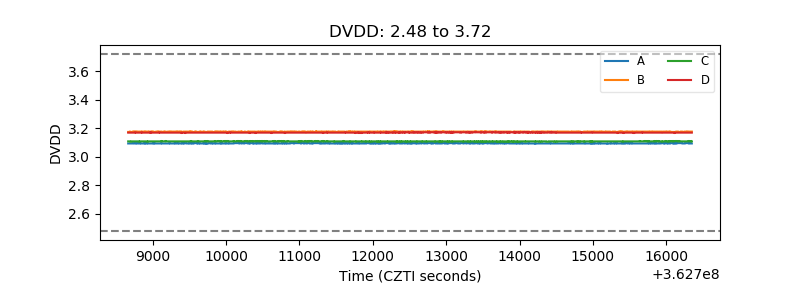 |
| Temperature 1 | 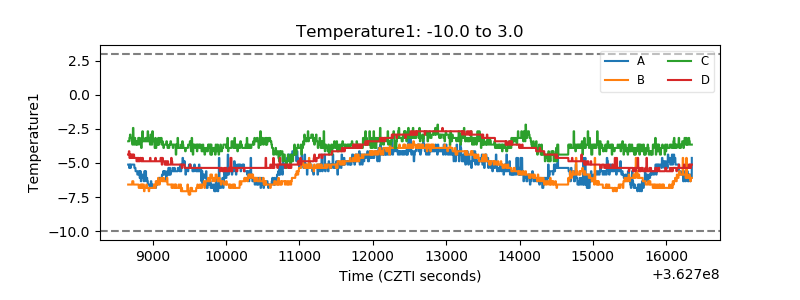 |
| Veto HV Monitor |  |
| Veto LLD | 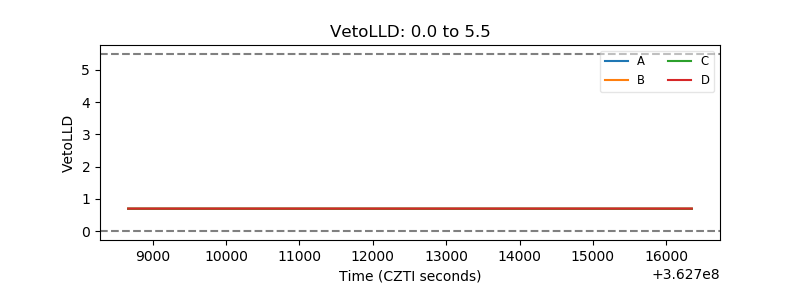 |
| Alpha Counter | 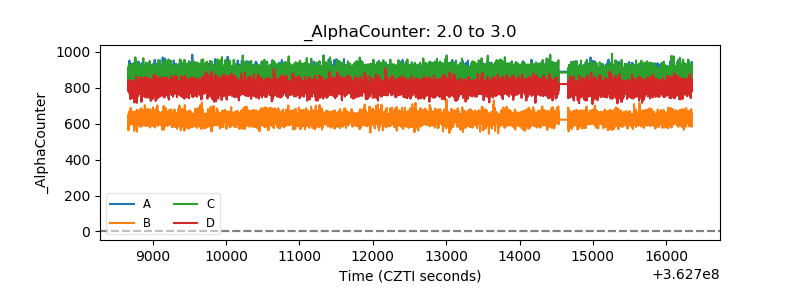 |
| _CPM_Rate | 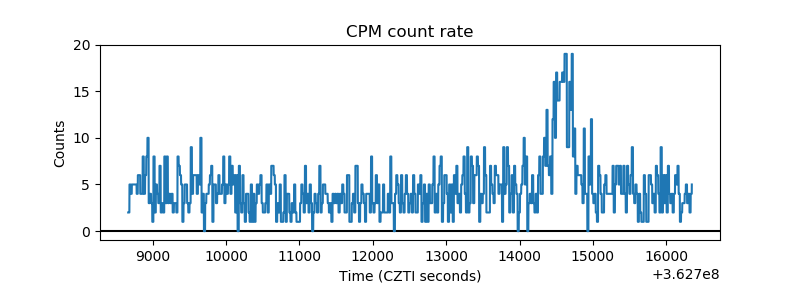 |
| CZT Counter | 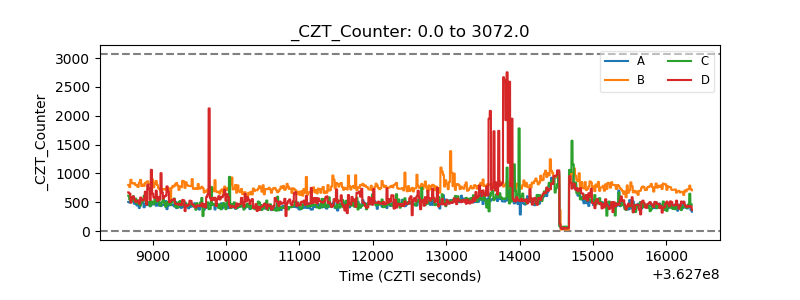 |
| +2.5 Volts monitor |  |
| +5 Volts monitor |  |
| _ROLL_ROT | 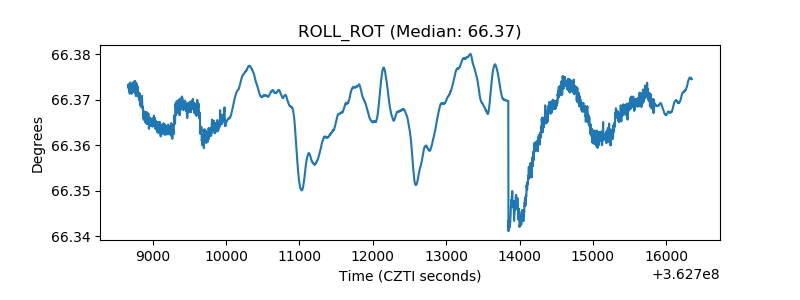 |
| _Roll_DEC |  |
| _Roll_RA | 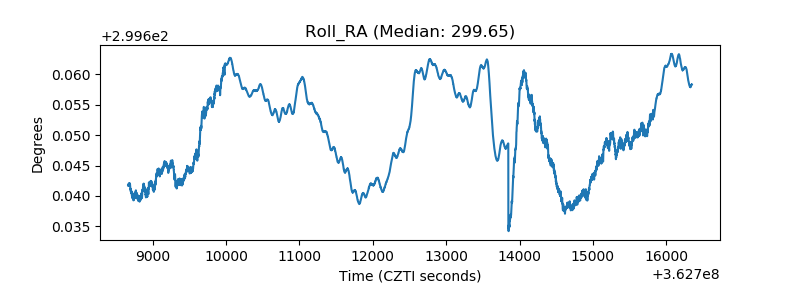 |
| Veto Counter | 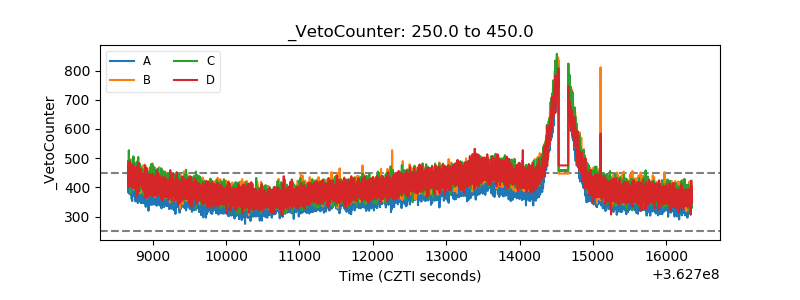 |