| Param | Original file | Final file |
|---|---|---|
| Filename | modeM0/AS1A10_109T01_9000004492_31116cztM0_level2.evt | modeM0/AS1A10_109T01_9000004492_31116cztM0_level2_quad_clean.evt |
| Size (bytes) | 532,572,480 | 79,522,560 |
| Size | 507.9 MB | 75.8 MB |
| Events in quadrant A | 3,336,702 | 497,737 |
| Events in quadrant B | 5,265,138 | 494,181 |
| Events in quadrant C | 3,559,621 | 472,380 |
| Events in quadrant D | 3,511,350 | 474,625 |
| Mode M0 | |||
|---|---|---|---|
| Quadrant | BADHDUFLAG | Total packets | Discarded packets |
| A | 0 | 13919 | 3 |
| B | 0 | 20336 | 2 |
| C | 0 | 14522 | 2 |
| D | 0 | 14488 | 2 |
| Mode SS | |||
|---|---|---|---|
| Quadrant | BADHDUFLAG | Total packets | Discarded packets |
| A | 0 | 136 | 0 |
| B | 0 | 136 | 0 |
| C | 0 | 136 | 0 |
| D | 0 | 136 | 0 |
| Mode M9 | |||
|---|---|---|---|
| Quadrant | BADHDUFLAG | Total packets | Discarded packets |
| A | 0 | 12 | 0 |
| B | 0 | 13 | 0 |
| C | 0 | 13 | 0 |
| D | 0 | 13 | 0 |
| Quadrant | Total seconds | Saturated seconds | Saturation percentage |
|---|---|---|---|
| A | 6731 | 70 | 1.039964% |
| B | 6731 | 128 | 1.901649% |
| C | 6731 | 155 | 2.302778% |
| D | 6731 | 79 | 1.173674% |
Noise dominated data is calculated using 1-second bins in cleaned event files. If a bin has >2000 counts, and if more than 50% of those come from <1% of pixels, then it is considered to be noise-dominated and hence unusable.
| Quadrant | # 1 sec bins | Bins with >0 counts | Bins with >2000 counts | High rate bins dominated by noise | Noise dominated (total time) | Noise dominated (detector-on time) | Marked lightcurve |
|---|---|---|---|---|---|---|---|
| A | 7631 | 6732 | 1 | 1 | 0.01% | 0.01% | 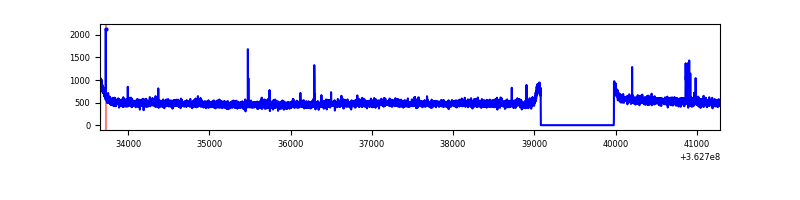 |
| B | 7631 | 6732 | 2 | 2 | 0.03% | 0.03% | 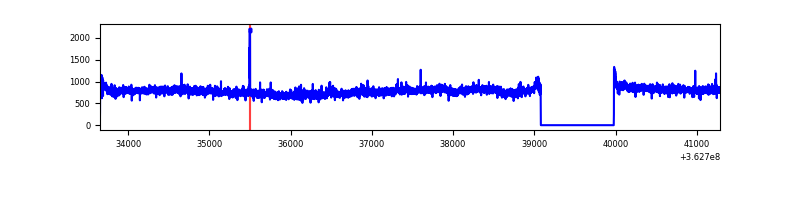 |
| C | 7631 | 6732 | 27 | 27 | 0.35% | 0.40% | 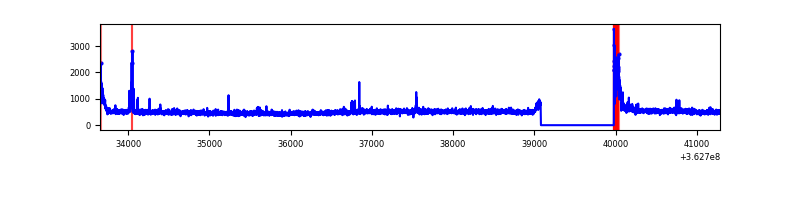 |
| D | 7631 | 6732 | 22 | 22 | 0.29% | 0.33% | 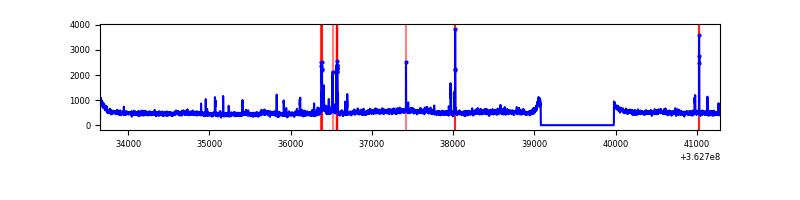 |
Top three noisy pixels from each quadrant. If the there are fewer than three noisy pixels in the level2.evt file, extra rows are filled as -1
| Pixel properties | Quadrant properties | ||||||
|---|---|---|---|---|---|---|---|
| Quadrant | DetID | PixID | Counts | Sigma | Mean | Median | Sigma |
| A | 8 | 144 | 35448 | 202.04 | 856 | 841 | 171.3 |
| A | 13 | 254 | 11606 | 62.85 | 856 | 841 | 171.3 |
| A | 3 | 137 | 8822 | 46.59 | 856 | 841 | 171.3 |
| B | 6 | 159 | 1892661 | 11598.24 | 840 | 819 | 163.1 |
| B | 0 | 230 | 29422 | 175.36 | 840 | 819 | 163.1 |
| B | 12 | 111 | 21061 | 124.1 | 840 | 819 | 163.1 |
| C | 0 | 10 | 196831 | 1034.3 | 809 | 815 | 189.5 |
| C | 14 | 238 | 130164 | 682.52 | 809 | 815 | 189.5 |
| C | 15 | 159 | 31207 | 160.37 | 809 | 815 | 189.5 |
| D | 8 | 195 | 300639 | 1529.89 | 825 | 803 | 196.0 |
| D | 13 | 174 | 72246 | 364.53 | 825 | 803 | 196.0 |
| D | 2 | 234 | 22650 | 111.47 | 825 | 803 | 196.0 |
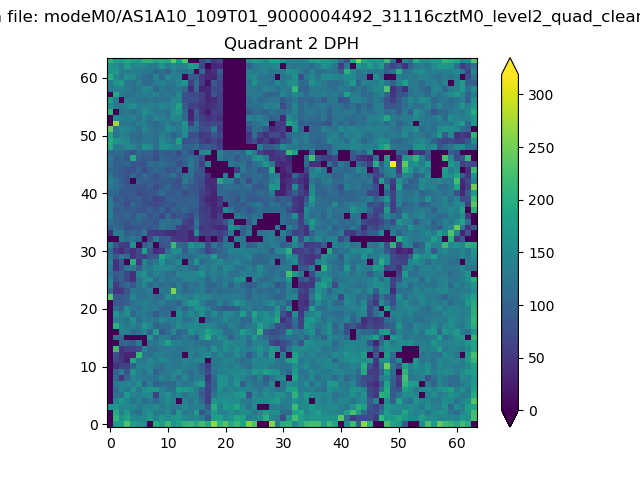
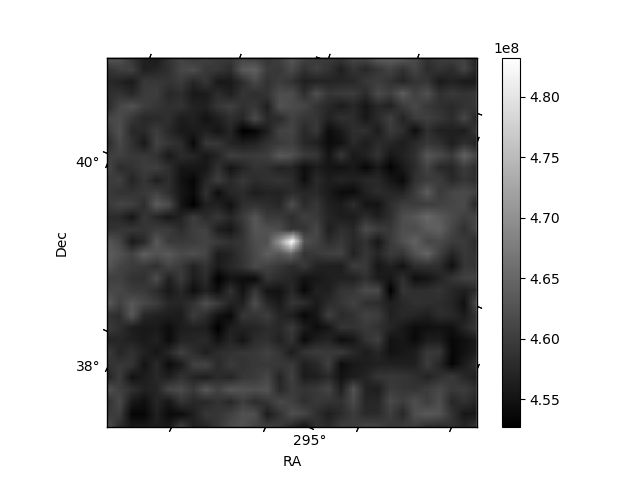
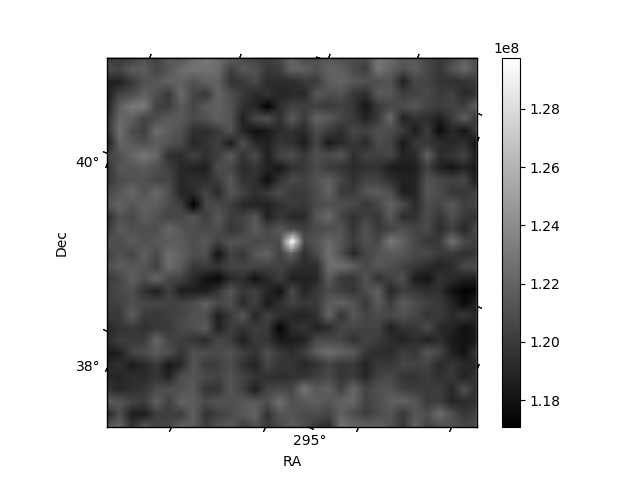
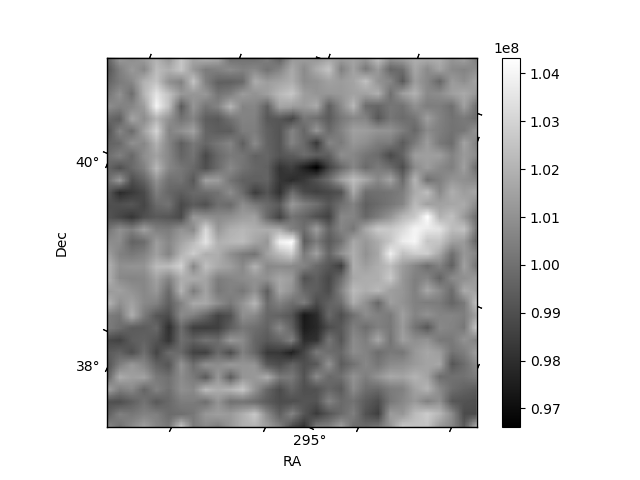
Histogram calculated using DETX and DETY for each event in the final _common_clean file
| Quadrant A | 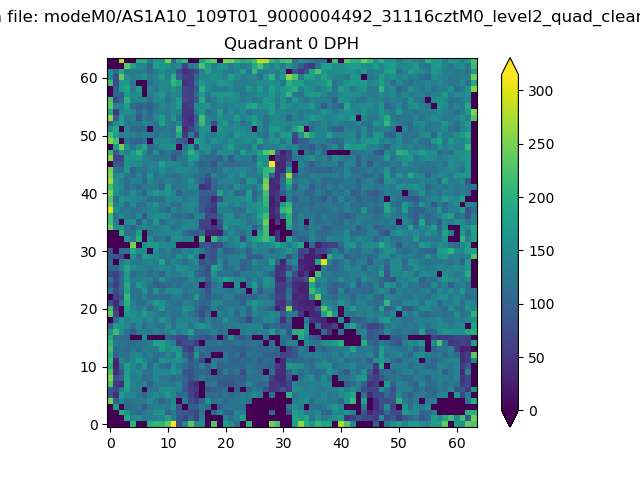 |
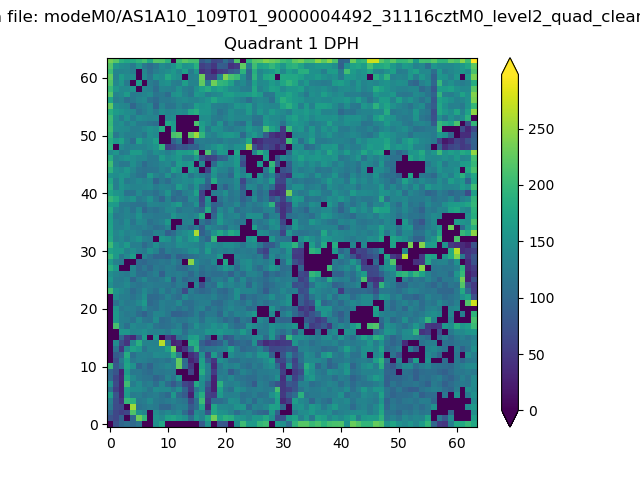 |
Quadrant B |
|---|---|---|---|
| Quadrant D | 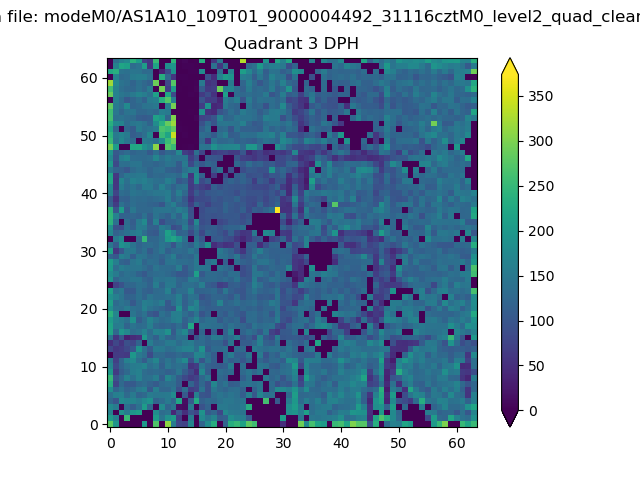 |
 |
Quadrant C |
| Plot type | Count rate plots | Images |
|---|---|---|
| Comparison with Poisson distribution Blue bars denote a histogram of data divided into 1 sec bins. Red curve is a Poisson curve with rate = median count rate of data. |
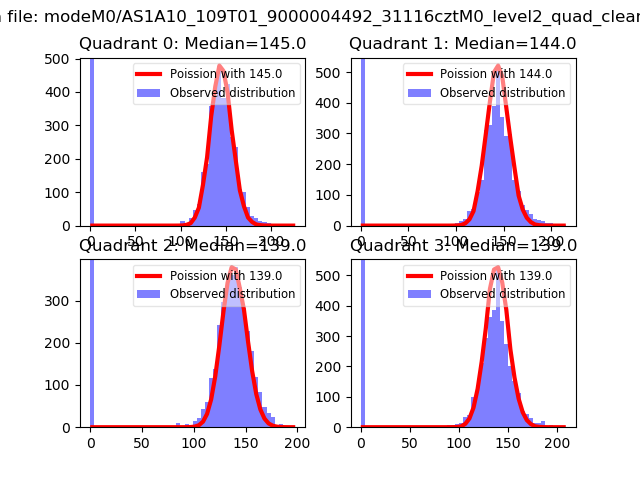 |
 |
| Quadrant-wise count rates Data is divided into 100 sec bins |
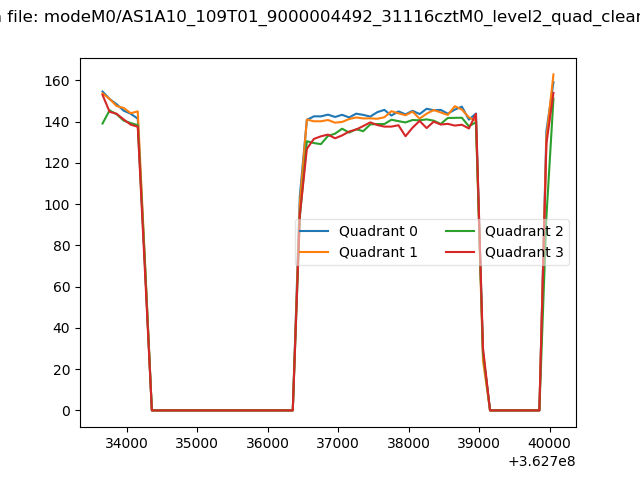 |
|
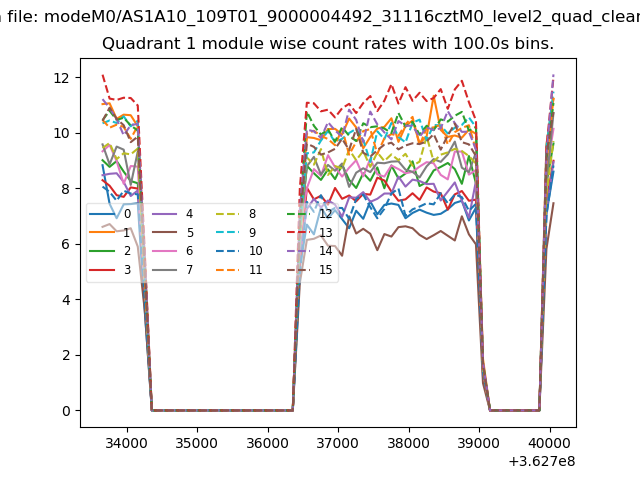
| Module-wise count rates for Quadrant A Data is divided into 100 sec bins |
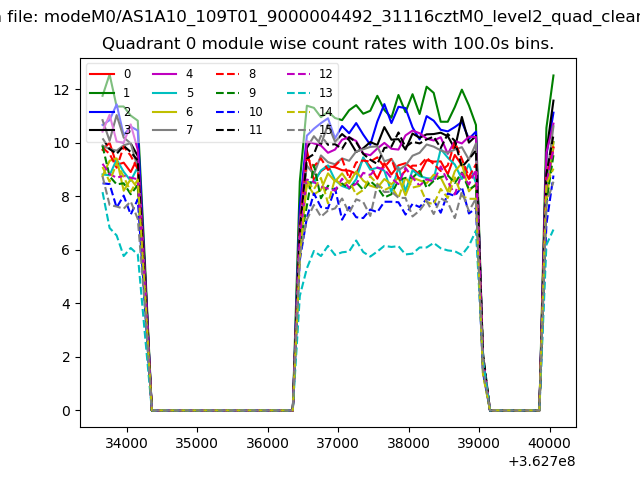 |
 |
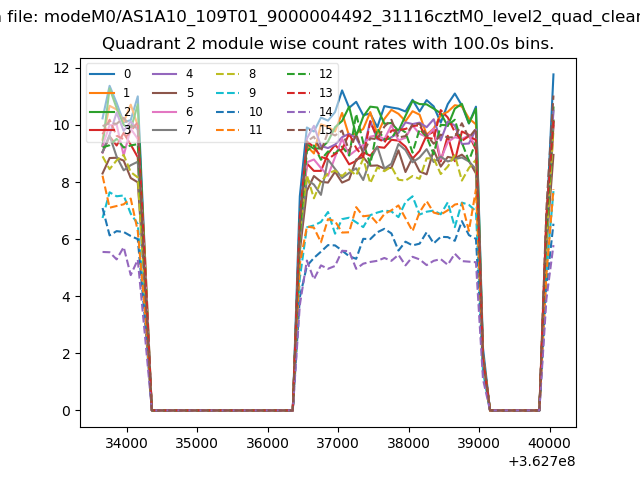
| Module-wise count rates for Quadrant B Data is divided into 100 sec bins |
 |
 |
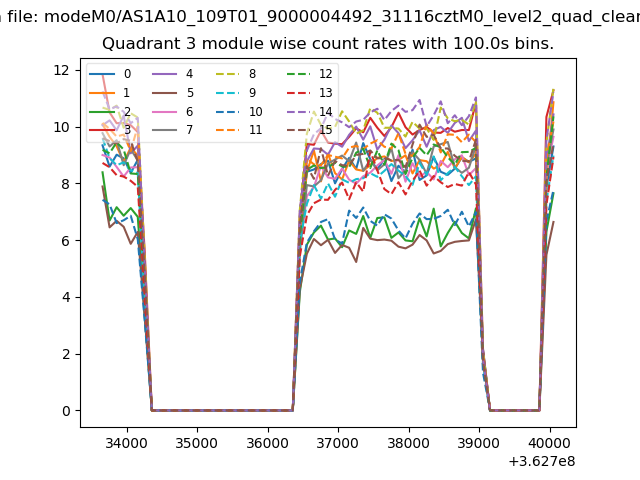
| Module-wise count rates for Quadrant C Data is divided into 100 sec bins |
 |
 |
| Module-wise count rates for Quadrant D Data is divided into 100 sec bins |
 |
 |
| Parameter | Plot |
|---|---|
| CZT HV Monitor | 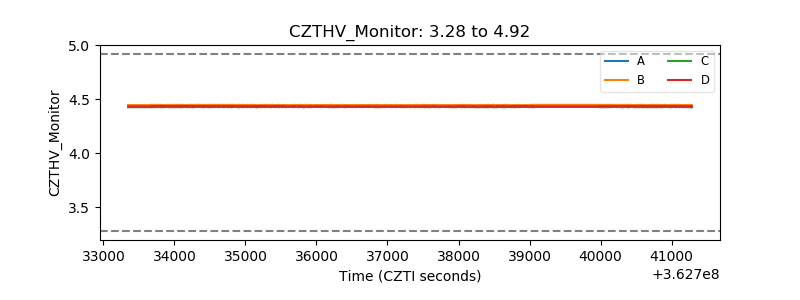 |
| D_VDD |  |
| Temperature 1 |  |
| Veto HV Monitor | 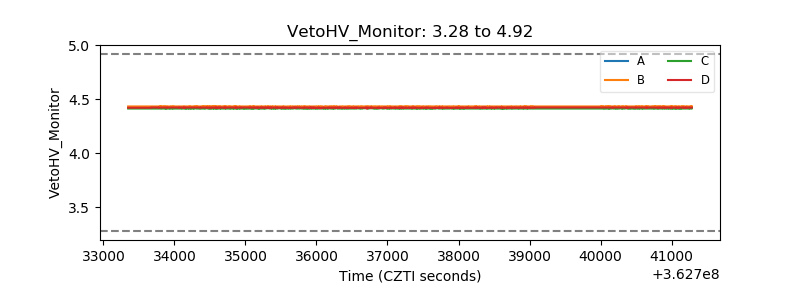 |
| Veto LLD | 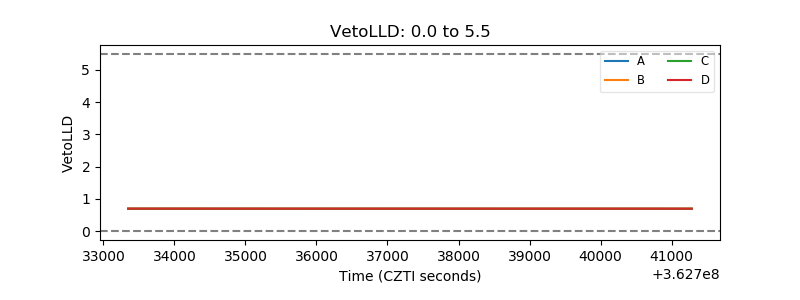 |
| Alpha Counter | 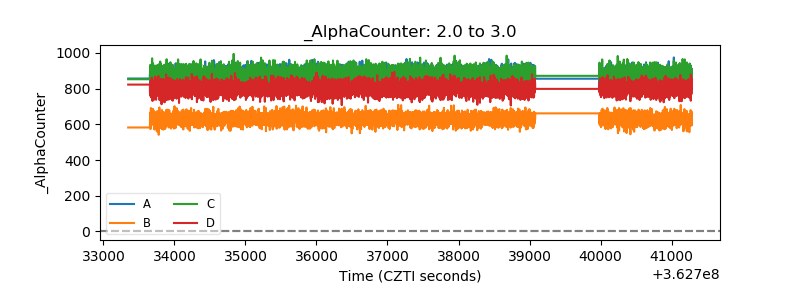 |
| _CPM_Rate | 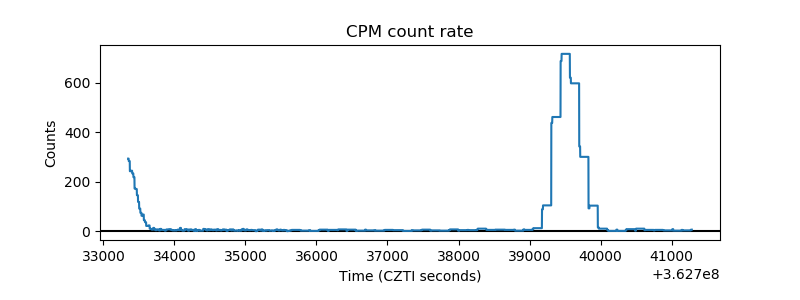 |
| CZT Counter | 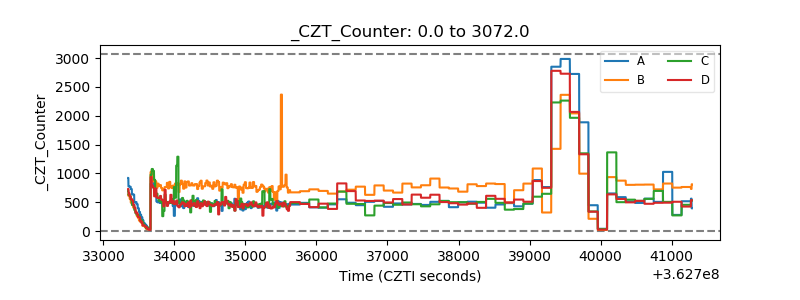 |
| +2.5 Volts monitor |  |
| +5 Volts monitor | 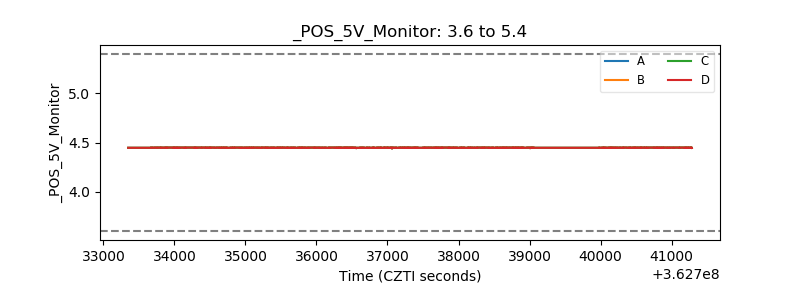 |
| _ROLL_ROT | 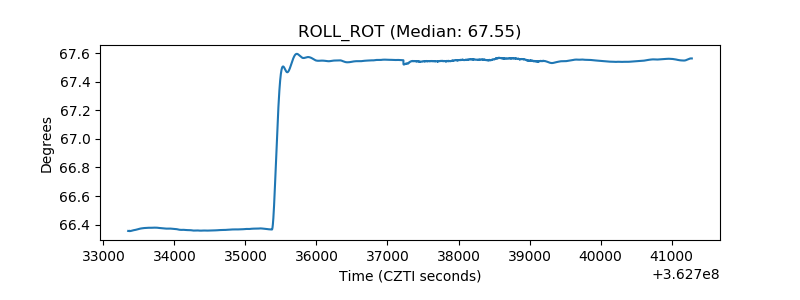 |
| _Roll_DEC | 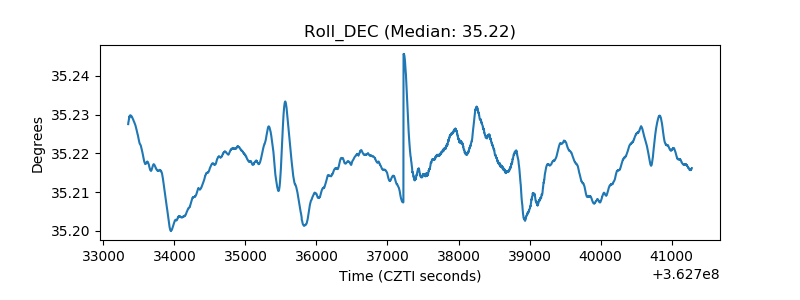 |
| _Roll_RA | 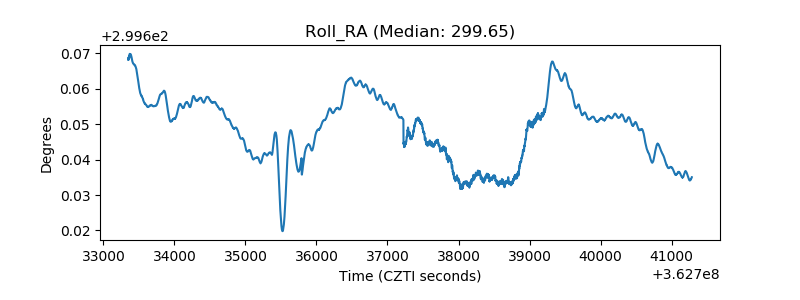 |
| Veto Counter | 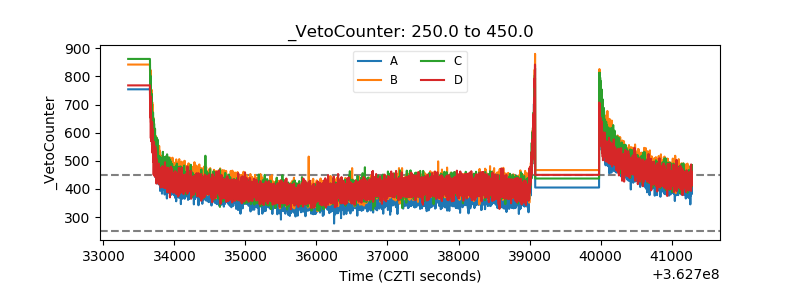 |