| Param | Original file | Final file |
|---|---|---|
| Filename | modeM0/AS1A10_109T01_9000004492_31117cztM0_level2.evt | modeM0/AS1A10_109T01_9000004492_31117cztM0_level2_quad_clean.evt |
| Size (bytes) | 616,089,600 | 85,734,720 |
| Size | 587.5 MB | 81.8 MB |
| Events in quadrant A | 3,706,260 | 541,114 |
| Events in quadrant B | 5,718,021 | 533,674 |
| Events in quadrant C | 4,823,498 | 506,558 |
| Events in quadrant D | 3,923,616 | 513,708 |
| Mode M0 | |||
|---|---|---|---|
| Quadrant | BADHDUFLAG | Total packets | Discarded packets |
| A | 0 | 15312 | 2 |
| B | 0 | 21943 | 2 |
| C | 0 | 18631 | 2 |
| D | 0 | 15840 | 2 |
| Mode SS | |||
|---|---|---|---|
| Quadrant | BADHDUFLAG | Total packets | Discarded packets |
| A | 0 | 146 | 0 |
| B | 0 | 146 | 0 |
| C | 0 | 146 | 0 |
| D | 0 | 146 | 0 |
| Mode M9 | |||
|---|---|---|---|
| Quadrant | BADHDUFLAG | Total packets | Discarded packets |
| A | 0 | 20 | 0 |
| B | 0 | 20 | 0 |
| C | 0 | 20 | 0 |
| D | 0 | 20 | 0 |
| Quadrant | Total seconds | Saturated seconds | Saturation percentage |
|---|---|---|---|
| A | 7202 | 92 | 1.277423% |
| B | 7202 | 157 | 2.179950% |
| C | 7202 | 517 | 7.178562% |
| D | 7202 | 93 | 1.291308% |
Noise dominated data is calculated using 1-second bins in cleaned event files. If a bin has >2000 counts, and if more than 50% of those come from <1% of pixels, then it is considered to be noise-dominated and hence unusable.
| Quadrant | # 1 sec bins | Bins with >0 counts | Bins with >2000 counts | High rate bins dominated by noise | Noise dominated (total time) | Noise dominated (detector-on time) | Marked lightcurve |
|---|---|---|---|---|---|---|---|
| A | 9147 | 7204 | 1 | 1 | 0.01% | 0.01% | 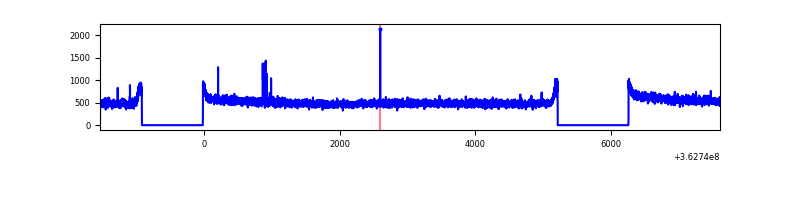 |
| B | 9147 | 7204 | 0 | 0 | 0.00% | 0.00% | 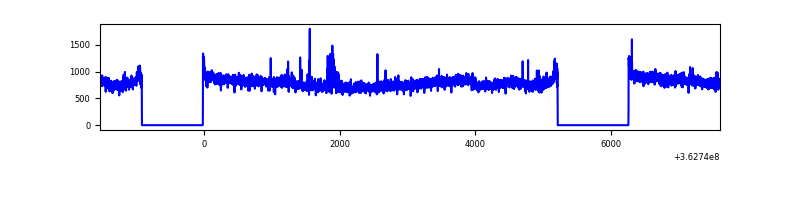 |
| C | 9147 | 7204 | 250 | 250 | 2.73% | 3.47% | 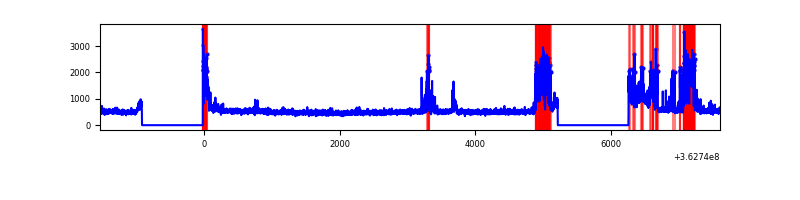 |
| D | 9147 | 7204 | 19 | 19 | 0.21% | 0.26% |  |
Top three noisy pixels from each quadrant. If the there are fewer than three noisy pixels in the level2.evt file, extra rows are filled as -1
| Pixel properties | Quadrant properties | ||||||
|---|---|---|---|---|---|---|---|
| Quadrant | DetID | PixID | Counts | Sigma | Mean | Median | Sigma |
| A | 8 | 144 | 28062 | 142.42 | 954 | 938 | 190.5 |
| A | 13 | 254 | 11413 | 55.0 | 954 | 938 | 190.5 |
| A | 3 | 137 | 9839 | 46.74 | 954 | 938 | 190.5 |
| B | 6 | 159 | 1955368 | 10904.92 | 935 | 914 | 179.2 |
| B | 0 | 190 | 34868 | 189.45 | 935 | 914 | 179.2 |
| B | 0 | 183 | 32658 | 177.12 | 935 | 914 | 179.2 |
| C | 10 | 22 | 669990 | 3217.48 | 891 | 900 | 208.0 |
| C | 15 | 208 | 307361 | 1473.69 | 891 | 900 | 208.0 |
| C | 0 | 10 | 196885 | 942.44 | 891 | 900 | 208.0 |
| D | 8 | 195 | 335513 | 1426.7 | 911 | 895 | 234.5 |
| D | 13 | 174 | 51690 | 216.57 | 911 | 895 | 234.5 |
| D | 2 | 250 | 37896 | 157.76 | 911 | 895 | 234.5 |
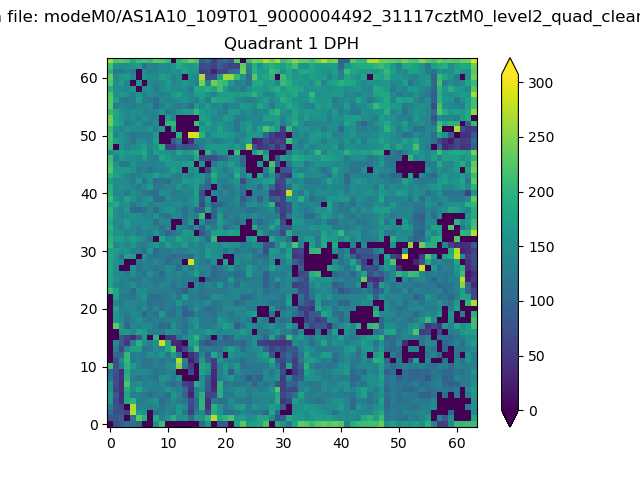
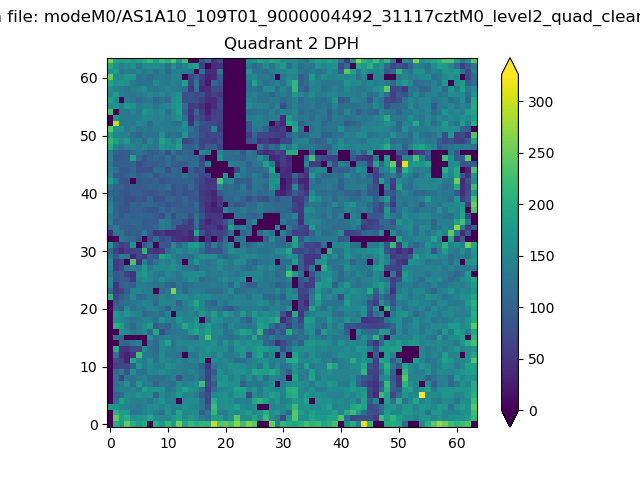
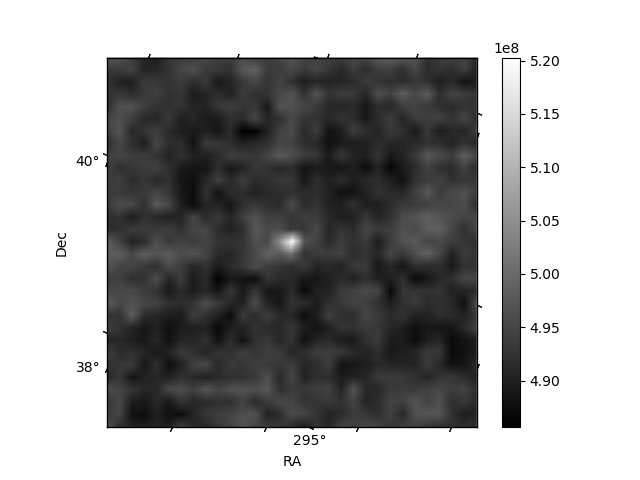
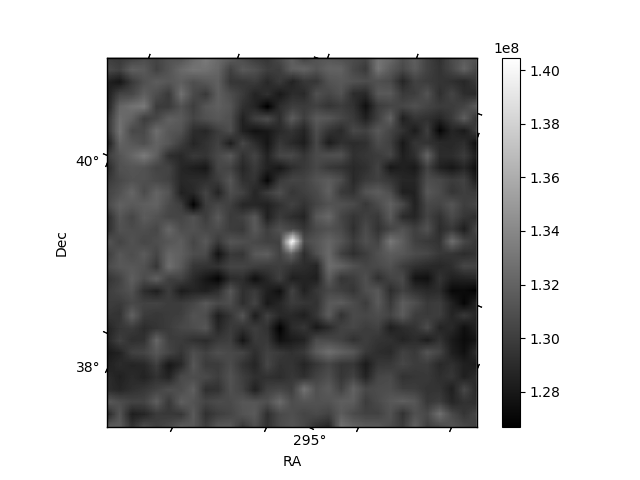
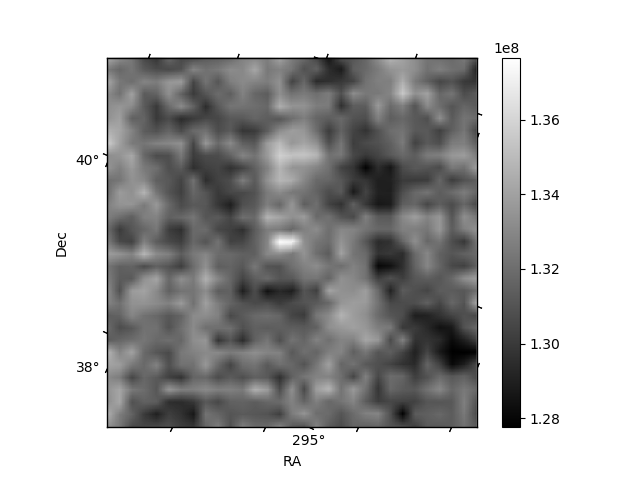
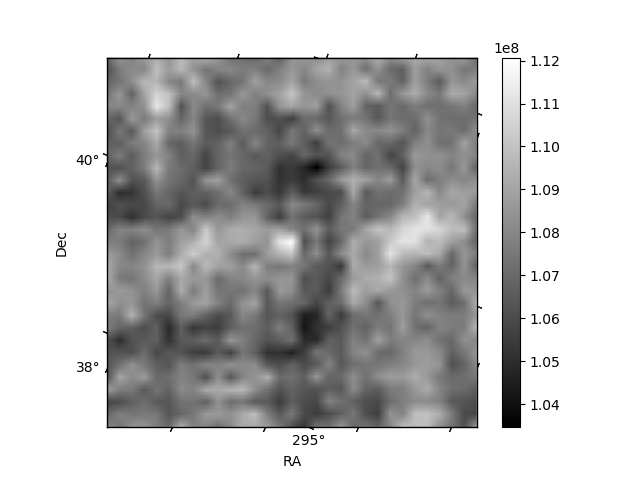
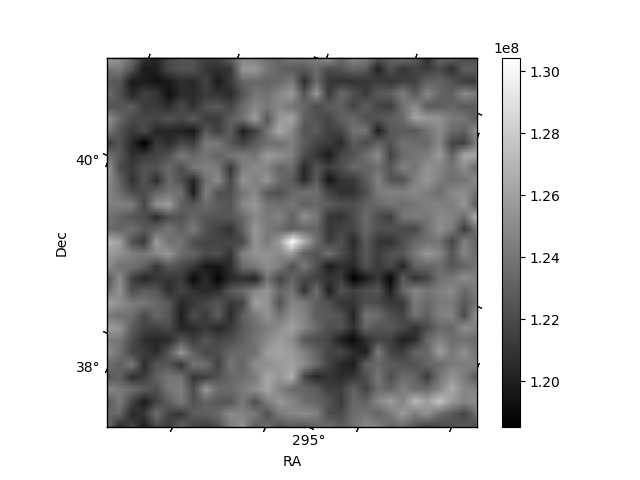
Histogram calculated using DETX and DETY for each event in the final _common_clean file
| Quadrant A | 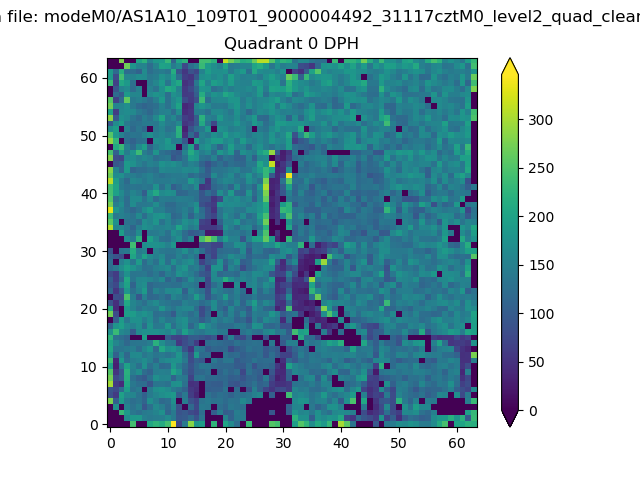 |
 |
Quadrant B |
|---|---|---|---|
| Quadrant D | 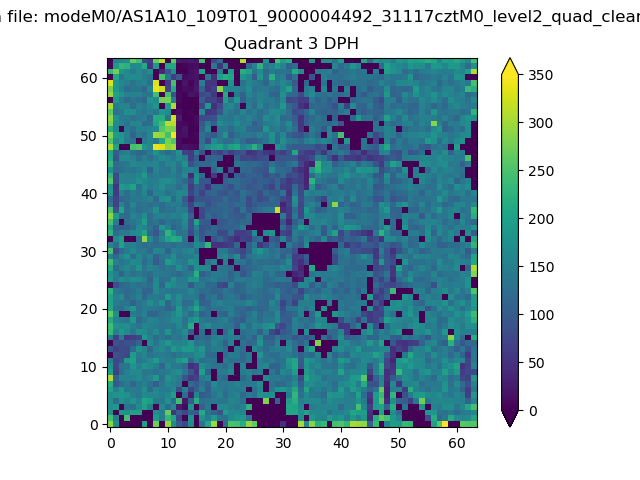 |
 |
Quadrant C |
| Plot type | Count rate plots | Images |
|---|---|---|
| Comparison with Poisson distribution Blue bars denote a histogram of data divided into 1 sec bins. Red curve is a Poisson curve with rate = median count rate of data. |
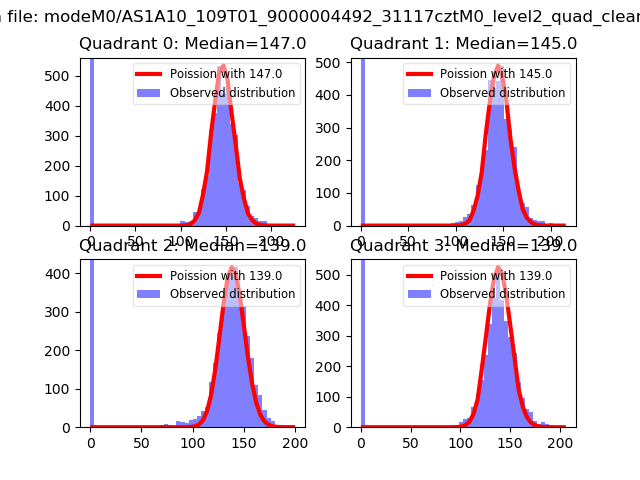 |
 |
| Quadrant-wise count rates Data is divided into 100 sec bins |
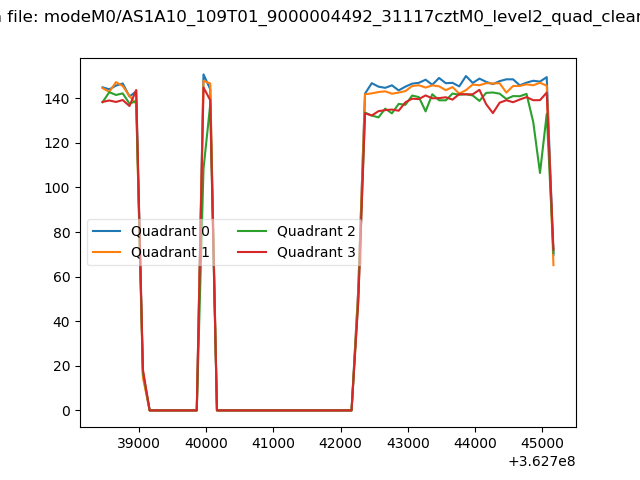 |
|
| Module-wise count rates for Quadrant A Data is divided into 100 sec bins |
 |
 |
| Module-wise count rates for Quadrant B Data is divided into 100 sec bins |
 |
 |
| Module-wise count rates for Quadrant C Data is divided into 100 sec bins |
 |
 |
| Module-wise count rates for Quadrant D Data is divided into 100 sec bins |
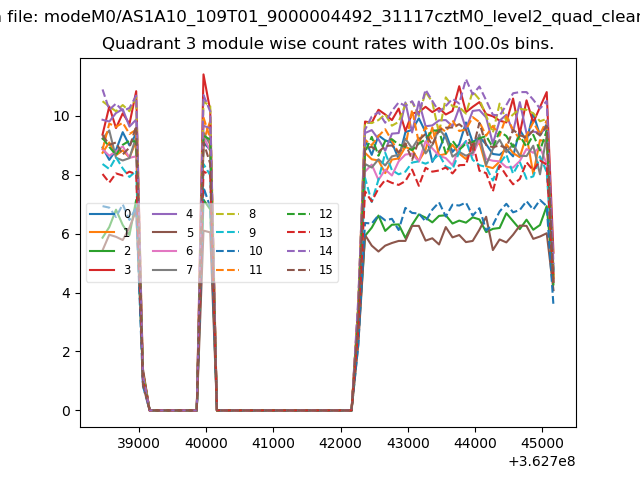 |
 |
| Parameter | Plot |
|---|---|
| CZT HV Monitor |  |
| D_VDD | 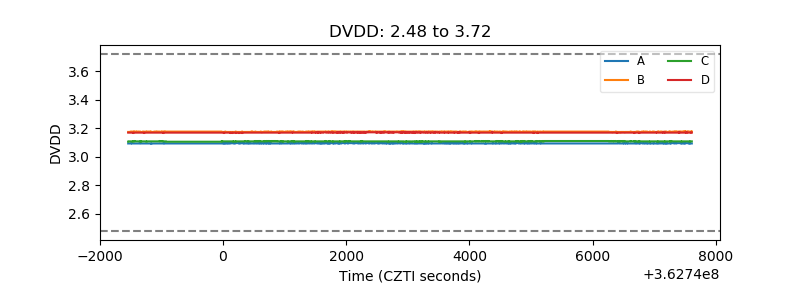 |
| Temperature 1 |  |
| Veto HV Monitor | 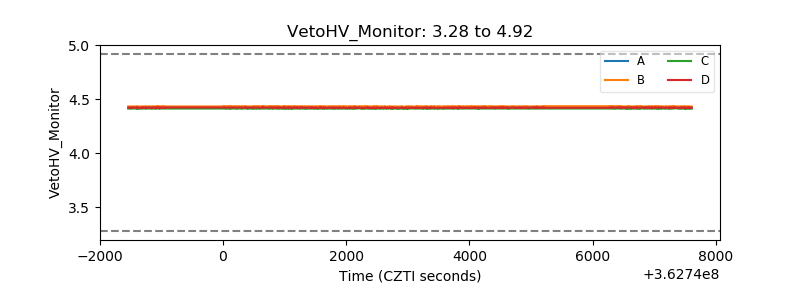 |
| Veto LLD |  |
| Alpha Counter | 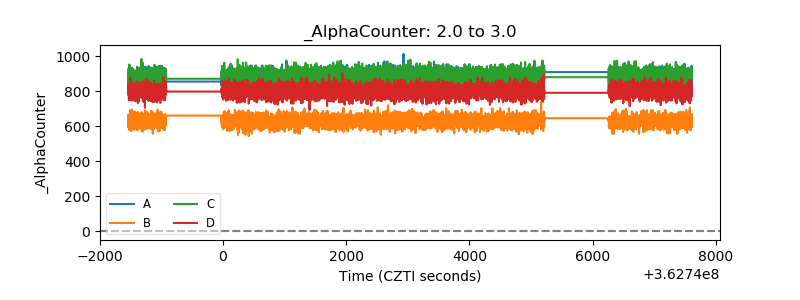 |
| _CPM_Rate | 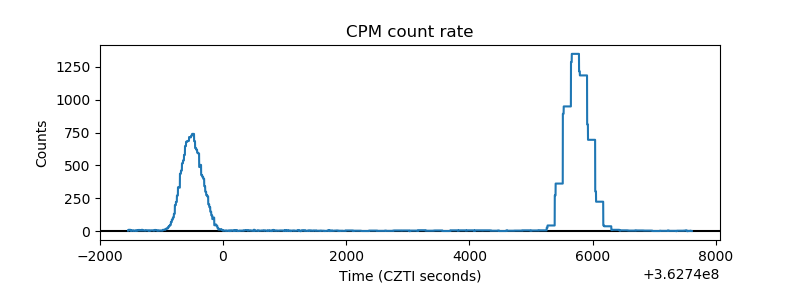 |
| CZT Counter | 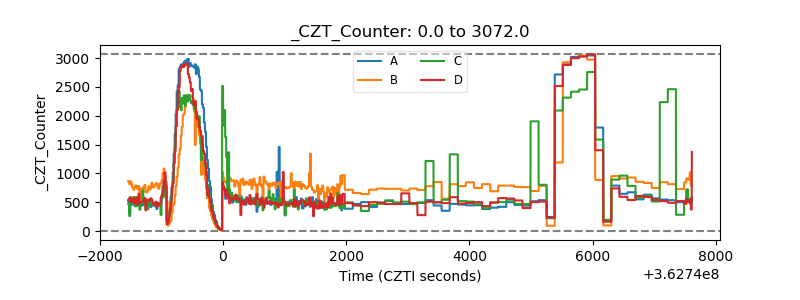 |
| +2.5 Volts monitor |  |
| +5 Volts monitor |  |
| _ROLL_ROT | 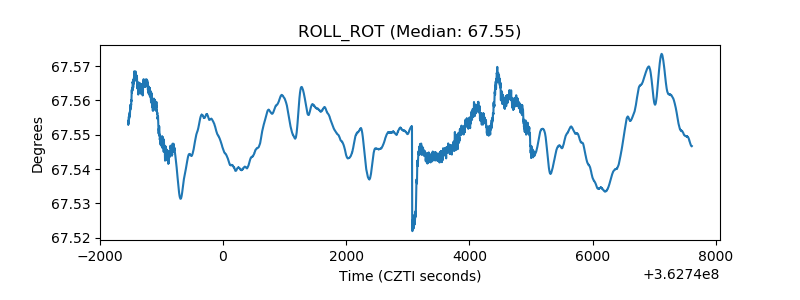 |
| _Roll_DEC | 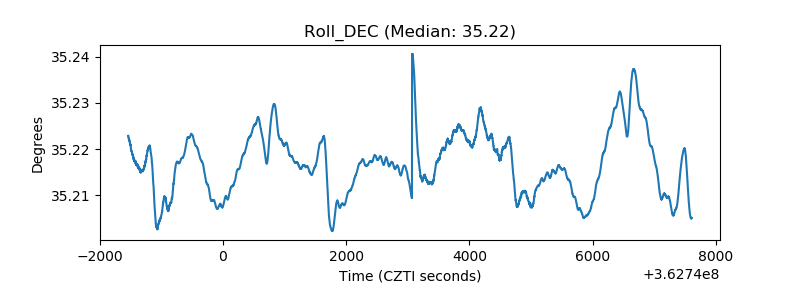 |
| _Roll_RA | 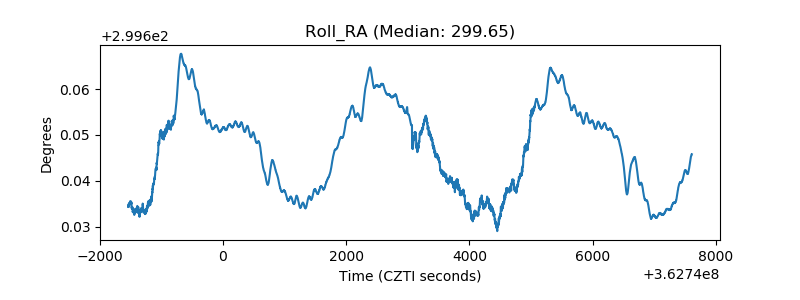 |
| Veto Counter |  |