| Param | Original file | Final file |
|---|---|---|
| Filename | modeM0/AS1A10_109T01_9000004492_31120cztM0_level2.evt | modeM0/AS1A10_109T01_9000004492_31120cztM0_level2_quad_clean.evt |
| Size (bytes) | 575,709,120 | 93,312,000 |
| Size | 549.0 MB | 89.0 MB |
| Events in quadrant A | 3,615,012 | 613,587 |
| Events in quadrant B | 5,269,711 | 606,795 |
| Events in quadrant C | 4,244,755 | 584,846 |
| Events in quadrant D | 3,876,885 | 578,386 |
| Mode M0 | |||
|---|---|---|---|
| Quadrant | BADHDUFLAG | Total packets | Discarded packets |
| A | 0 | 14823 | 2 |
| B | 0 | 19789 | 2 |
| C | 0 | 16923 | 2 |
| D | 0 | 15622 | 2 |
| Mode SS | |||
|---|---|---|---|
| Quadrant | BADHDUFLAG | Total packets | Discarded packets |
| A | 0 | 132 | 0 |
| B | 0 | 132 | 0 |
| C | 0 | 132 | 0 |
| D | 0 | 132 | 0 |
| Mode M9 | |||
|---|---|---|---|
| Quadrant | BADHDUFLAG | Total packets | Discarded packets |
| A | 0 | 24 | 0 |
| B | 0 | 24 | 0 |
| C | 0 | 24 | 0 |
| D | 0 | 24 | 0 |
| Quadrant | Total seconds | Saturated seconds | Saturation percentage |
|---|---|---|---|
| A | 6333 | 138 | 2.179062% |
| B | 6334 | 228 | 3.599621% |
| C | 6333 | 372 | 5.873993% |
| D | 6333 | 119 | 1.879046% |
Noise dominated data is calculated using 1-second bins in cleaned event files. If a bin has >2000 counts, and if more than 50% of those come from <1% of pixels, then it is considered to be noise-dominated and hence unusable.
| Quadrant | # 1 sec bins | Bins with >0 counts | Bins with >2000 counts | High rate bins dominated by noise | Noise dominated (total time) | Noise dominated (detector-on time) | Marked lightcurve |
|---|---|---|---|---|---|---|---|
| A | 8753 | 6335 | 0 | 0 | 0.00% | 0.00% | 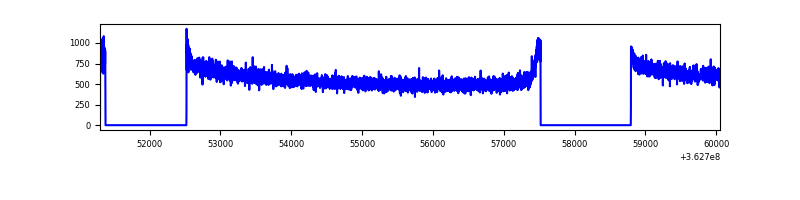 |
| B | 8754 | 6336 | 1 | 1 | 0.01% | 0.02% | 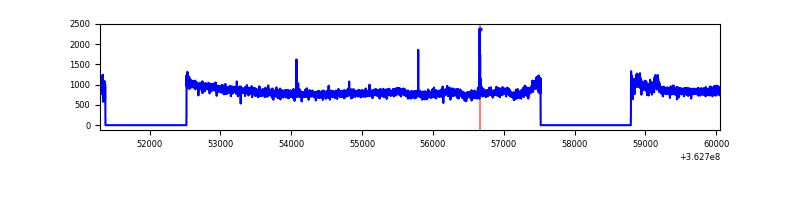 |
| C | 8753 | 6335 | 86 | 86 | 0.98% | 1.36% | 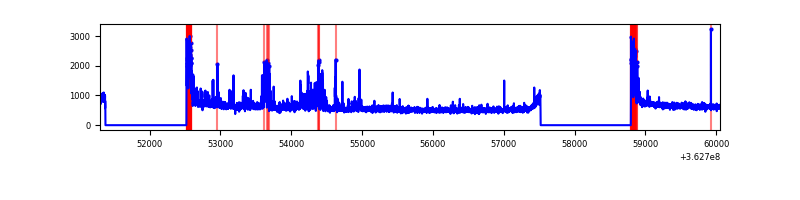 |
| D | 8753 | 6335 | 2 | 2 | 0.02% | 0.03% | 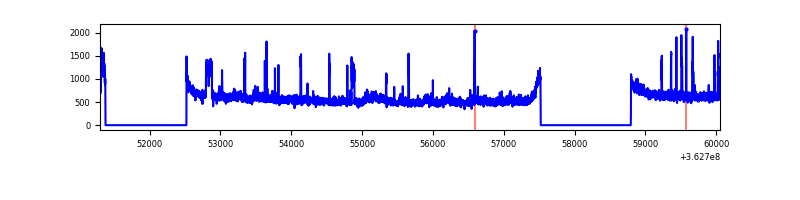 |
Top three noisy pixels from each quadrant. If the there are fewer than three noisy pixels in the level2.evt file, extra rows are filled as -1
| Pixel properties | Quadrant properties | ||||||
|---|---|---|---|---|---|---|---|
| Quadrant | DetID | PixID | Counts | Sigma | Mean | Median | Sigma |
| A | 13 | 254 | 10895 | 54.11 | 937 | 925 | 184.3 |
| A | 3 | 137 | 8899 | 43.28 | 937 | 925 | 184.3 |
| A | 0 | 226 | 7919 | 37.96 | 937 | 925 | 184.3 |
| B | 6 | 159 | 1637560 | 9627.97 | 912 | 893 | 170.0 |
| B | 0 | 183 | 24073 | 136.36 | 912 | 893 | 170.0 |
| B | 12 | 111 | 20434 | 114.95 | 912 | 893 | 170.0 |
| C | 0 | 10 | 367762 | 1806.65 | 879 | 890 | 203.1 |
| C | 10 | 22 | 281724 | 1382.96 | 879 | 890 | 203.1 |
| C | 14 | 238 | 142763 | 698.65 | 879 | 890 | 203.1 |
| D | 8 | 195 | 397511 | 1871.32 | 908 | 889 | 211.9 |
| D | 12 | 218 | 28602 | 130.75 | 908 | 889 | 211.9 |
| D | 2 | 234 | 22679 | 102.81 | 908 | 889 | 211.9 |
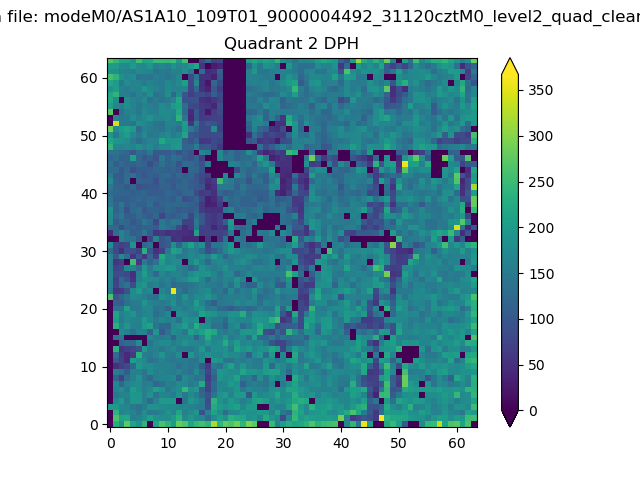
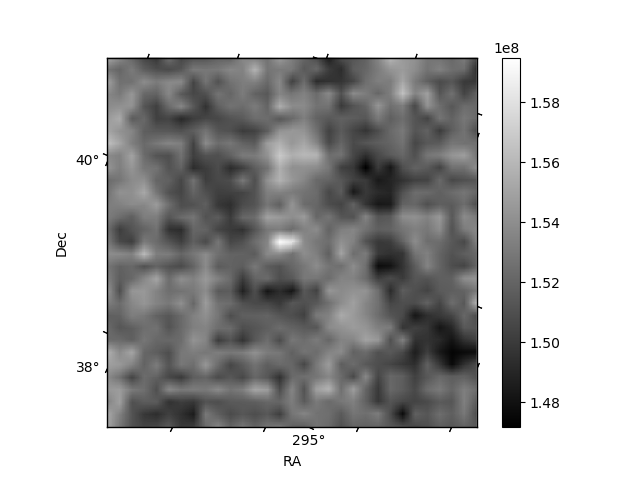
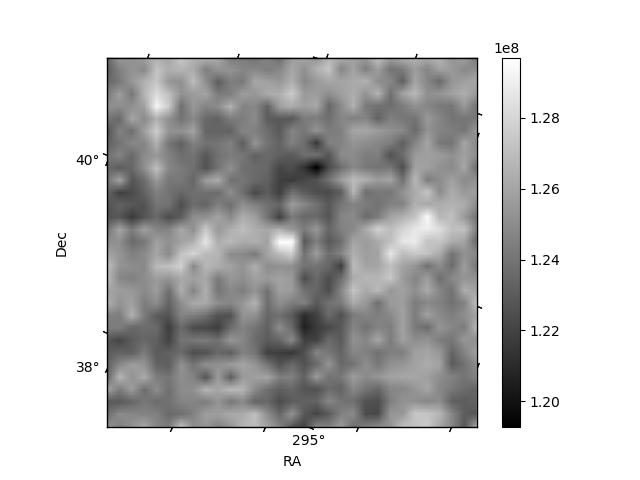
Histogram calculated using DETX and DETY for each event in the final _common_clean file
| Quadrant A | 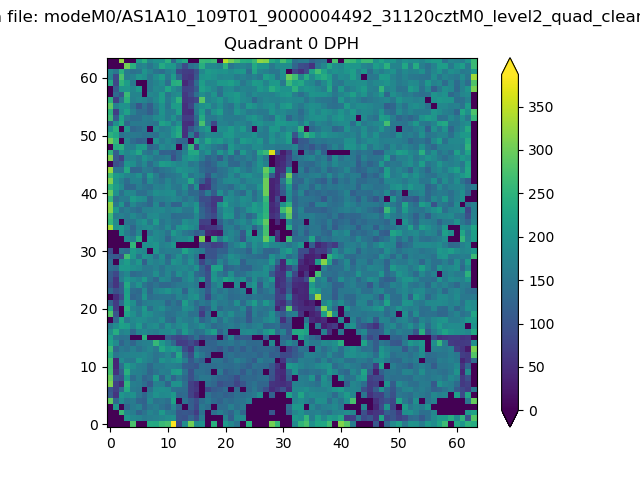 |
 |
Quadrant B |
|---|---|---|---|
| Quadrant D |  |
 |
Quadrant C |
| Plot type | Count rate plots | Images |
|---|---|---|
| Comparison with Poisson distribution Blue bars denote a histogram of data divided into 1 sec bins. Red curve is a Poisson curve with rate = median count rate of data. |
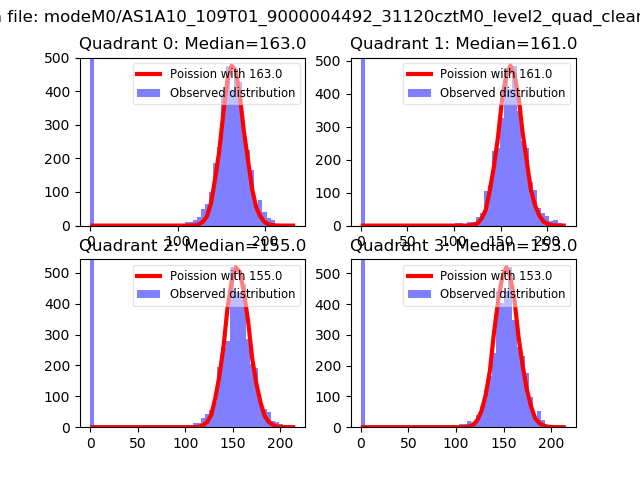 |
 |
| Quadrant-wise count rates Data is divided into 100 sec bins |
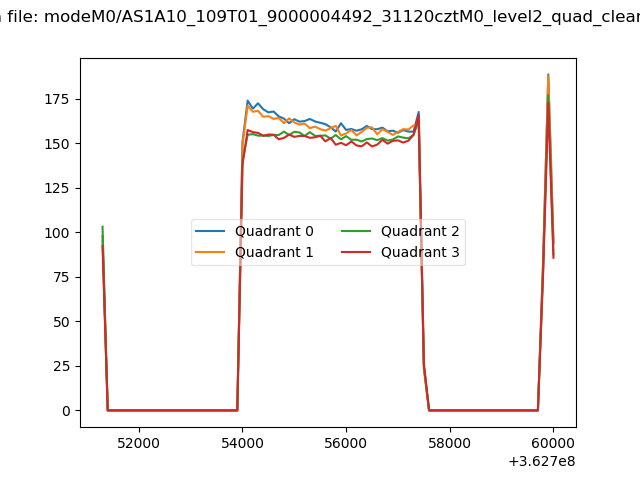 |
|
| Module-wise count rates for Quadrant A Data is divided into 100 sec bins |
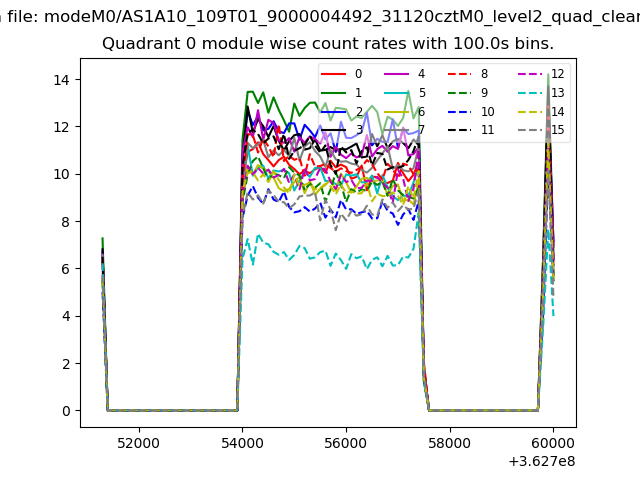 |
 |
| Module-wise count rates for Quadrant B Data is divided into 100 sec bins |
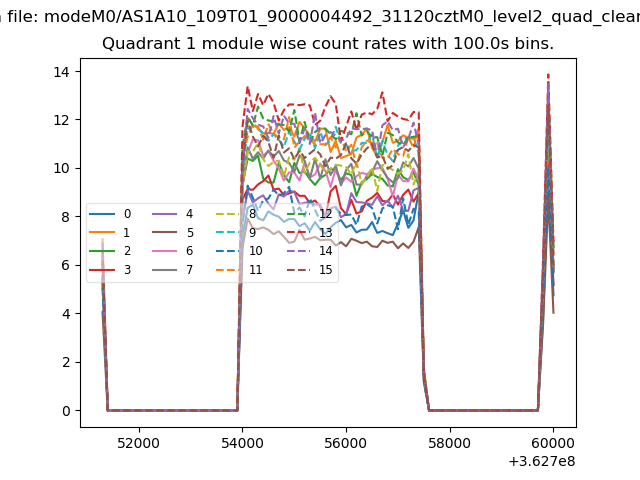 |
 |
| Module-wise count rates for Quadrant C Data is divided into 100 sec bins |
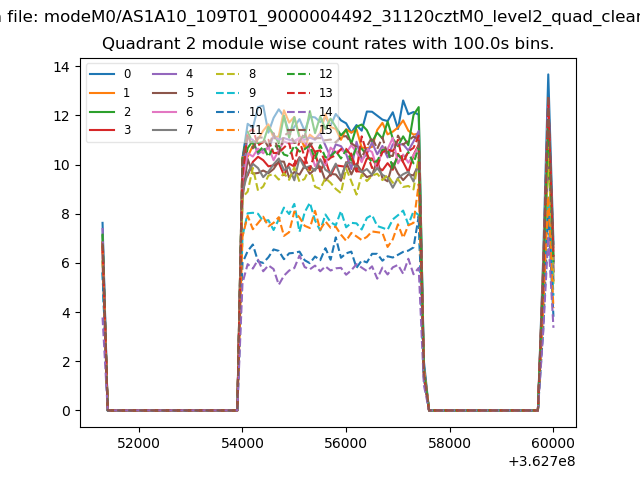 |
 |
| Module-wise count rates for Quadrant D Data is divided into 100 sec bins |
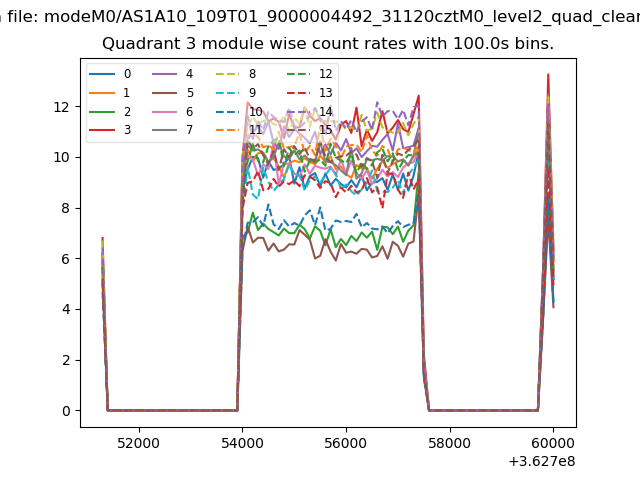 |
 |
| Parameter | Plot |
|---|---|
| CZT HV Monitor |  |
| D_VDD | 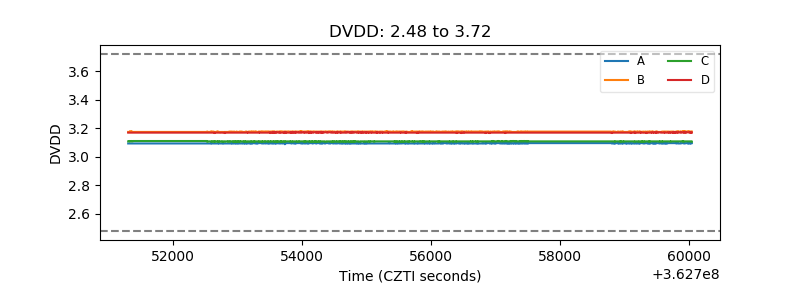 |
| Temperature 1 |  |
| Veto HV Monitor | 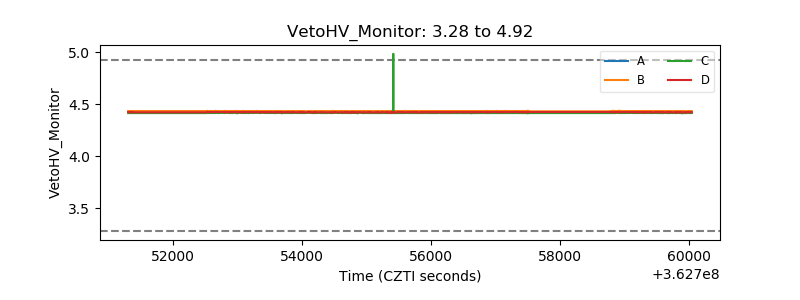 |
| Veto LLD | 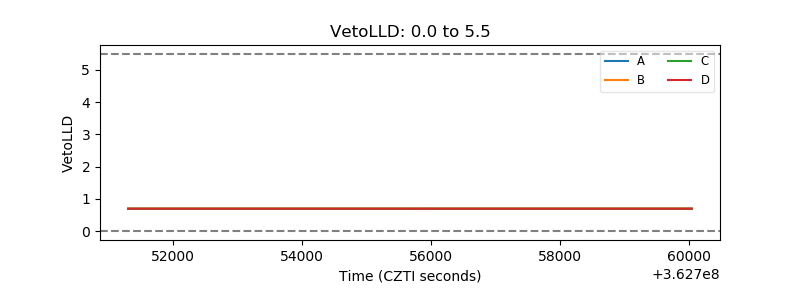 |
| Alpha Counter | 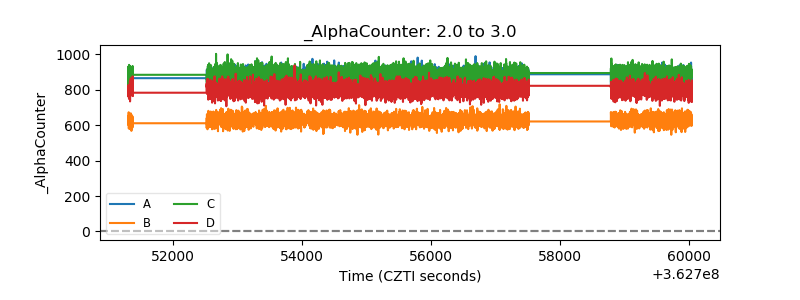 |
| _CPM_Rate | 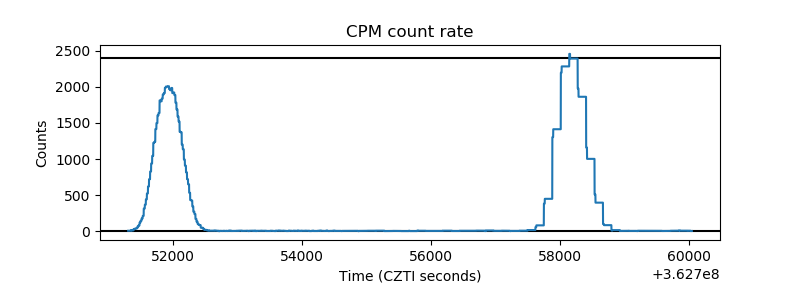 |
| CZT Counter | 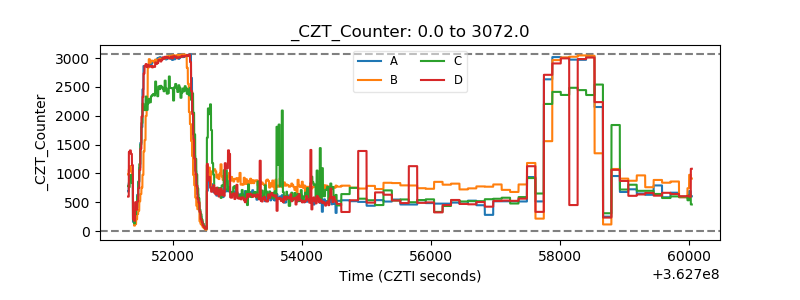 |
| +2.5 Volts monitor |  |
| +5 Volts monitor |  |
| _ROLL_ROT | 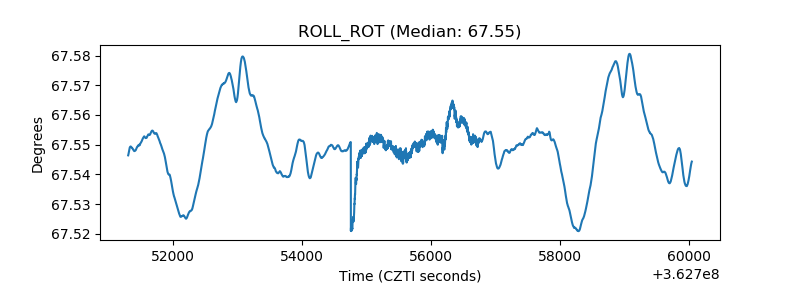 |
| _Roll_DEC | 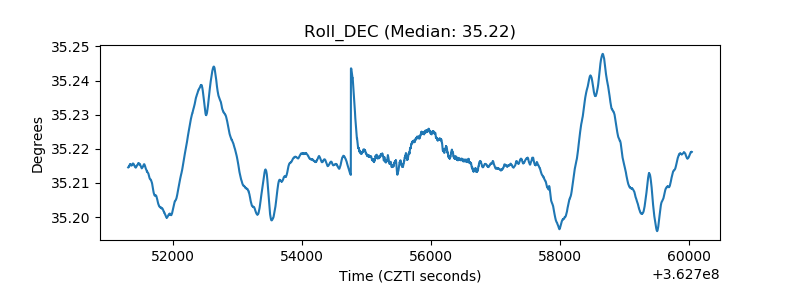 |
| _Roll_RA | 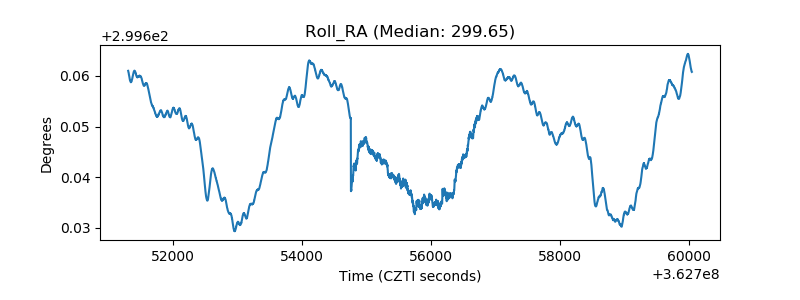 |
| Veto Counter | 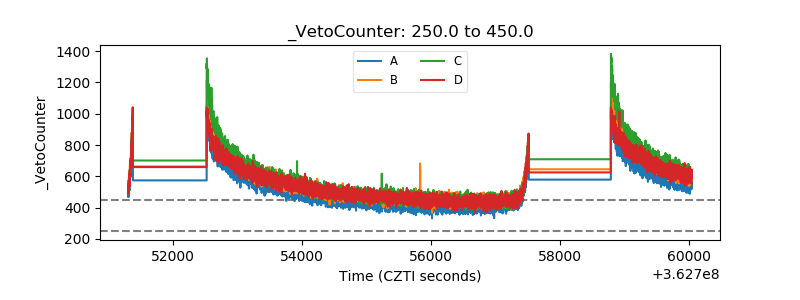 |