| Param | Original file | Final file |
|---|---|---|
| Filename | modeM0/AS1A10_109T01_9000004492_31121cztM0_level2.evt | modeM0/AS1A10_109T01_9000004492_31121cztM0_level2_quad_clean.evt |
| Size (bytes) | 557,205,120 | 108,360,000 |
| Size | 531.4 MB | 103.3 MB |
| Events in quadrant A | 3,570,555 | 728,881 |
| Events in quadrant B | 5,259,711 | 723,570 |
| Events in quadrant C | 3,879,436 | 704,274 |
| Events in quadrant D | 3,745,100 | 691,710 |
| Mode M0 | |||
|---|---|---|---|
| Quadrant | BADHDUFLAG | Total packets | Discarded packets |
| A | 0 | 14729 | 2 |
| B | 0 | 19423 | 2 |
| C | 0 | 15726 | 2 |
| D | 0 | 15371 | 2 |
| Mode SS | |||
|---|---|---|---|
| Quadrant | BADHDUFLAG | Total packets | Discarded packets |
| A | 0 | 128 | 0 |
| B | 0 | 128 | 0 |
| C | 0 | 128 | 0 |
| D | 0 | 128 | 0 |
| Mode M9 | |||
|---|---|---|---|
| Quadrant | BADHDUFLAG | Total packets | Discarded packets |
| A | 0 | 25 | 0 |
| B | 0 | 26 | 0 |
| C | 0 | 26 | 0 |
| D | 0 | 26 | 0 |
| Quadrant | Total seconds | Saturated seconds | Saturation percentage |
|---|---|---|---|
| A | 6213 | 109 | 1.754386% |
| B | 6213 | 199 | 3.202962% |
| C | 6213 | 295 | 4.748109% |
| D | 6213 | 86 | 1.384194% |
Noise dominated data is calculated using 1-second bins in cleaned event files. If a bin has >2000 counts, and if more than 50% of those come from <1% of pixels, then it is considered to be noise-dominated and hence unusable.
| Quadrant | # 1 sec bins | Bins with >0 counts | Bins with >2000 counts | High rate bins dominated by noise | Noise dominated (total time) | Noise dominated (detector-on time) | Marked lightcurve |
|---|---|---|---|---|---|---|---|
| A | 7513 | 6214 | 0 | 0 | 0.00% | 0.00% | 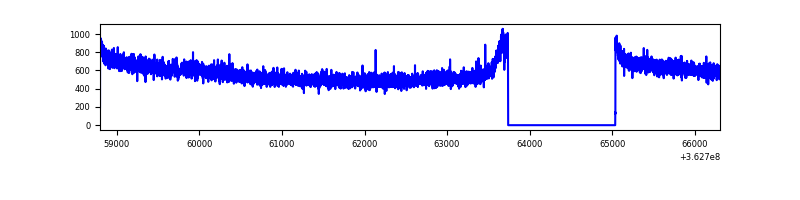 |
| B | 7513 | 6214 | 2 | 2 | 0.03% | 0.03% | 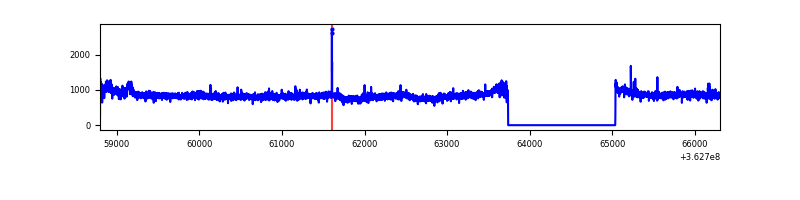 |
| C | 7513 | 6214 | 48 | 48 | 0.64% | 0.77% | 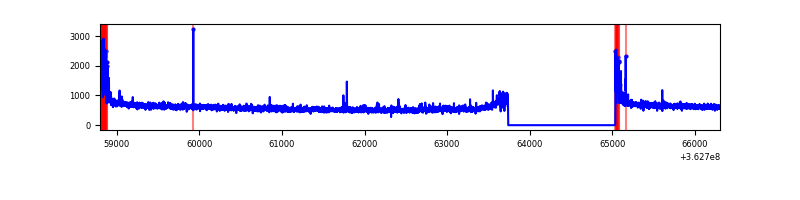 |
| D | 7513 | 6214 | 2 | 2 | 0.03% | 0.03% | 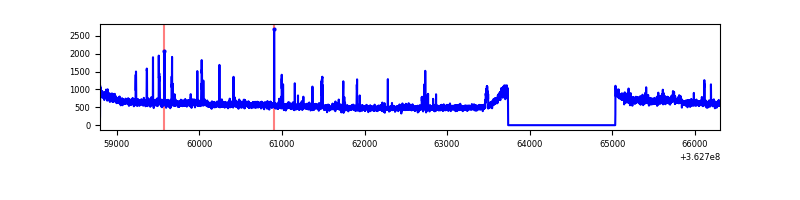 |
Top three noisy pixels from each quadrant. If the there are fewer than three noisy pixels in the level2.evt file, extra rows are filled as -1
| Pixel properties | Quadrant properties | ||||||
|---|---|---|---|---|---|---|---|
| Quadrant | DetID | PixID | Counts | Sigma | Mean | Median | Sigma |
| A | 13 | 254 | 10576 | 52.74 | 926 | 915 | 183.2 |
| A | 3 | 137 | 8681 | 42.39 | 926 | 915 | 183.2 |
| A | 0 | 226 | 7831 | 37.75 | 926 | 915 | 183.2 |
| B | 6 | 159 | 1635016 | 9716.68 | 906 | 887 | 168.2 |
| B | 0 | 183 | 27813 | 160.1 | 906 | 887 | 168.2 |
| B | 12 | 111 | 19822 | 112.59 | 906 | 887 | 168.2 |
| C | 0 | 10 | 245989 | 1206.17 | 888 | 900 | 203.2 |
| C | 14 | 238 | 146315 | 715.64 | 888 | 900 | 203.2 |
| C | 2 | 114 | 14109 | 65.01 | 888 | 900 | 203.2 |
| D | 8 | 195 | 262473 | 1241.5 | 908 | 890 | 210.7 |
| D | 7 | 64 | 29413 | 135.37 | 908 | 890 | 210.7 |
| D | 2 | 234 | 22214 | 101.21 | 908 | 890 | 210.7 |
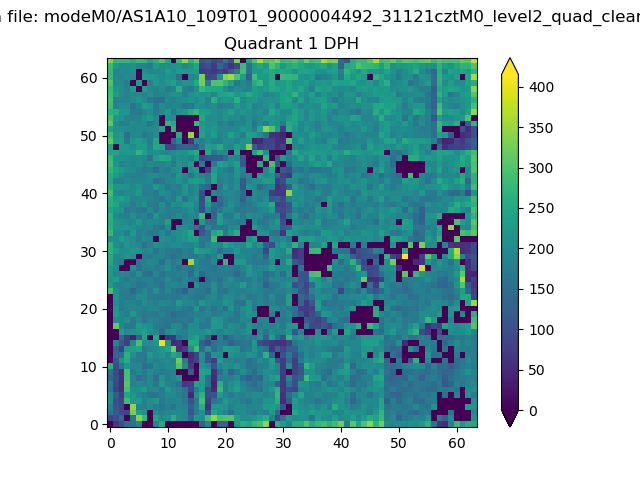
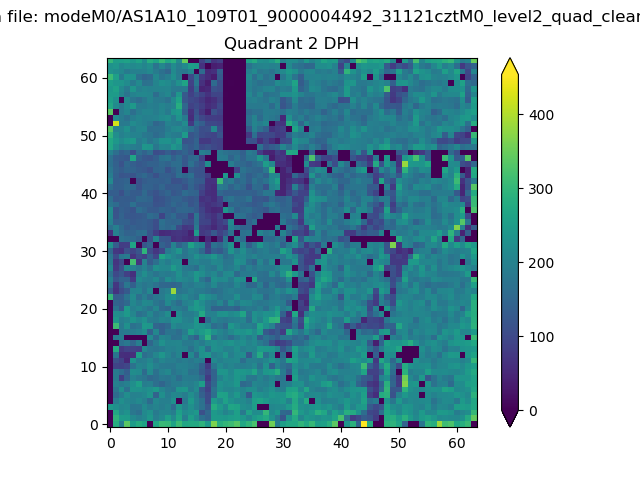
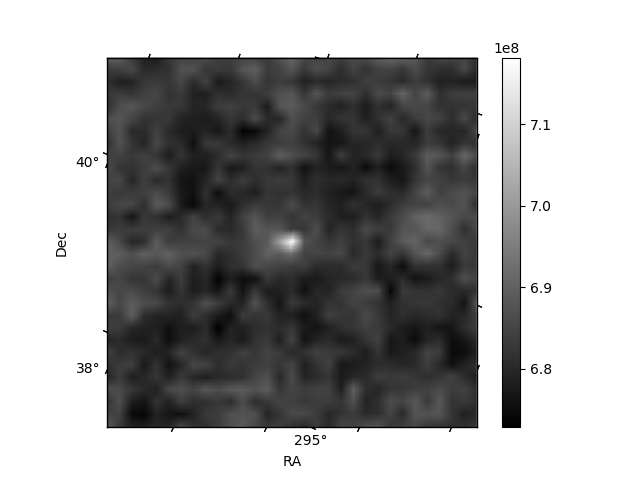
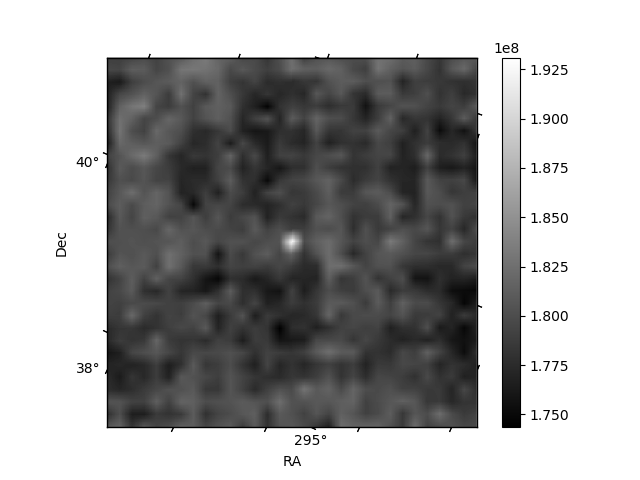
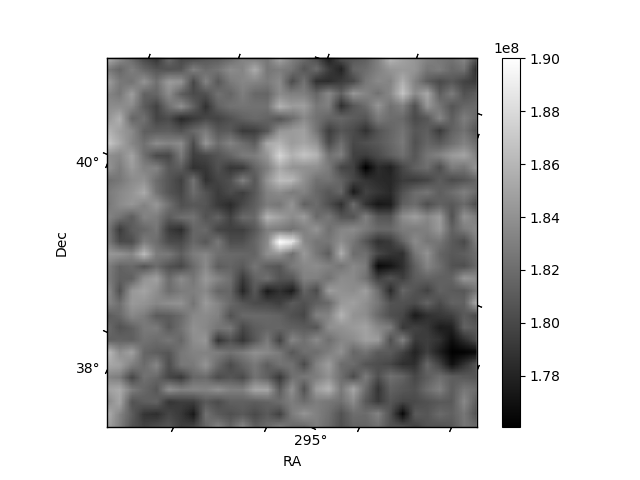
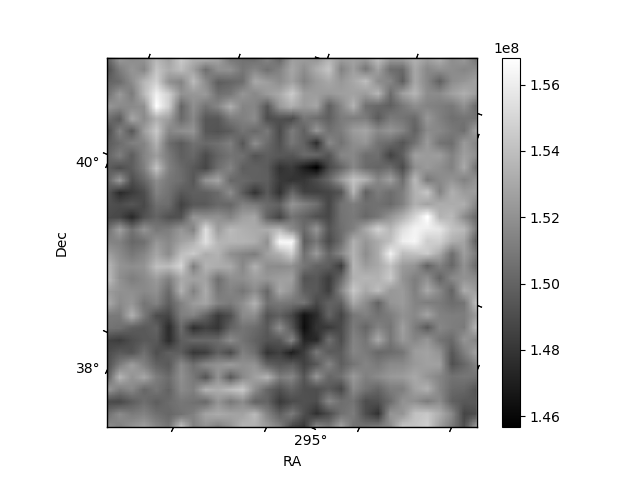
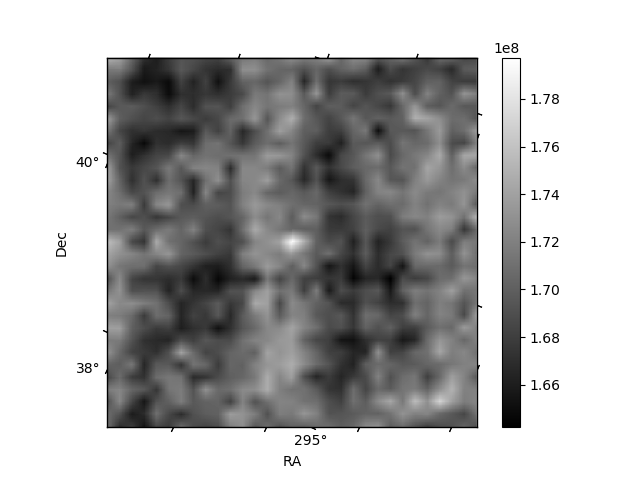
Histogram calculated using DETX and DETY for each event in the final _common_clean file
| Quadrant A |  |
 |
Quadrant B |
|---|---|---|---|
| Quadrant D | 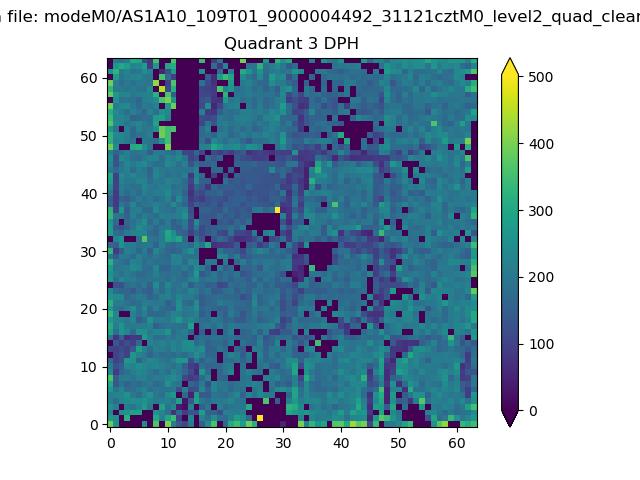 |
 |
Quadrant C |
| Plot type | Count rate plots | Images |
|---|---|---|
| Comparison with Poisson distribution Blue bars denote a histogram of data divided into 1 sec bins. Red curve is a Poisson curve with rate = median count rate of data. |
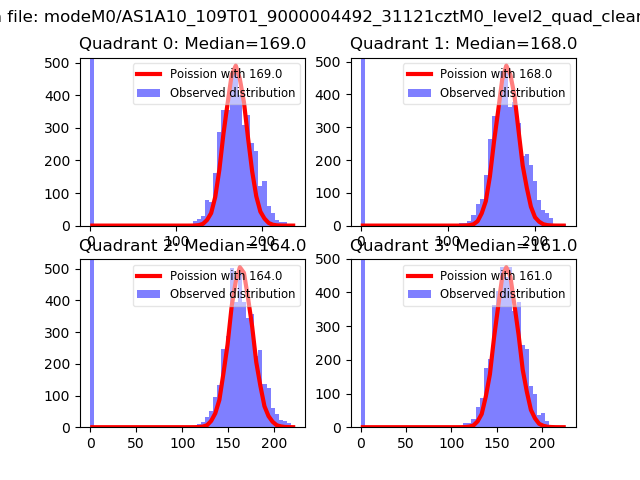 |
 |
| Quadrant-wise count rates Data is divided into 100 sec bins |
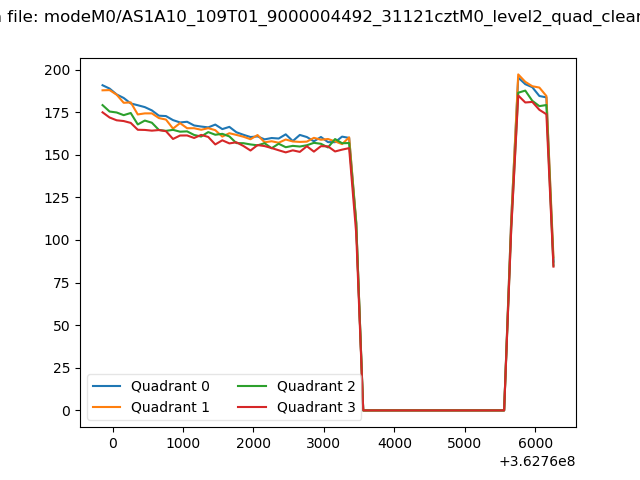 |
|
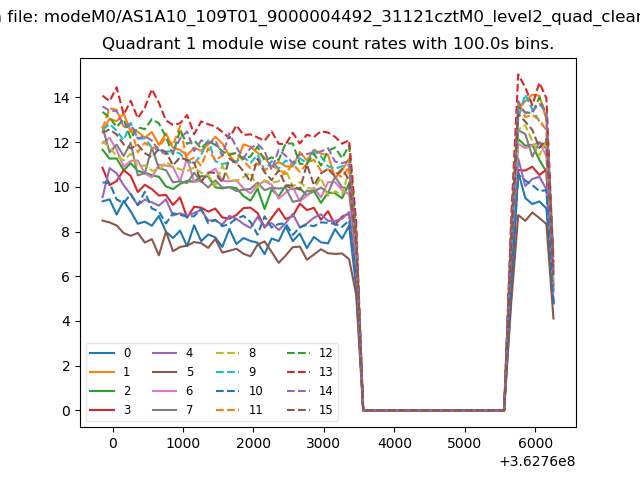
| Module-wise count rates for Quadrant A Data is divided into 100 sec bins |
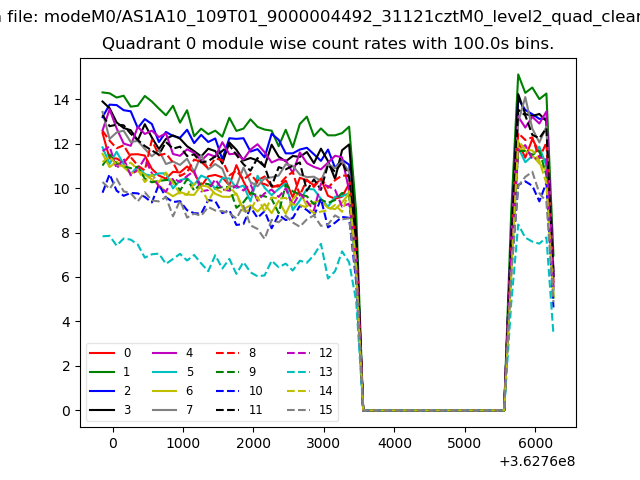 |
 |
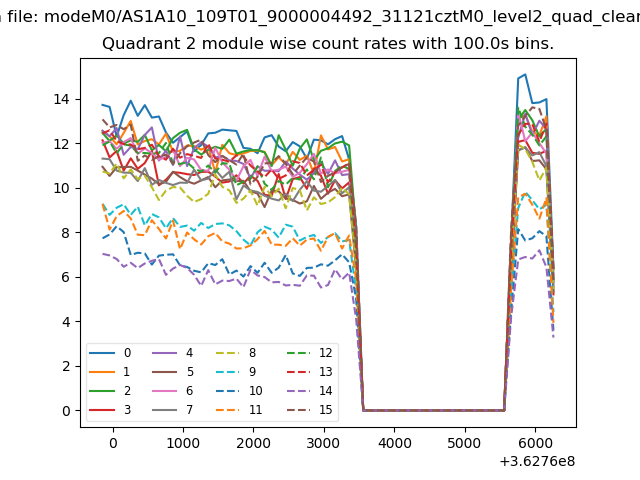
| Module-wise count rates for Quadrant B Data is divided into 100 sec bins |
 |
 |
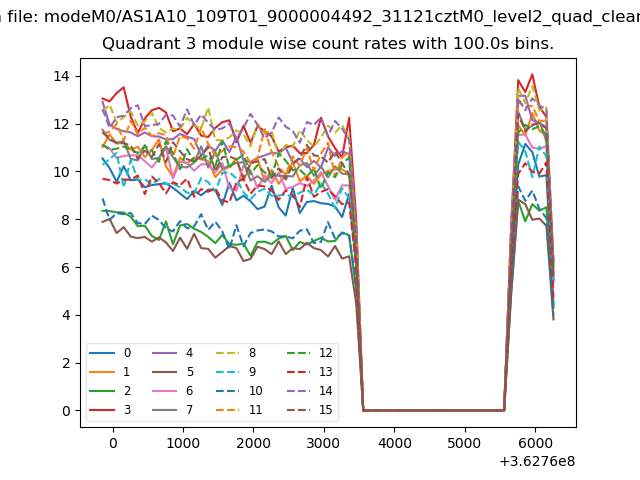
| Module-wise count rates for Quadrant C Data is divided into 100 sec bins |
 |
 |
| Module-wise count rates for Quadrant D Data is divided into 100 sec bins |
 |
 |
| Parameter | Plot |
|---|---|
| CZT HV Monitor | 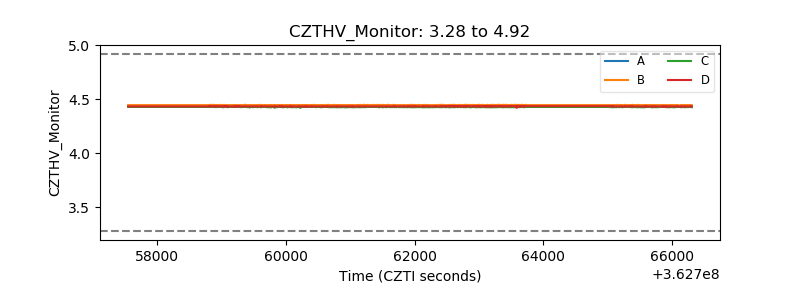 |
| D_VDD | 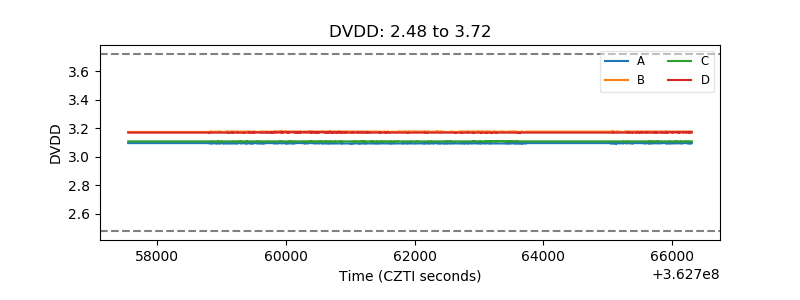 |
| Temperature 1 | 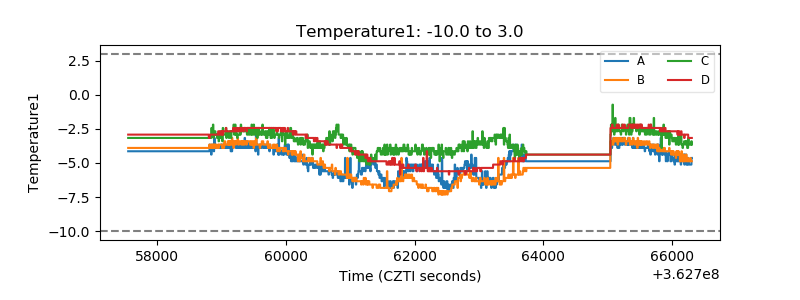 |
| Veto HV Monitor |  |
| Veto LLD | 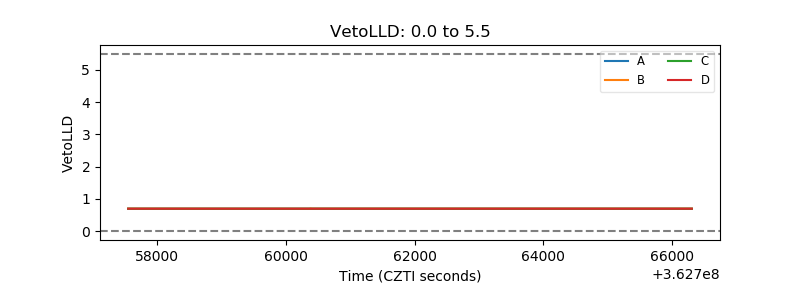 |
| Alpha Counter | 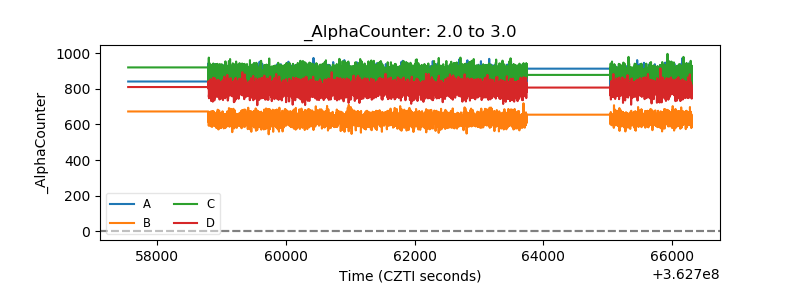 |
| _CPM_Rate | 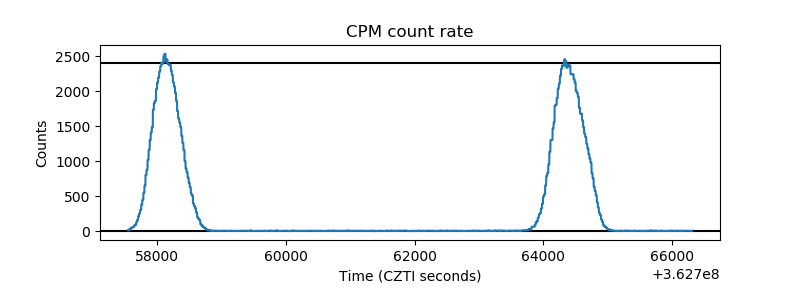 |
| CZT Counter | 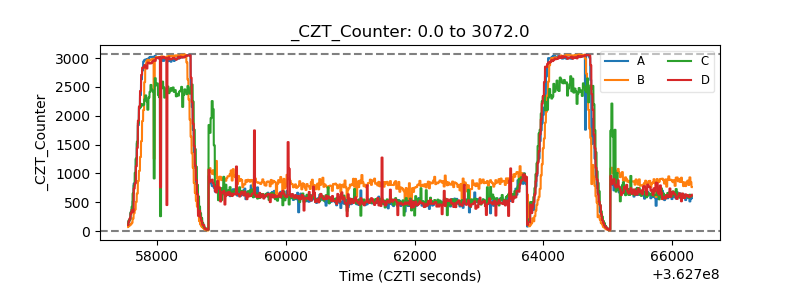 |
| +2.5 Volts monitor |  |
| +5 Volts monitor |  |
| _ROLL_ROT | 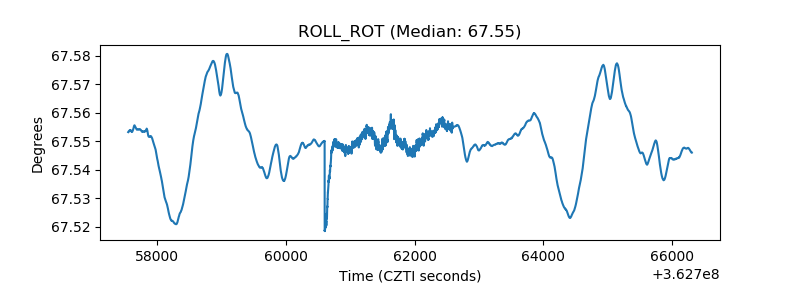 |
| _Roll_DEC | 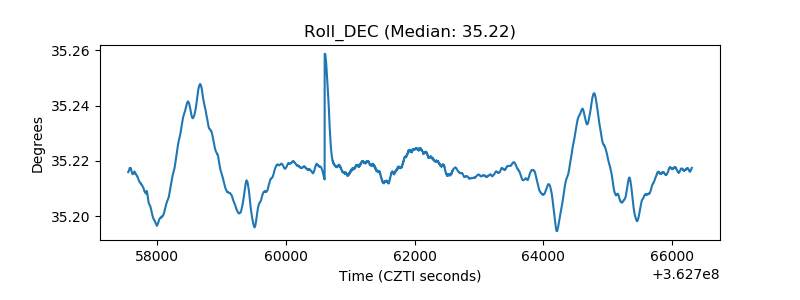 |
| _Roll_RA | 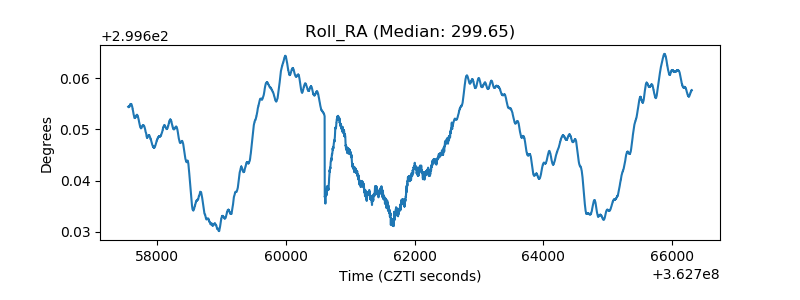 |
| Veto Counter | 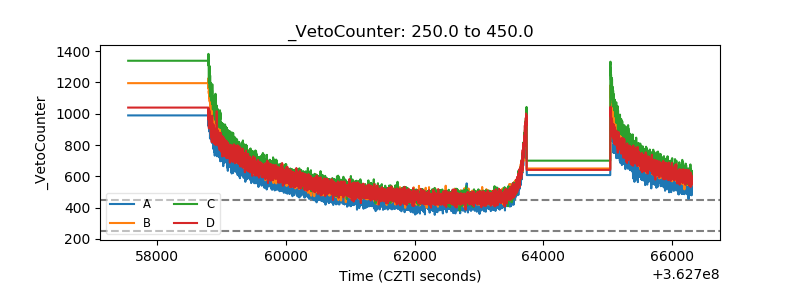 |