| Param | Original file | Final file |
|---|---|---|
| Filename | modeM0/AS1A10_109T01_9000004492_31122cztM0_level2.evt | modeM0/AS1A10_109T01_9000004492_31122cztM0_level2_quad_clean.evt |
| Size (bytes) | 548,876,160 | 118,477,440 |
| Size | 523.4 MB | 113.0 MB |
| Events in quadrant A | 3,457,496 | 802,687 |
| Events in quadrant B | 5,222,125 | 804,918 |
| Events in quadrant C | 3,751,711 | 784,425 |
| Events in quadrant D | 3,771,897 | 763,649 |
| Mode M0 | |||
|---|---|---|---|
| Quadrant | BADHDUFLAG | Total packets | Discarded packets |
| A | 0 | 14308 | 2 |
| B | 0 | 19294 | 2 |
| C | 0 | 15308 | 2 |
| D | 0 | 15470 | 2 |
| Mode SS | |||
|---|---|---|---|
| Quadrant | BADHDUFLAG | Total packets | Discarded packets |
| A | 0 | 128 | 0 |
| B | 0 | 128 | 0 |
| C | 0 | 128 | 0 |
| D | 0 | 128 | 0 |
| Mode M9 | |||
|---|---|---|---|
| Quadrant | BADHDUFLAG | Total packets | Discarded packets |
| A | 0 | 23 | 0 |
| B | 0 | 24 | 0 |
| C | 0 | 24 | 0 |
| D | 0 | 24 | 0 |
| Quadrant | Total seconds | Saturated seconds | Saturation percentage |
|---|---|---|---|
| A | 6199 | 59 | 0.951766% |
| B | 6199 | 154 | 2.484272% |
| C | 6199 | 243 | 3.919987% |
| D | 6199 | 92 | 1.484110% |
Noise dominated data is calculated using 1-second bins in cleaned event files. If a bin has >2000 counts, and if more than 50% of those come from <1% of pixels, then it is considered to be noise-dominated and hence unusable.
| Quadrant | # 1 sec bins | Bins with >0 counts | Bins with >2000 counts | High rate bins dominated by noise | Noise dominated (total time) | Noise dominated (detector-on time) | Marked lightcurve |
|---|---|---|---|---|---|---|---|
| A | 7549 | 6201 | 0 | 0 | 0.00% | 0.00% | 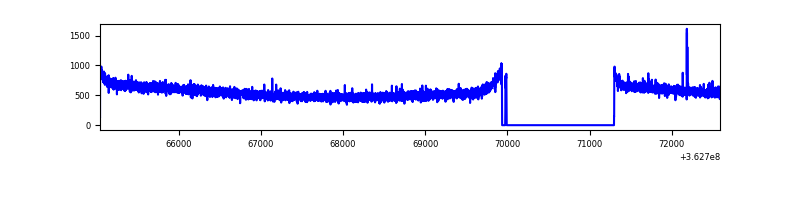 |
| B | 7549 | 6201 | 3 | 3 | 0.04% | 0.05% | 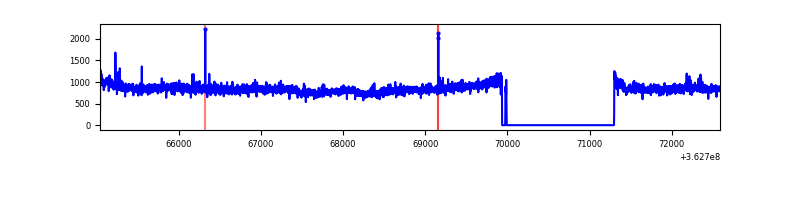 |
| C | 7549 | 6201 | 38 | 38 | 0.50% | 0.61% | 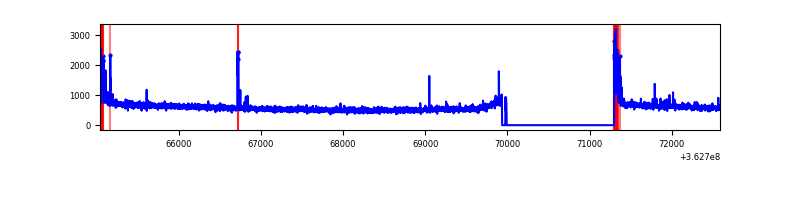 |
| D | 7549 | 6201 | 31 | 31 | 0.41% | 0.50% | 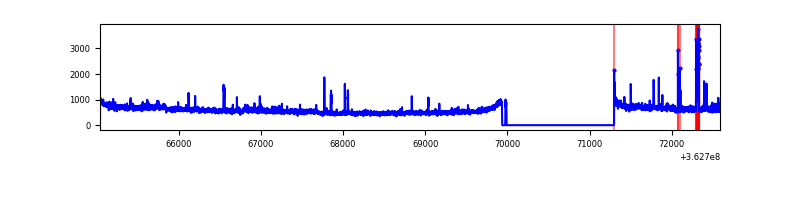 |
Top three noisy pixels from each quadrant. If the there are fewer than three noisy pixels in the level2.evt file, extra rows are filled as -1
| Pixel properties | Quadrant properties | ||||||
|---|---|---|---|---|---|---|---|
| Quadrant | DetID | PixID | Counts | Sigma | Mean | Median | Sigma |
| A | 13 | 254 | 11143 | 58.45 | 894 | 881 | 175.6 |
| A | 8 | 144 | 8803 | 45.12 | 894 | 881 | 175.6 |
| A | 3 | 137 | 8247 | 41.96 | 894 | 881 | 175.6 |
| B | 6 | 159 | 1700070 | 10303.63 | 883 | 865 | 164.9 |
| B | 0 | 183 | 32916 | 194.35 | 883 | 865 | 164.9 |
| B | 12 | 111 | 19304 | 111.81 | 883 | 865 | 164.9 |
| C | 0 | 10 | 176066 | 884.1 | 866 | 879 | 198.2 |
| C | 14 | 238 | 142609 | 715.26 | 866 | 879 | 198.2 |
| C | 10 | 22 | 19905 | 96.02 | 866 | 879 | 198.2 |
| D | 8 | 195 | 306204 | 1494.52 | 878 | 861 | 204.3 |
| D | 2 | 120 | 102758 | 498.74 | 878 | 861 | 204.3 |
| D | 13 | 174 | 24217 | 114.32 | 878 | 861 | 204.3 |
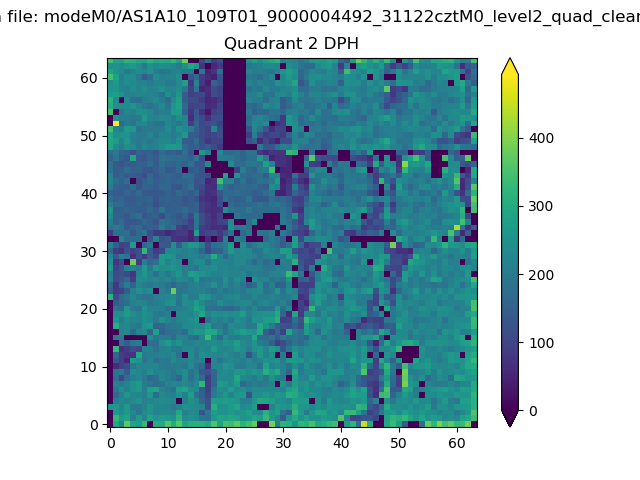
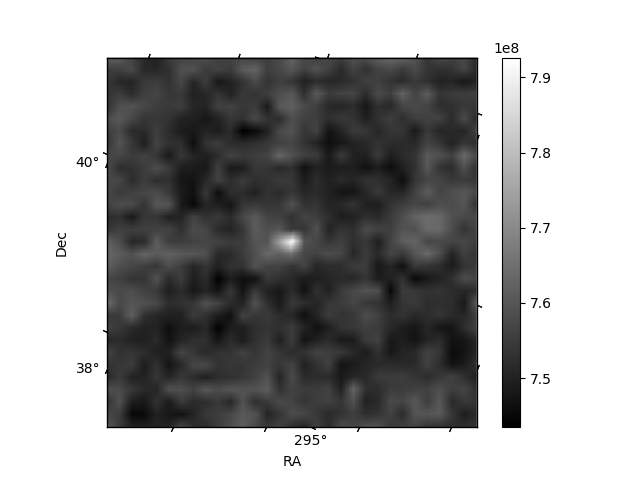
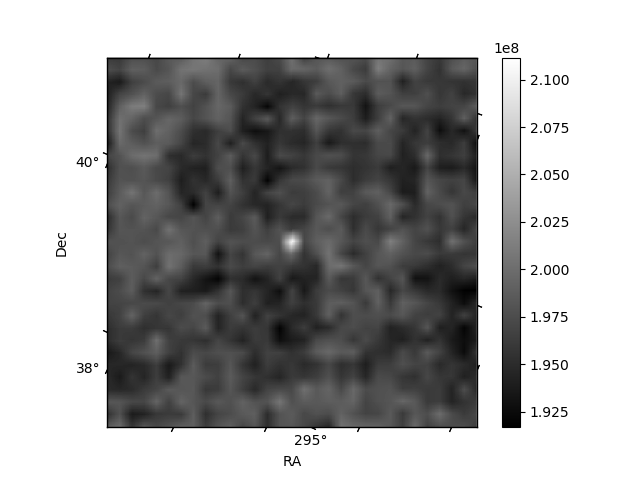
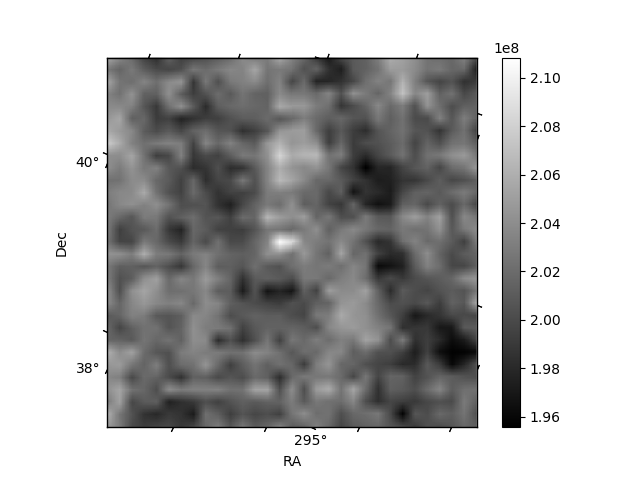
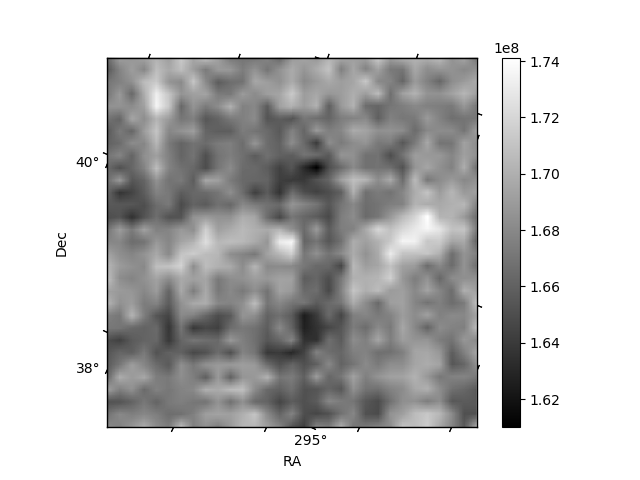
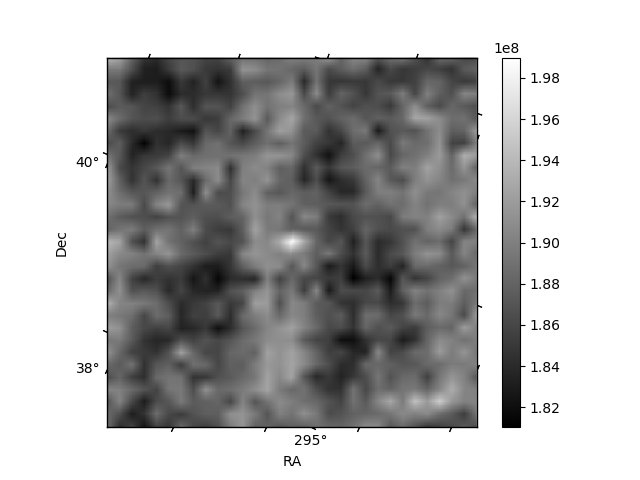
Histogram calculated using DETX and DETY for each event in the final _common_clean file
| Quadrant A | 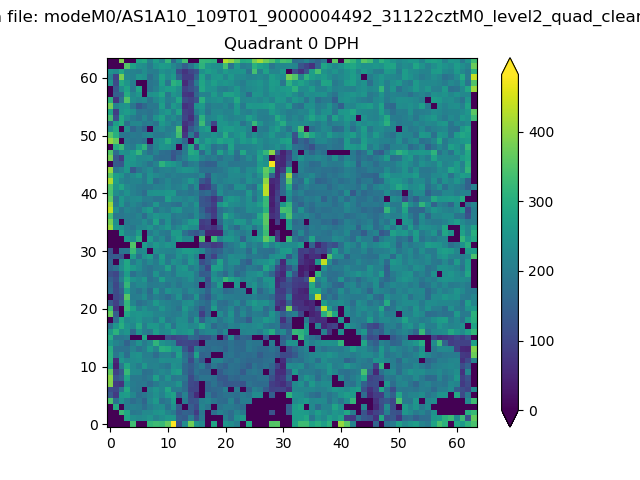 |
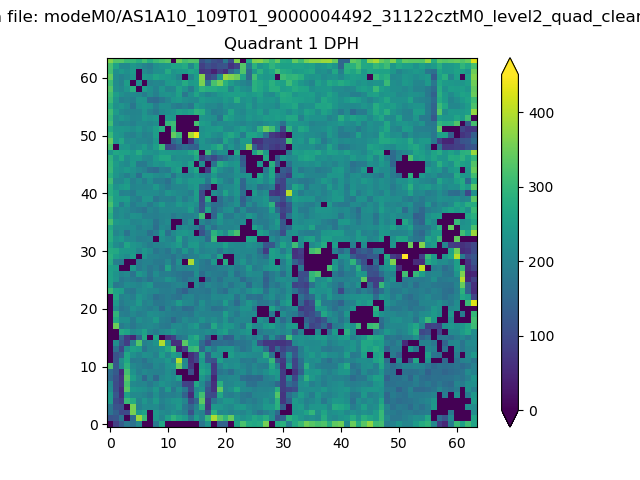 |
Quadrant B |
|---|---|---|---|
| Quadrant D | 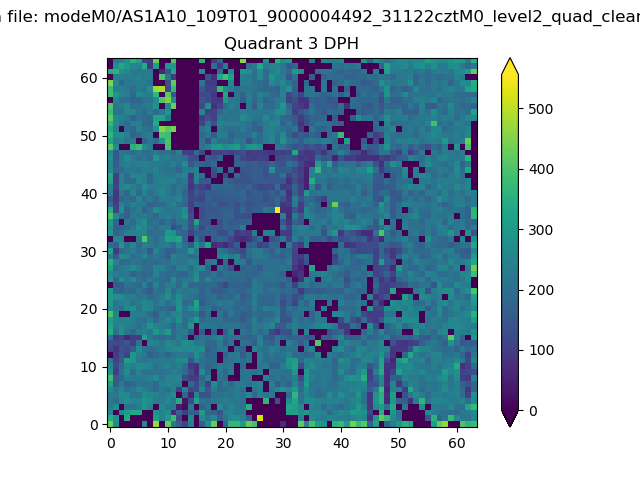 |
 |
Quadrant C |
| Plot type | Count rate plots | Images |
|---|---|---|
| Comparison with Poisson distribution Blue bars denote a histogram of data divided into 1 sec bins. Red curve is a Poisson curve with rate = median count rate of data. |
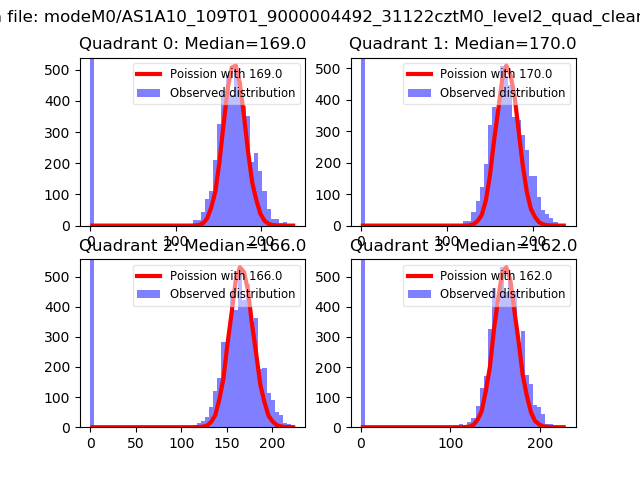 |
 |
| Quadrant-wise count rates Data is divided into 100 sec bins |
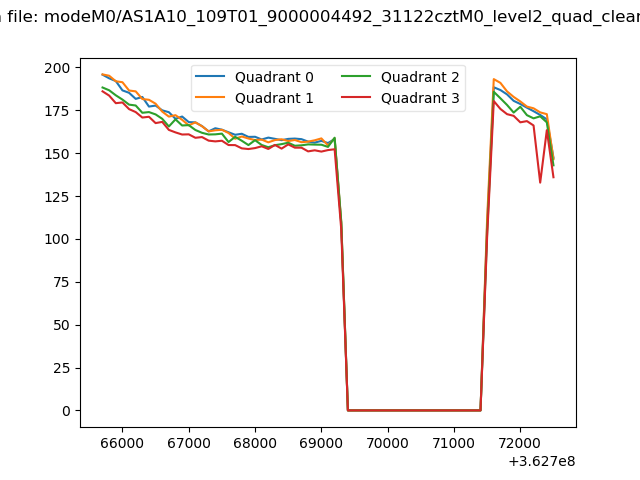 |
|
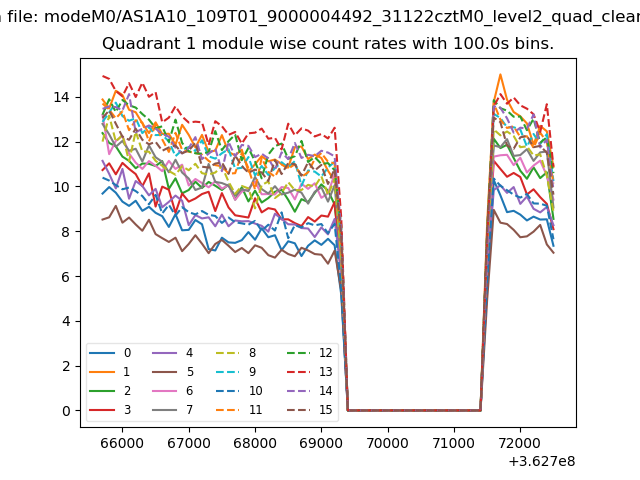
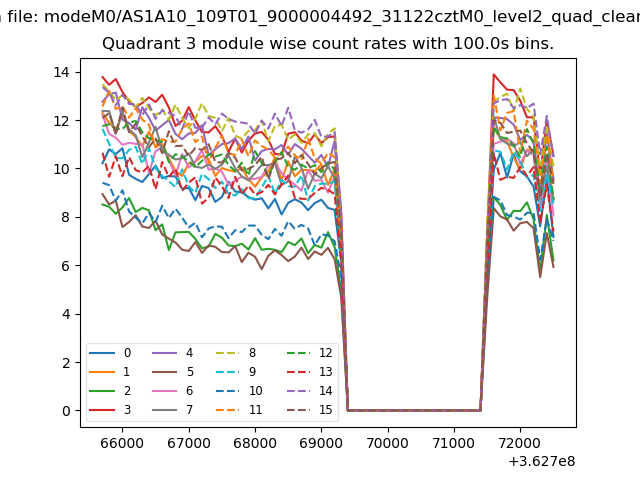
| Module-wise count rates for Quadrant A Data is divided into 100 sec bins |
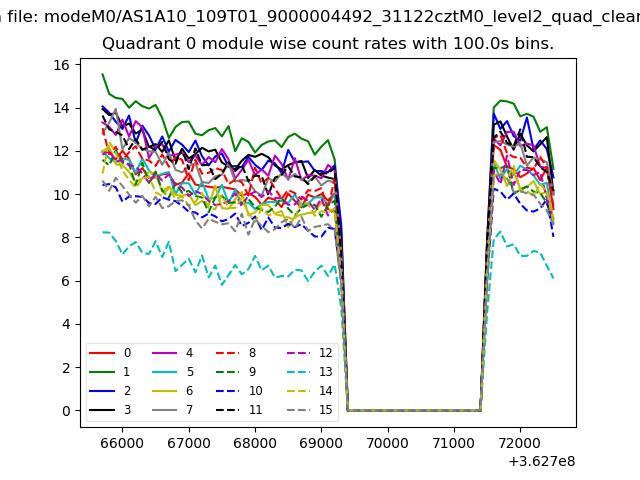 |
 |
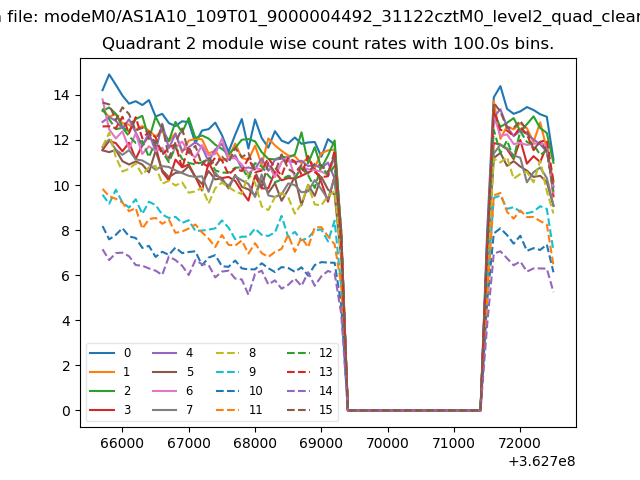
| Module-wise count rates for Quadrant B Data is divided into 100 sec bins |
 |
 |
| Module-wise count rates for Quadrant C Data is divided into 100 sec bins |
 |
 |
| Module-wise count rates for Quadrant D Data is divided into 100 sec bins |
 |
 |
| Parameter | Plot |
|---|---|
| CZT HV Monitor | 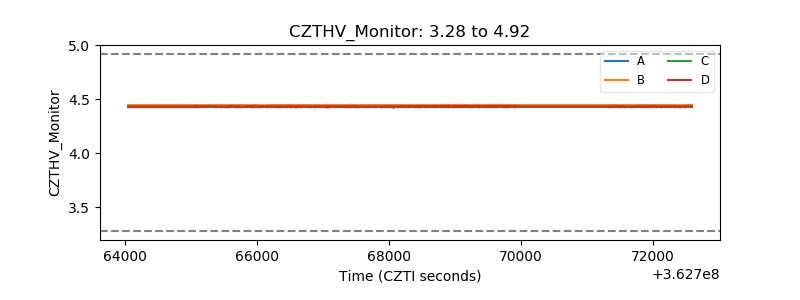 |
| D_VDD | 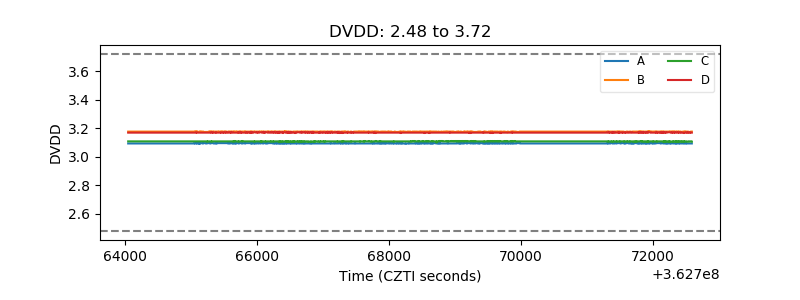 |
| Temperature 1 | 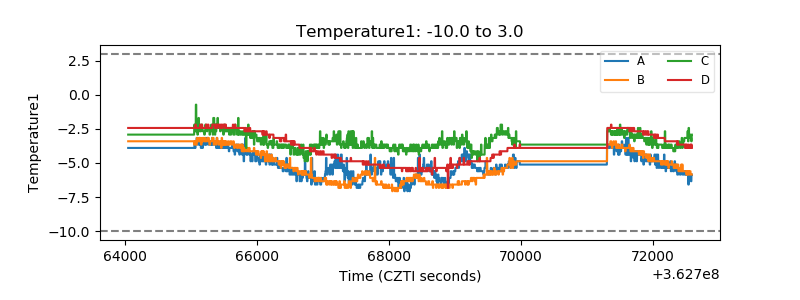 |
| Veto HV Monitor |  |
| Veto LLD | 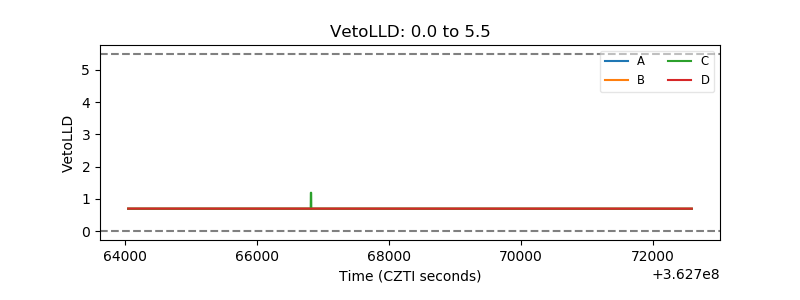 |
| Alpha Counter | 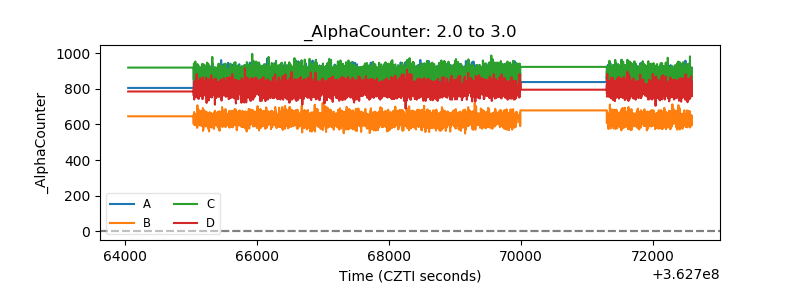 |
| _CPM_Rate | 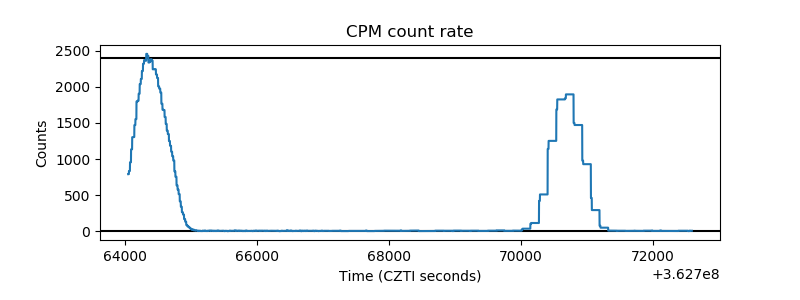 |
| CZT Counter | 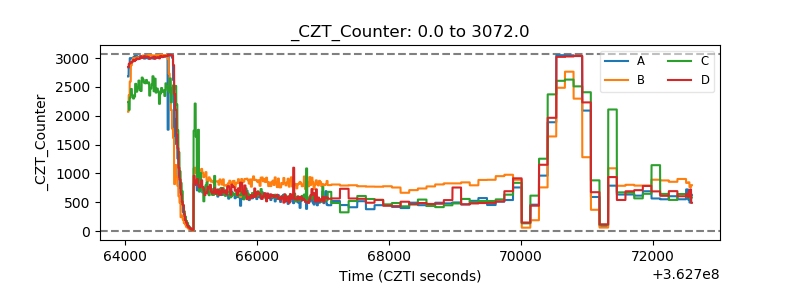 |
| +2.5 Volts monitor | 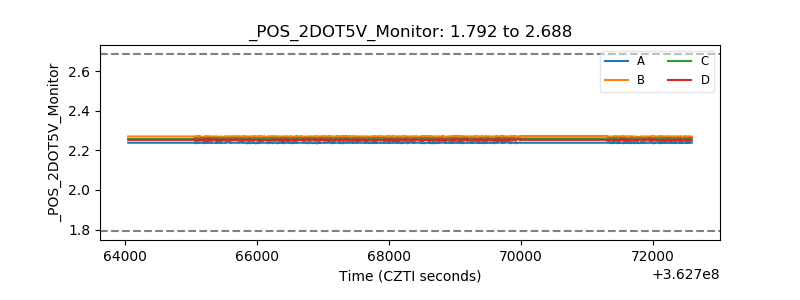 |
| +5 Volts monitor | 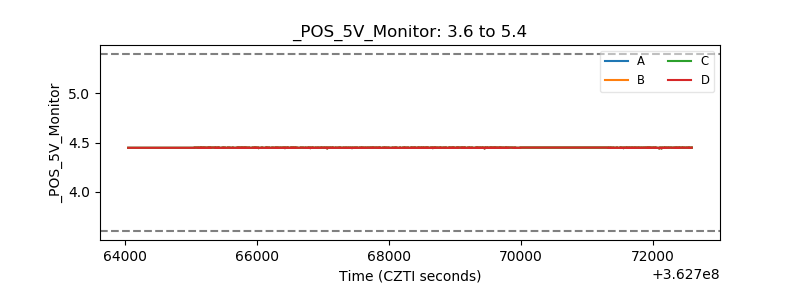 |
| _ROLL_ROT |  |
| _Roll_DEC |  |
| _Roll_RA | 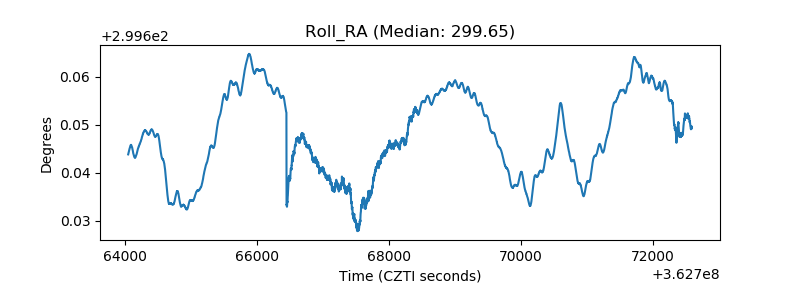 |
| Veto Counter | 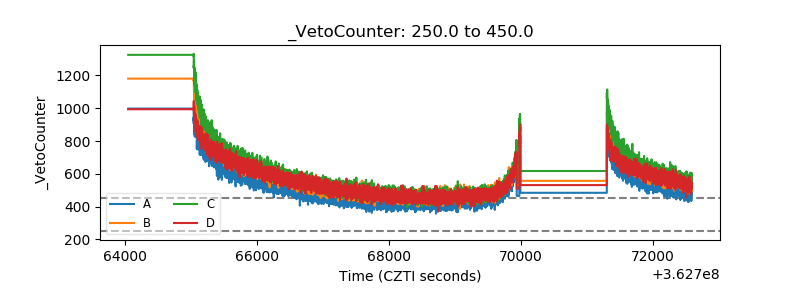 |