| Param | Original file | Final file |
|---|---|---|
| Filename | modeM0/AS1A10_109T01_9000004492_31123cztM0_level2.evt | modeM0/AS1A10_109T01_9000004492_31123cztM0_level2_quad_clean.evt |
| Size (bytes) | 537,572,160 | 120,274,560 |
| Size | 512.7 MB | 114.7 MB |
| Events in quadrant A | 3,330,402 | 815,415 |
| Events in quadrant B | 5,189,290 | 814,998 |
| Events in quadrant C | 3,673,526 | 794,687 |
| Events in quadrant D | 3,659,520 | 777,156 |
| Mode M0 | |||
|---|---|---|---|
| Quadrant | BADHDUFLAG | Total packets | Discarded packets |
| A | 0 | 13825 | 2 |
| B | 0 | 19311 | 2 |
| C | 0 | 14924 | 2 |
| D | 0 | 14999 | 2 |
| Mode SS | |||
|---|---|---|---|
| Quadrant | BADHDUFLAG | Total packets | Discarded packets |
| A | 0 | 128 | 0 |
| B | 0 | 128 | 0 |
| C | 0 | 128 | 0 |
| D | 0 | 128 | 0 |
| Mode M9 | |||
|---|---|---|---|
| Quadrant | BADHDUFLAG | Total packets | Discarded packets |
| A | 0 | 13 | 0 |
| B | 0 | 13 | 0 |
| C | 0 | 13 | 0 |
| D | 0 | 13 | 0 |
| Quadrant | Total seconds | Saturated seconds | Saturation percentage |
|---|---|---|---|
| A | 6315 | 37 | 0.585907% |
| B | 6316 | 143 | 2.264091% |
| C | 6316 | 229 | 3.625712% |
| D | 6316 | 65 | 1.029132% |
Noise dominated data is calculated using 1-second bins in cleaned event files. If a bin has >2000 counts, and if more than 50% of those come from <1% of pixels, then it is considered to be noise-dominated and hence unusable.
| Quadrant | # 1 sec bins | Bins with >0 counts | Bins with >2000 counts | High rate bins dominated by noise | Noise dominated (total time) | Noise dominated (detector-on time) | Marked lightcurve |
|---|---|---|---|---|---|---|---|
| A | 7575 | 6316 | 0 | 0 | 0.00% | 0.00% |  |
| B | 7576 | 6317 | 0 | 0 | 0.00% | 0.00% | 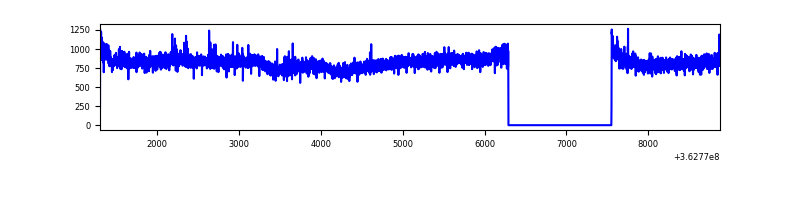 |
| C | 7576 | 6317 | 49 | 49 | 0.65% | 0.78% | 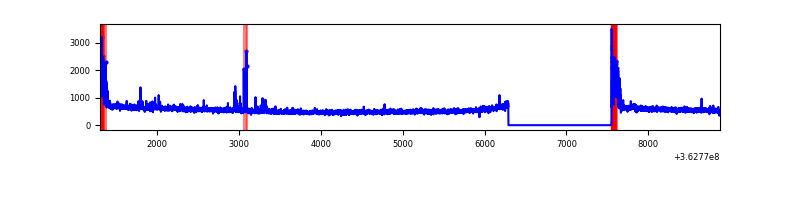 |
| D | 7576 | 6317 | 34 | 34 | 0.45% | 0.54% | 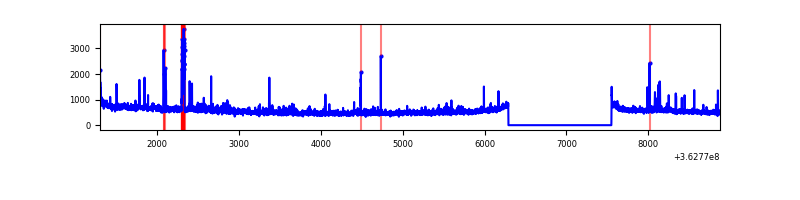 |
Top three noisy pixels from each quadrant. If the there are fewer than three noisy pixels in the level2.evt file, extra rows are filled as -1
| Pixel properties | Quadrant properties | ||||||
|---|---|---|---|---|---|---|---|
| Quadrant | DetID | PixID | Counts | Sigma | Mean | Median | Sigma |
| A | 8 | 144 | 11702 | 63.44 | 860 | 845 | 171.1 |
| A | 13 | 254 | 10951 | 59.05 | 860 | 845 | 171.1 |
| A | 3 | 137 | 8178 | 42.85 | 860 | 845 | 171.1 |
| B | 6 | 159 | 1821349 | 11344.69 | 850 | 832 | 160.5 |
| B | 0 | 183 | 19564 | 116.73 | 850 | 832 | 160.5 |
| B | 12 | 111 | 19311 | 115.15 | 850 | 832 | 160.5 |
| C | 0 | 10 | 261153 | 1344.16 | 833 | 842 | 193.7 |
| C | 14 | 238 | 136404 | 700.0 | 833 | 842 | 193.7 |
| C | 2 | 114 | 14079 | 68.35 | 833 | 842 | 193.7 |
| D | 8 | 195 | 323386 | 1606.95 | 844 | 827 | 200.7 |
| D | 2 | 120 | 95188 | 470.1 | 844 | 827 | 200.7 |
| D | 12 | 218 | 33394 | 162.25 | 844 | 827 | 200.7 |
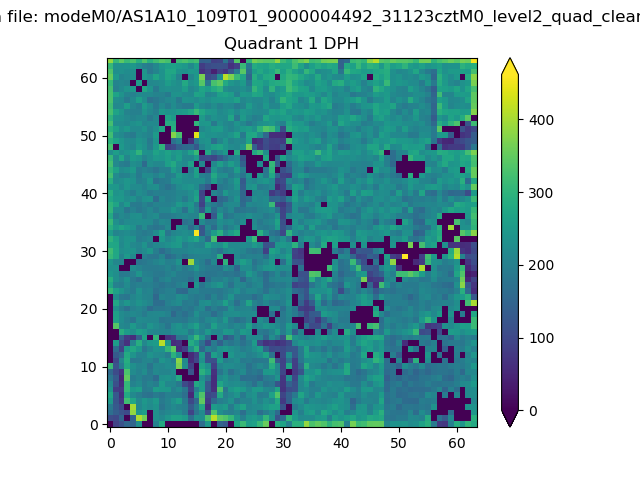
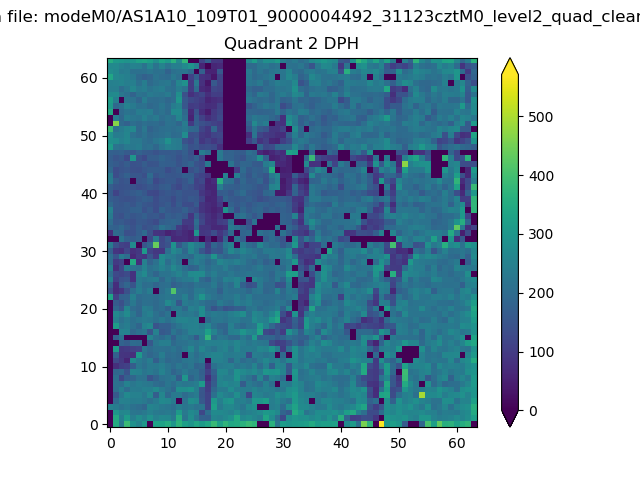
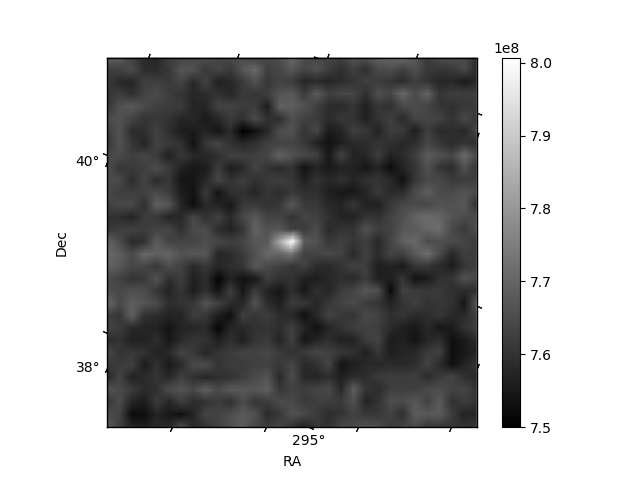
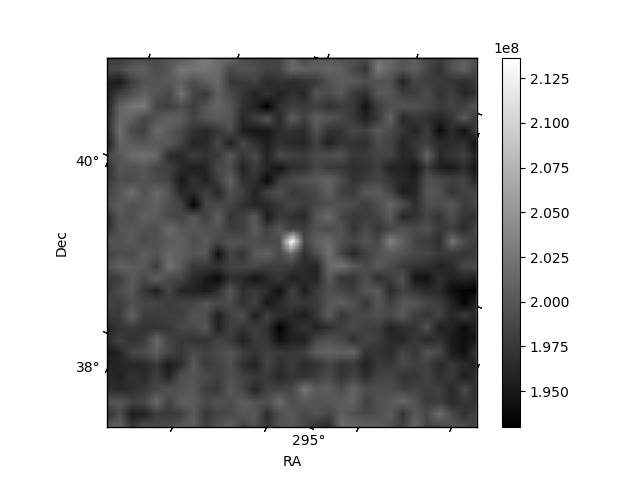
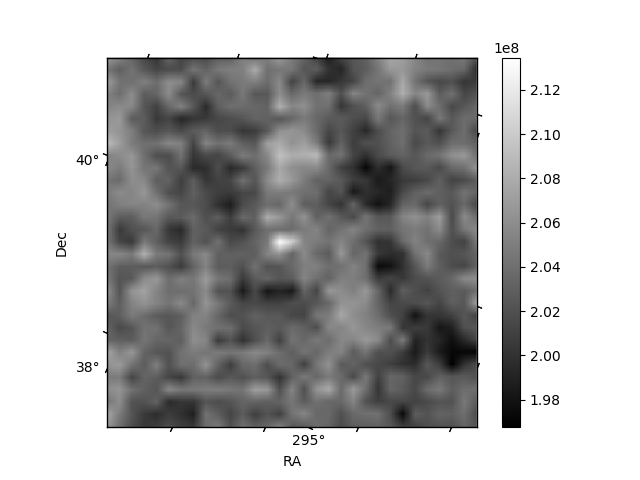
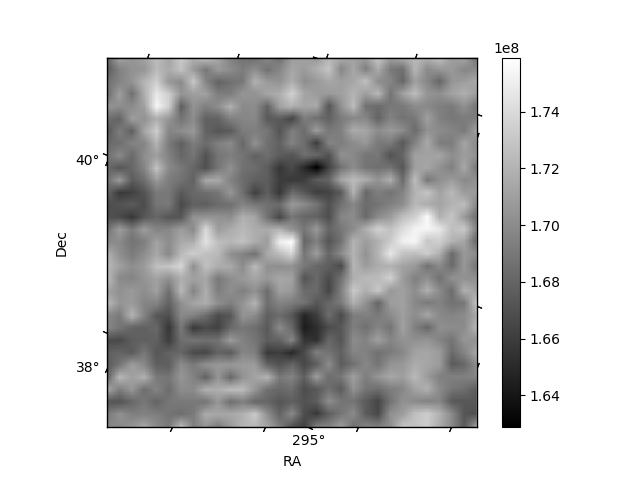
Histogram calculated using DETX and DETY for each event in the final _common_clean file
| Quadrant A | 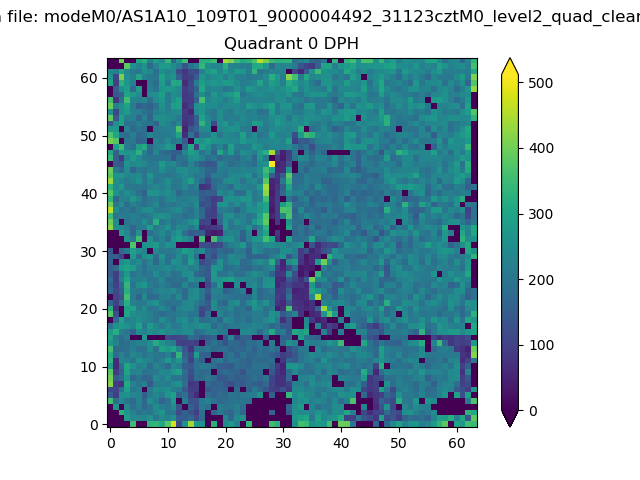 |
 |
Quadrant B |
|---|---|---|---|
| Quadrant D | 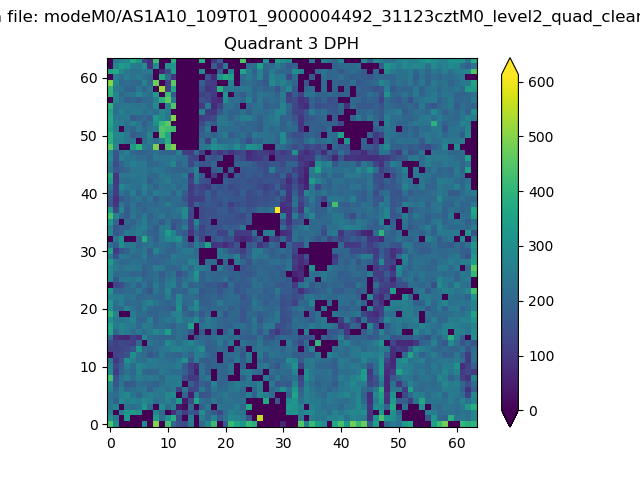 |
 |
Quadrant C |
| Plot type | Count rate plots | Images |
|---|---|---|
| Comparison with Poisson distribution Blue bars denote a histogram of data divided into 1 sec bins. Red curve is a Poisson curve with rate = median count rate of data. |
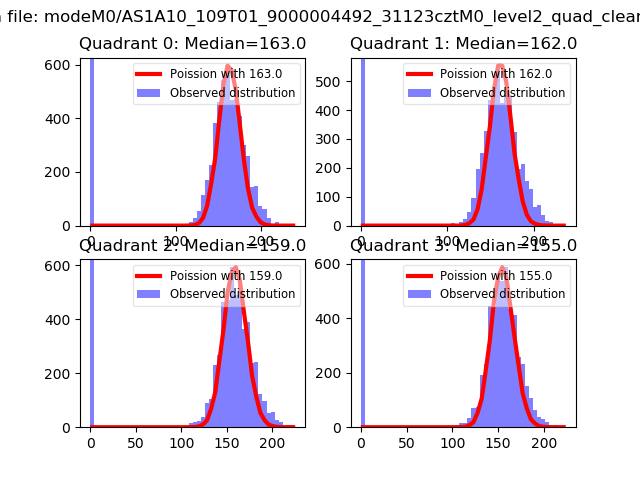 |
 |
| Quadrant-wise count rates Data is divided into 100 sec bins |
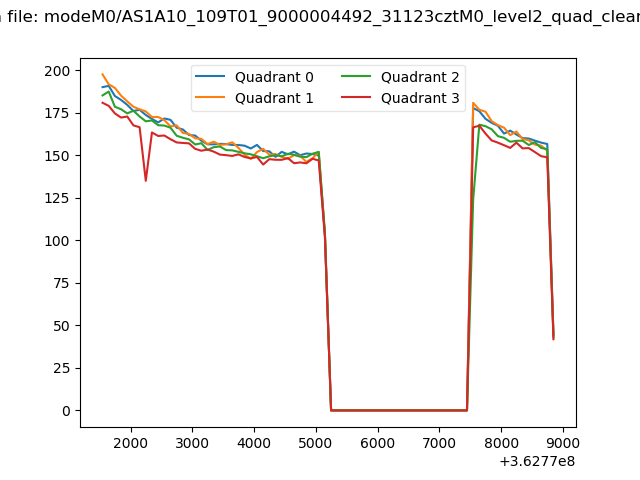 |
|
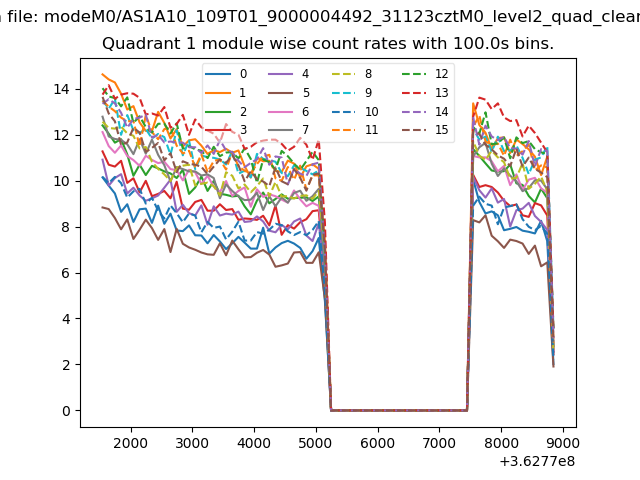
| Module-wise count rates for Quadrant A Data is divided into 100 sec bins |
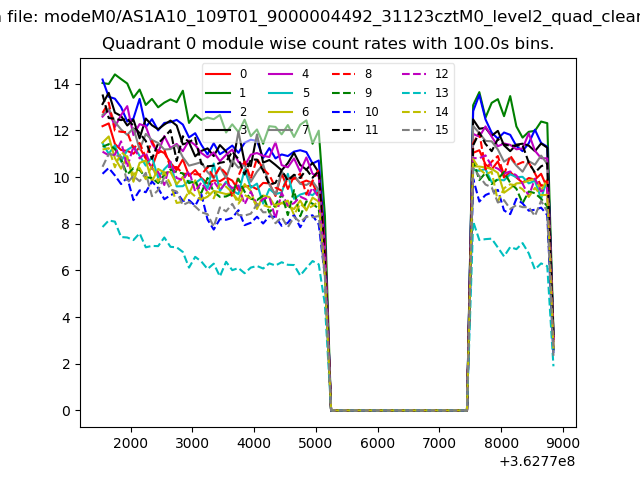 |
 |
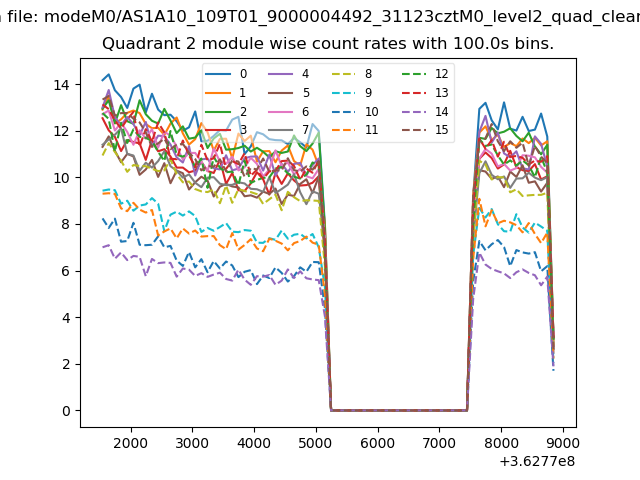
| Module-wise count rates for Quadrant B Data is divided into 100 sec bins |
 |
 |
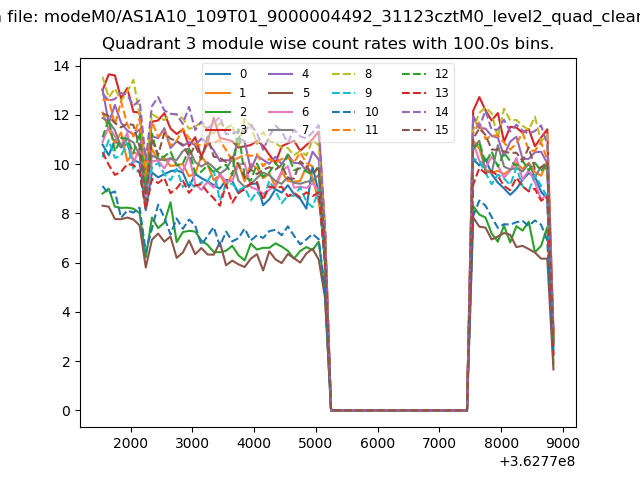
| Module-wise count rates for Quadrant C Data is divided into 100 sec bins |
 |
 |
| Module-wise count rates for Quadrant D Data is divided into 100 sec bins |
 |
 |
| Parameter | Plot |
|---|---|
| CZT HV Monitor | 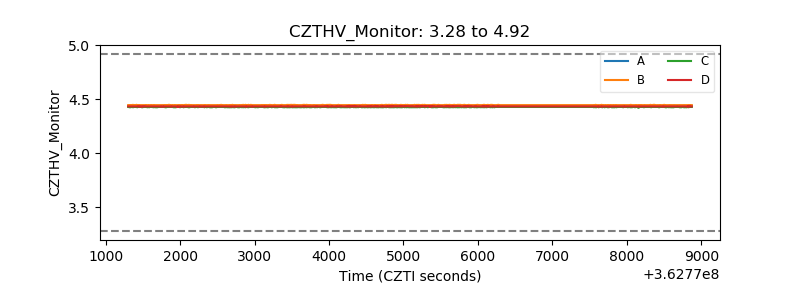 |
| D_VDD | 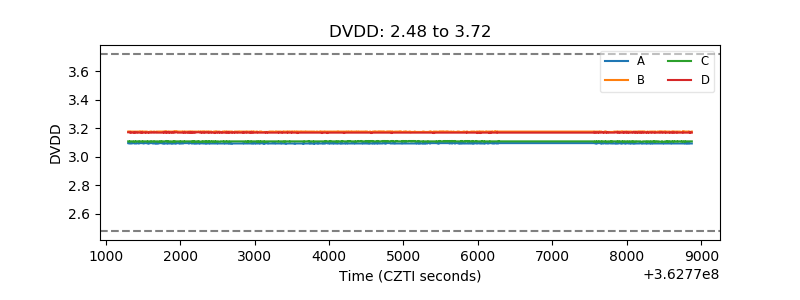 |
| Temperature 1 | 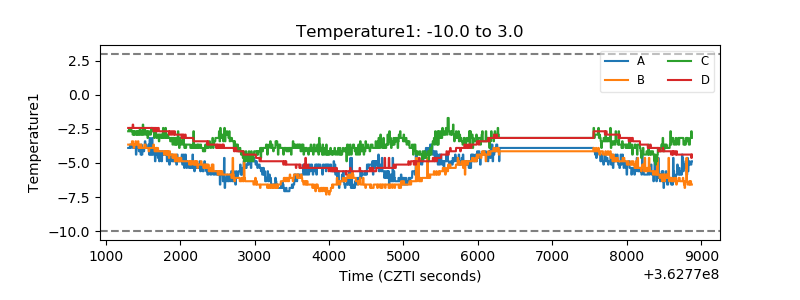 |
| Veto HV Monitor | 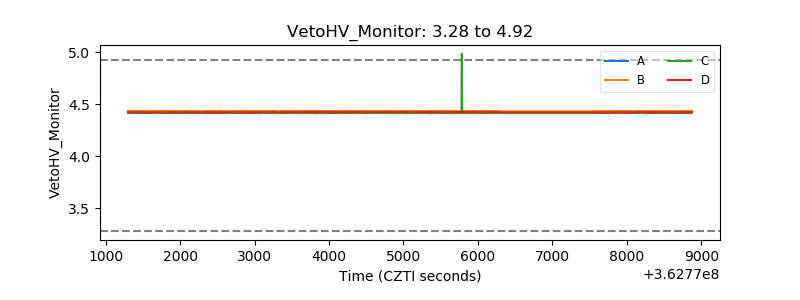 |
| Veto LLD | 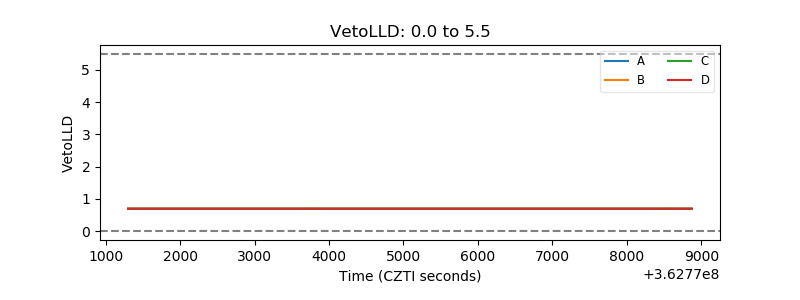 |
| Alpha Counter | 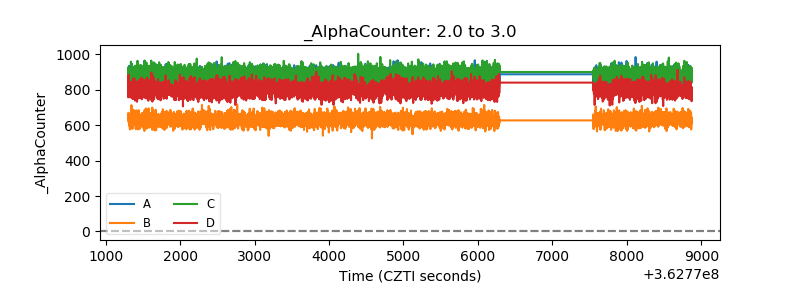 |
| _CPM_Rate | 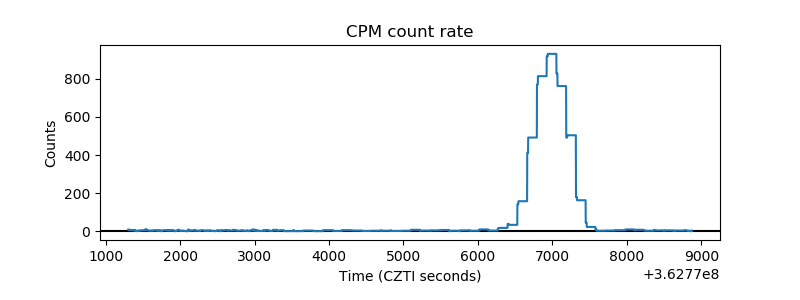 |
| CZT Counter | 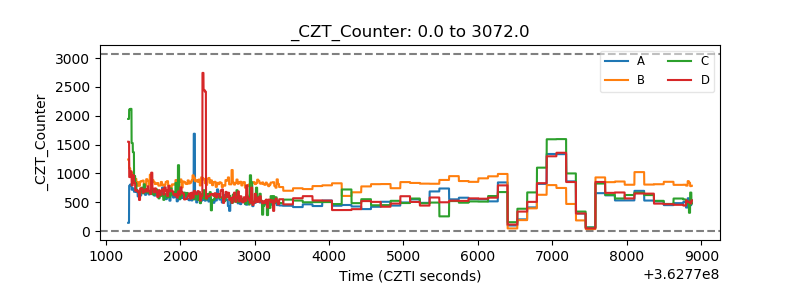 |
| +2.5 Volts monitor |  |
| +5 Volts monitor |  |
| _ROLL_ROT |  |
| _Roll_DEC |  |
| _Roll_RA | 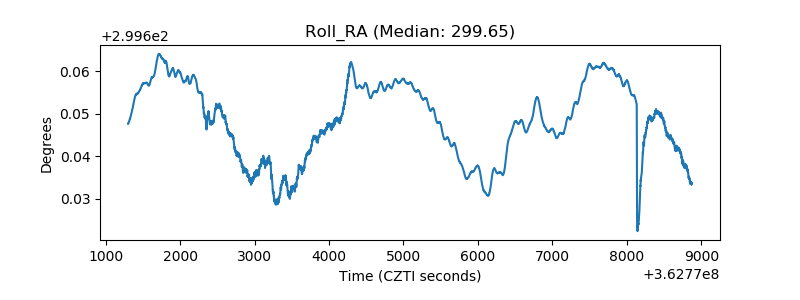 |
| Veto Counter | 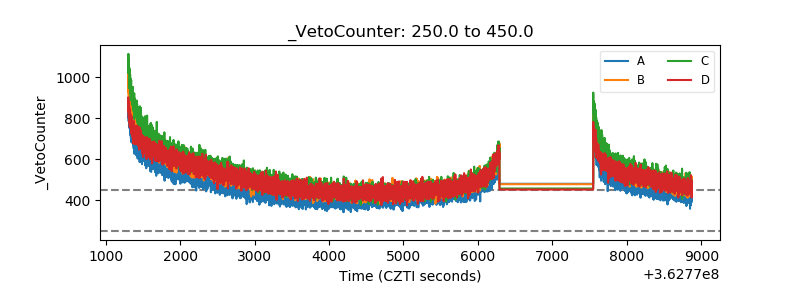 |