| Param | Original file | Final file |
|---|---|---|
| Filename | modeM0/AS1A10_109T01_9000004492_31125cztM0_level2.evt | modeM0/AS1A10_109T01_9000004492_31125cztM0_level2_quad_clean.evt |
| Size (bytes) | 596,969,280 | 112,403,520 |
| Size | 569.3 MB | 107.2 MB |
| Events in quadrant A | 3,705,719 | 739,507 |
| Events in quadrant B | 5,904,807 | 730,781 |
| Events in quadrant C | 3,973,990 | 710,980 |
| Events in quadrant D | 3,988,758 | 703,152 |
| Mode M0 | |||
|---|---|---|---|
| Quadrant | BADHDUFLAG | Total packets | Discarded packets |
| A | 0 | 15810 | 3 |
| B | 0 | 22865 | 3 |
| C | 0 | 16435 | 3 |
| D | 0 | 16819 | 3 |
| Mode SS | |||
|---|---|---|---|
| Quadrant | BADHDUFLAG | Total packets | Discarded packets |
| A | 0 | 154 | 0 |
| B | 0 | 154 | 0 |
| C | 0 | 154 | 0 |
| D | 0 | 154 | 0 |
| Mode M9 | |||
|---|---|---|---|
| Quadrant | BADHDUFLAG | Total packets | Discarded packets |
| A | 0 | 14 | 0 |
| B | 0 | 14 | 0 |
| C | 0 | 14 | 0 |
| D | 0 | 14 | 0 |
| Quadrant | Total seconds | Saturated seconds | Saturation percentage |
|---|---|---|---|
| A | 7469 | 53 | 0.709600% |
| B | 7469 | 192 | 2.570625% |
| C | 7469 | 215 | 2.878565% |
| D | 7470 | 54 | 0.722892% |
Noise dominated data is calculated using 1-second bins in cleaned event files. If a bin has >2000 counts, and if more than 50% of those come from <1% of pixels, then it is considered to be noise-dominated and hence unusable.
| Quadrant | # 1 sec bins | Bins with >0 counts | Bins with >2000 counts | High rate bins dominated by noise | Noise dominated (total time) | Noise dominated (detector-on time) | Marked lightcurve |
|---|---|---|---|---|---|---|---|
| A | 8914 | 7472 | 0 | 0 | 0.00% | 0.00% | 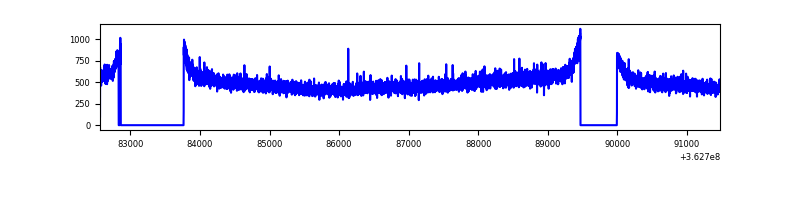 |
| B | 8914 | 7472 | 2 | 2 | 0.02% | 0.03% | 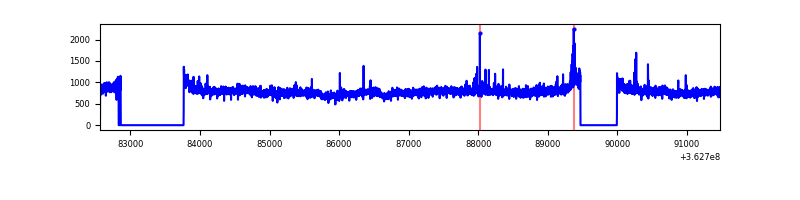 |
| C | 8914 | 7472 | 13 | 13 | 0.15% | 0.17% | 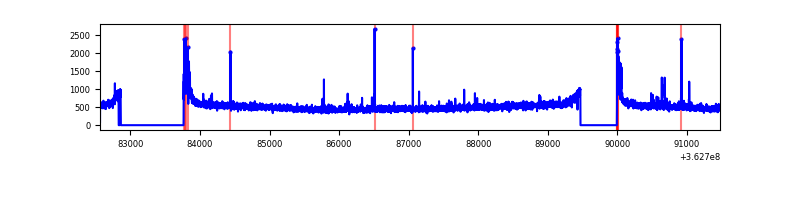 |
| D | 8915 | 7473 | 8 | 8 | 0.09% | 0.11% | 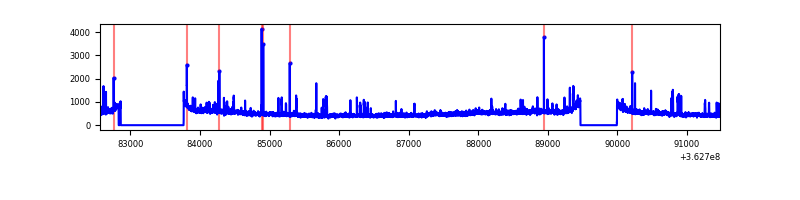 |
Top three noisy pixels from each quadrant. If the there are fewer than three noisy pixels in the level2.evt file, extra rows are filled as -1
| Pixel properties | Quadrant properties | ||||||
|---|---|---|---|---|---|---|---|
| Quadrant | DetID | PixID | Counts | Sigma | Mean | Median | Sigma |
| A | 13 | 254 | 11403 | 54.06 | 960 | 943 | 193.5 |
| A | 3 | 137 | 9910 | 46.34 | 960 | 943 | 193.5 |
| A | 0 | 226 | 7779 | 35.33 | 960 | 943 | 193.5 |
| B | 6 | 159 | 2072665 | 11319.1 | 946 | 924 | 183.0 |
| B | 0 | 183 | 38100 | 203.11 | 946 | 924 | 183.0 |
| B | 4 | 80 | 30451 | 161.32 | 946 | 924 | 183.0 |
| C | 0 | 10 | 159291 | 728.06 | 927 | 936 | 217.5 |
| C | 14 | 238 | 149233 | 681.81 | 927 | 936 | 217.5 |
| C | 10 | 22 | 19378 | 84.79 | 927 | 936 | 217.5 |
| D | 8 | 195 | 386800 | 1746.47 | 935 | 912 | 221.0 |
| D | 2 | 250 | 59059 | 263.16 | 935 | 912 | 221.0 |
| D | 2 | 234 | 28232 | 123.65 | 935 | 912 | 221.0 |
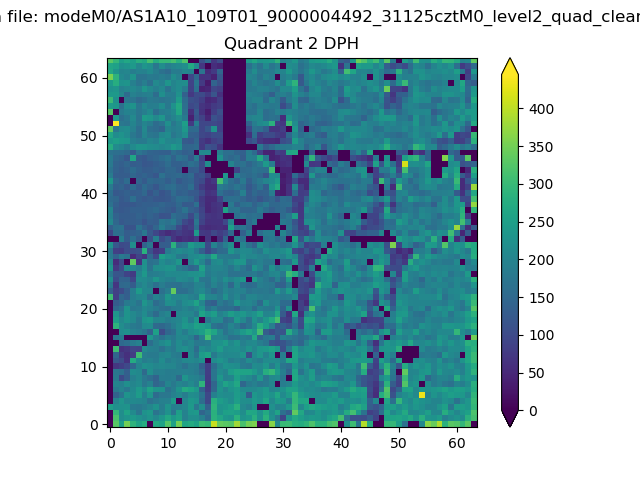
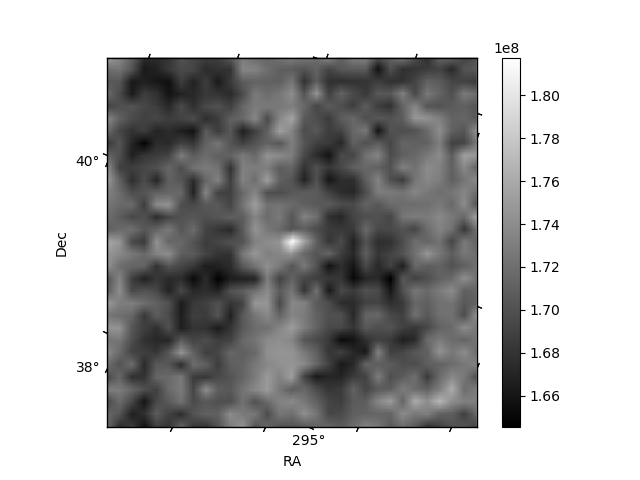
Histogram calculated using DETX and DETY for each event in the final _common_clean file
| Quadrant A | 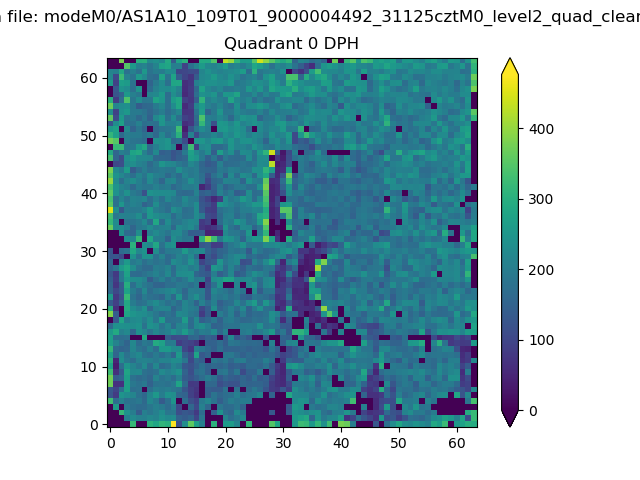 |
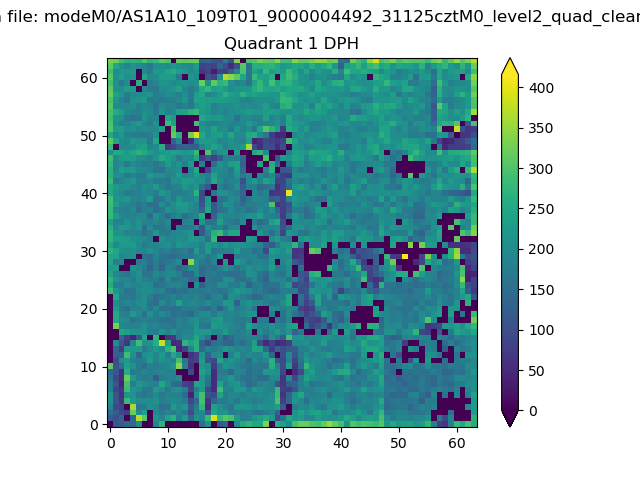 |
Quadrant B |
|---|---|---|---|
| Quadrant D | 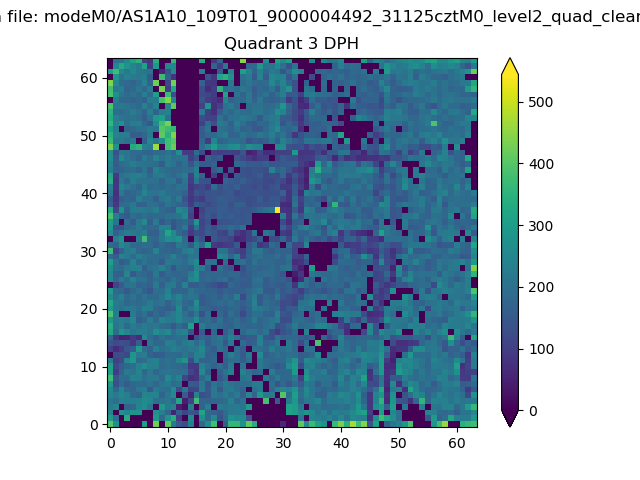 |
 |
Quadrant C |
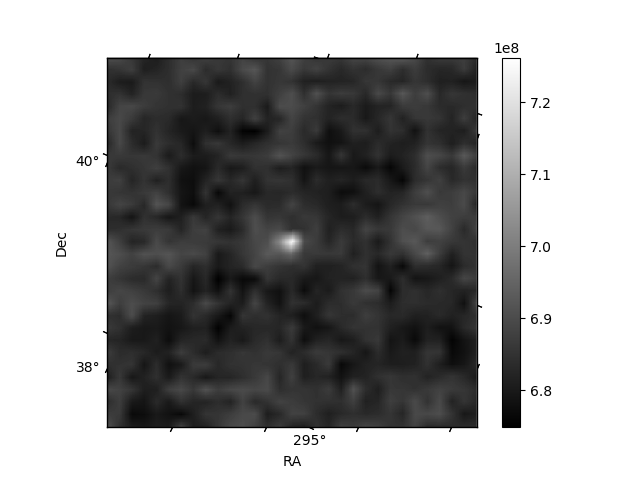
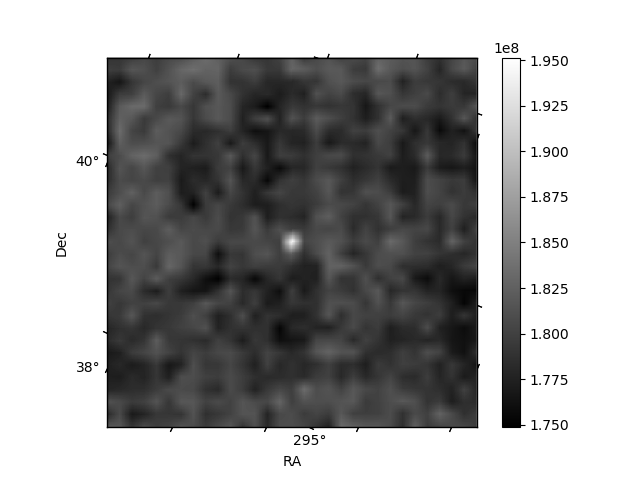
| Plot type | Count rate plots | Images |
|---|---|---|
| Comparison with Poisson distribution Blue bars denote a histogram of data divided into 1 sec bins. Red curve is a Poisson curve with rate = median count rate of data. |
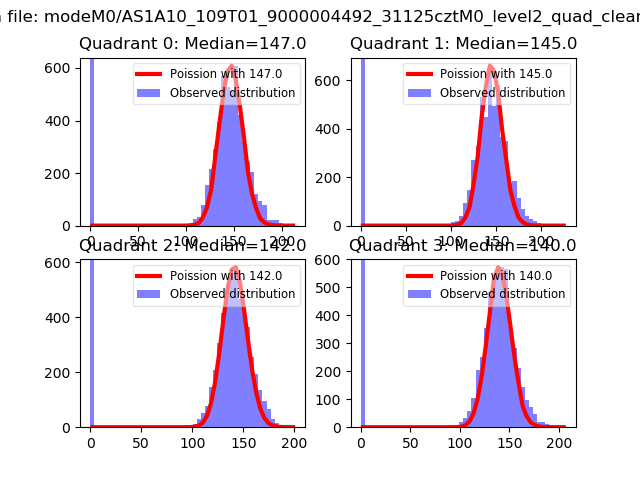 |
 |
| Quadrant-wise count rates Data is divided into 100 sec bins |
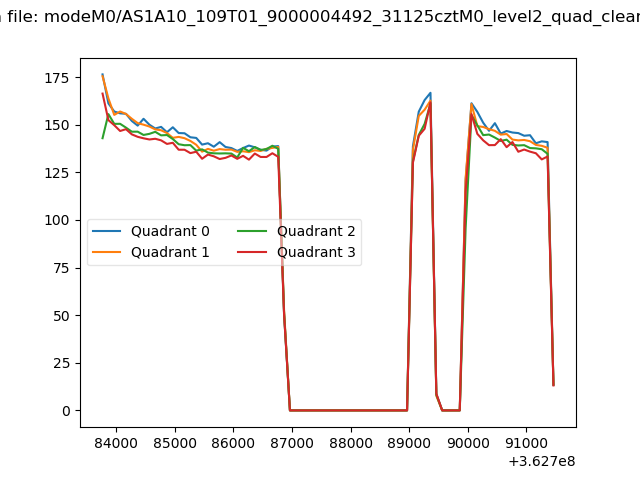 |
|
| Module-wise count rates for Quadrant A Data is divided into 100 sec bins |
 |
 |
| Module-wise count rates for Quadrant B Data is divided into 100 sec bins |
 |
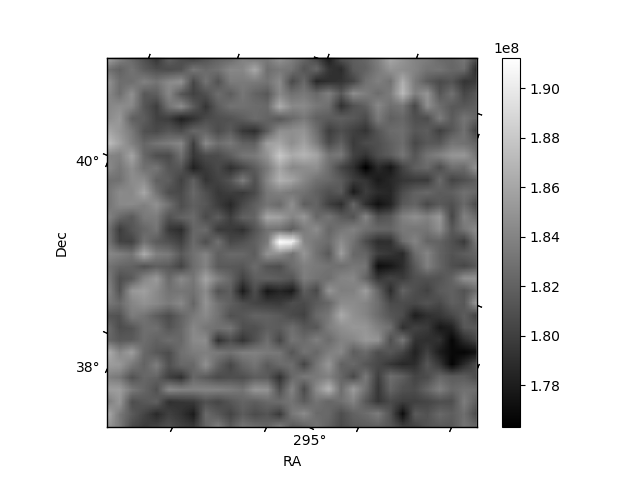 |
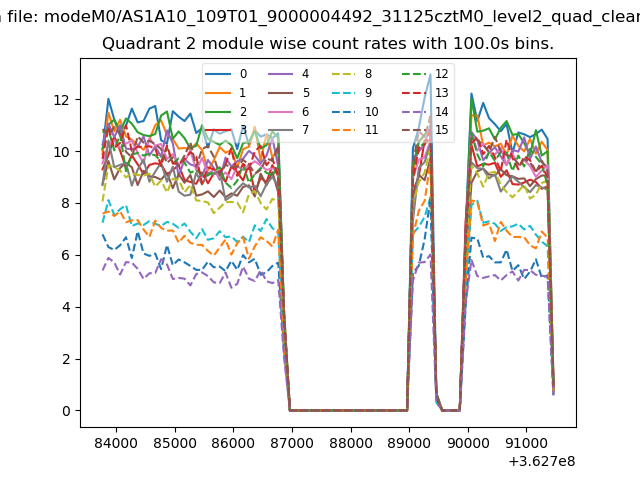
| Module-wise count rates for Quadrant C Data is divided into 100 sec bins |
 |
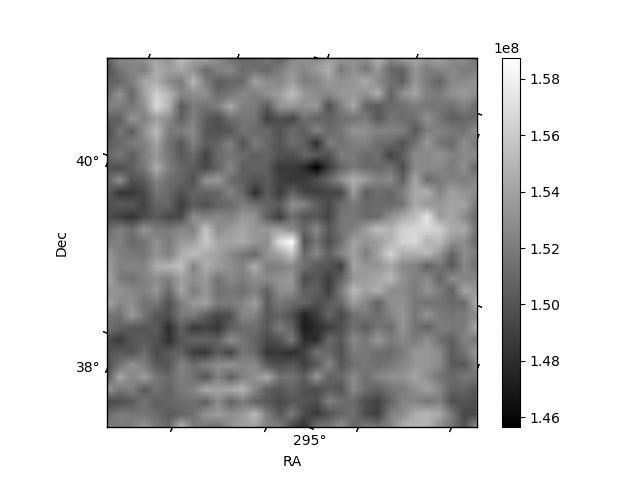 |
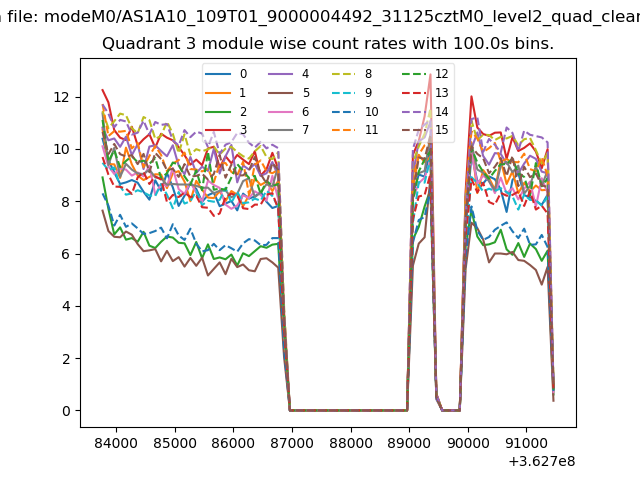
| Module-wise count rates for Quadrant D Data is divided into 100 sec bins |
 |
 |
| Parameter | Plot |
|---|---|
| CZT HV Monitor | 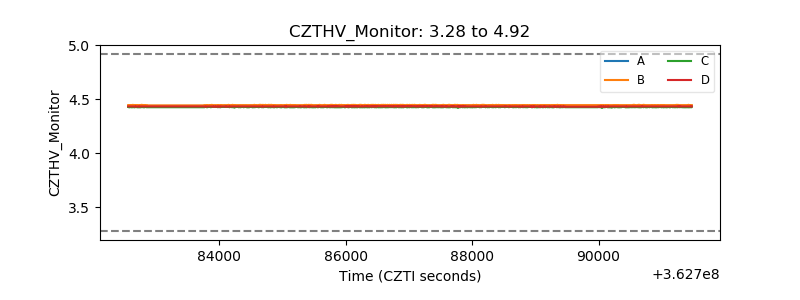 |
| D_VDD | 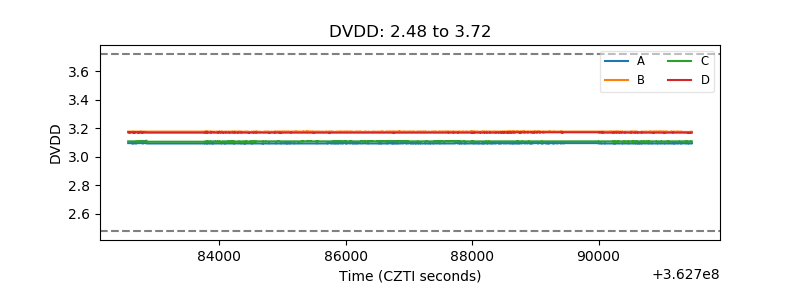 |
| Temperature 1 |  |
| Veto HV Monitor | 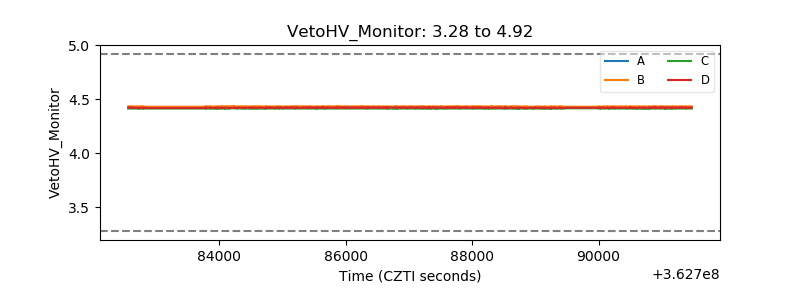 |
| Veto LLD |  |
| Alpha Counter | 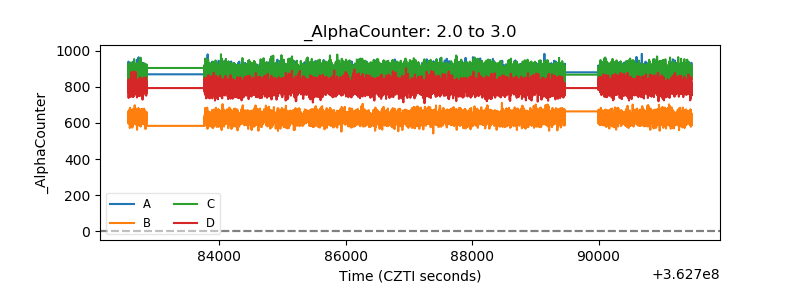 |
| _CPM_Rate | 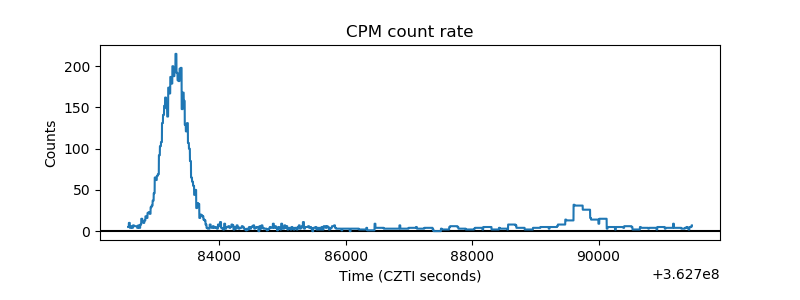 |
| CZT Counter | 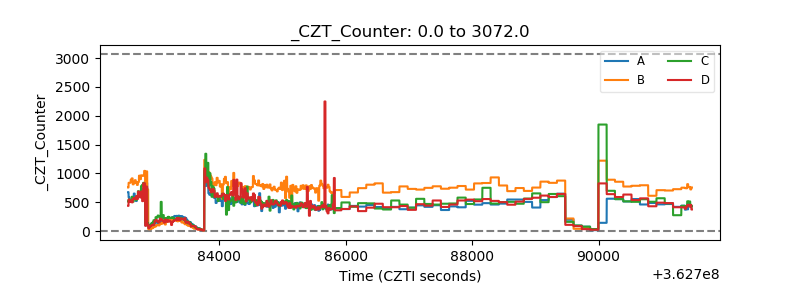 |
| +2.5 Volts monitor |  |
| +5 Volts monitor | 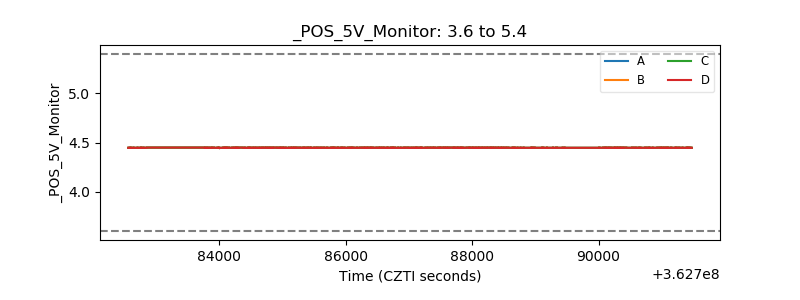 |
| _ROLL_ROT |  |
| _Roll_DEC | 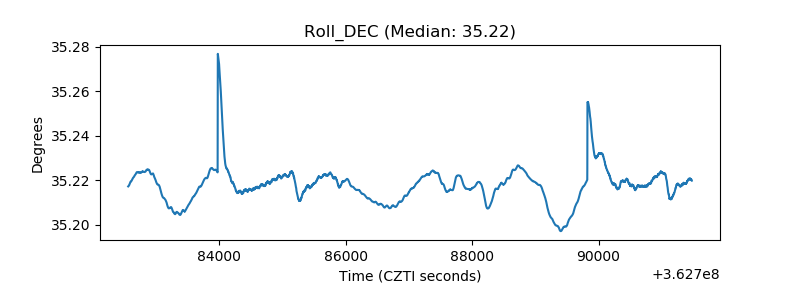 |
| _Roll_RA | 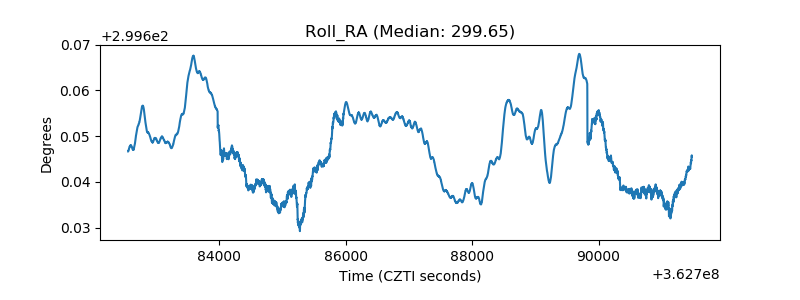 |
| Veto Counter | 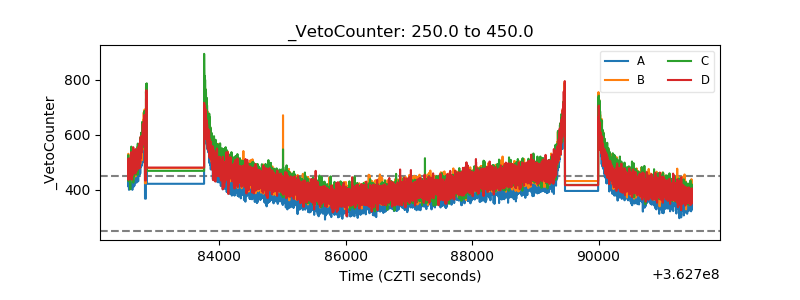 |