| Param | Original file | Final file |
|---|---|---|
| Filename | modeM0/AS1A10_109T01_9000004492_31126cztM0_level2.evt | modeM0/AS1A10_109T01_9000004492_31126cztM0_level2_quad_clean.evt |
| Size (bytes) | 466,879,680 | 84,003,840 |
| Size | 445.3 MB | 80.1 MB |
| Events in quadrant A | 2,874,744 | 547,385 |
| Events in quadrant B | 4,583,654 | 538,545 |
| Events in quadrant C | 3,093,230 | 524,423 |
| Events in quadrant D | 3,187,385 | 521,192 |
| Mode M0 | |||
|---|---|---|---|
| Quadrant | BADHDUFLAG | Total packets | Discarded packets |
| A | 0 | 12347 | 1 |
| B | 0 | 17949 | 1 |
| C | 0 | 13006 | 1 |
| D | 0 | 13505 | 1 |
| Mode SS | |||
|---|---|---|---|
| Quadrant | BADHDUFLAG | Total packets | Discarded packets |
| A | 0 | 120 | 0 |
| B | 0 | 120 | 0 |
| C | 0 | 120 | 0 |
| D | 0 | 120 | 0 |
| Mode M9 | |||
|---|---|---|---|
| Quadrant | BADHDUFLAG | Total packets | Discarded packets |
| A | 0 | 5 | 0 |
| B | 0 | 5 | 0 |
| C | 0 | 5 | 0 |
| D | 0 | 5 | 0 |
| Quadrant | Total seconds | Saturated seconds | Saturation percentage |
|---|---|---|---|
| A | 5900 | 28 | 0.474576% |
| B | 5901 | 113 | 1.914930% |
| C | 5901 | 136 | 2.304694% |
| D | 5901 | 65 | 1.101508% |
Noise dominated data is calculated using 1-second bins in cleaned event files. If a bin has >2000 counts, and if more than 50% of those come from <1% of pixels, then it is considered to be noise-dominated and hence unusable.
| Quadrant | # 1 sec bins | Bins with >0 counts | Bins with >2000 counts | High rate bins dominated by noise | Noise dominated (total time) | Noise dominated (detector-on time) | Marked lightcurve |
|---|---|---|---|---|---|---|---|
| A | 6425 | 5901 | 0 | 0 | 0.00% | 0.00% | 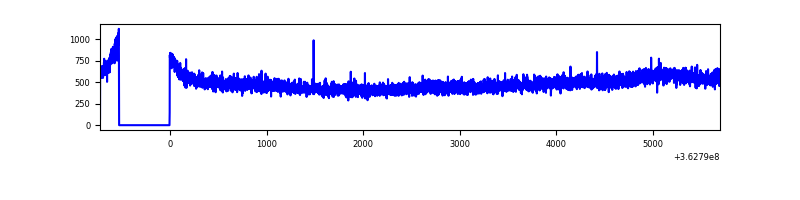 |
| B | 6426 | 5902 | 1 | 1 | 0.02% | 0.02% | 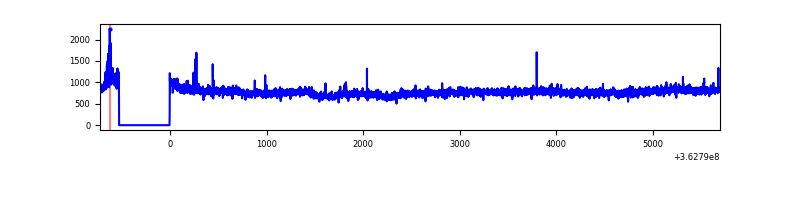 |
| C | 6426 | 5902 | 8 | 8 | 0.12% | 0.14% | 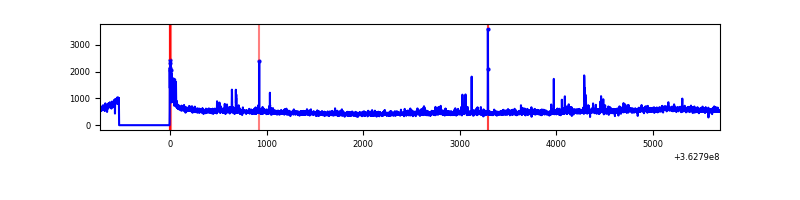 |
| D | 6426 | 5902 | 49 | 49 | 0.76% | 0.83% | 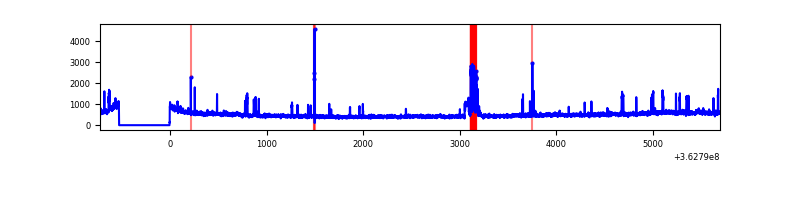 |
Top three noisy pixels from each quadrant. If the there are fewer than three noisy pixels in the level2.evt file, extra rows are filled as -1
| Pixel properties | Quadrant properties | ||||||
|---|---|---|---|---|---|---|---|
| Quadrant | DetID | PixID | Counts | Sigma | Mean | Median | Sigma |
| A | 13 | 254 | 8853 | 53.67 | 745 | 732 | 151.3 |
| A | 3 | 137 | 7773 | 46.53 | 745 | 732 | 151.3 |
| A | 0 | 226 | 6102 | 35.49 | 745 | 732 | 151.3 |
| B | 6 | 159 | 1631261 | 11452.33 | 733 | 715 | 142.4 |
| B | 0 | 183 | 25565 | 174.54 | 733 | 715 | 142.4 |
| B | 4 | 80 | 24205 | 164.98 | 733 | 715 | 142.4 |
| C | 14 | 238 | 115939 | 684.11 | 713 | 718 | 168.4 |
| C | 0 | 10 | 113576 | 670.08 | 713 | 718 | 168.4 |
| C | 10 | 22 | 64036 | 375.94 | 713 | 718 | 168.4 |
| D | 8 | 195 | 281360 | 1647.03 | 721 | 704 | 170.4 |
| D | 2 | 120 | 155386 | 907.75 | 721 | 704 | 170.4 |
| D | 2 | 250 | 31531 | 180.91 | 721 | 704 | 170.4 |
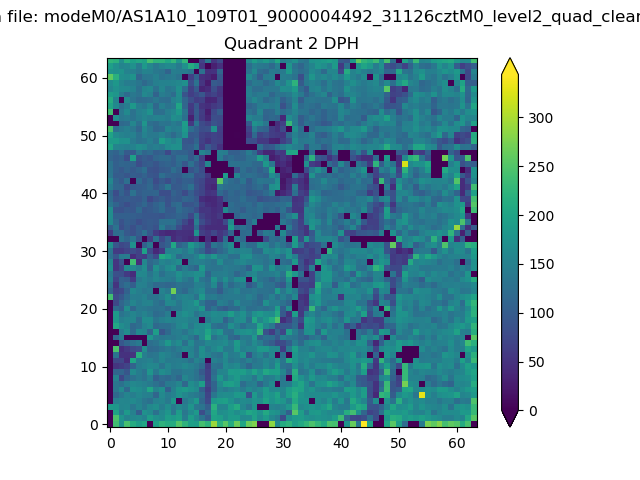
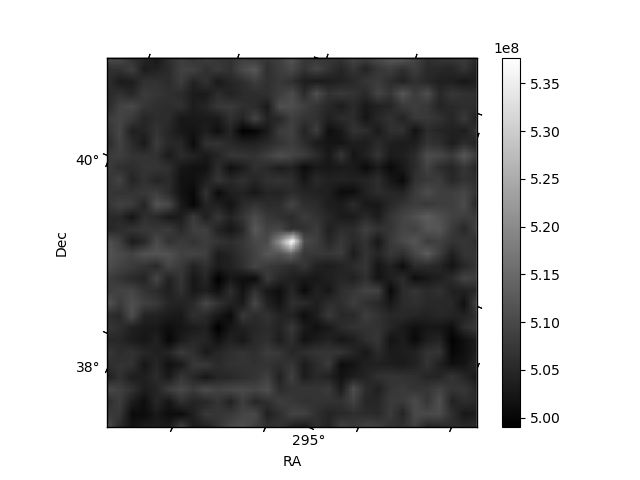
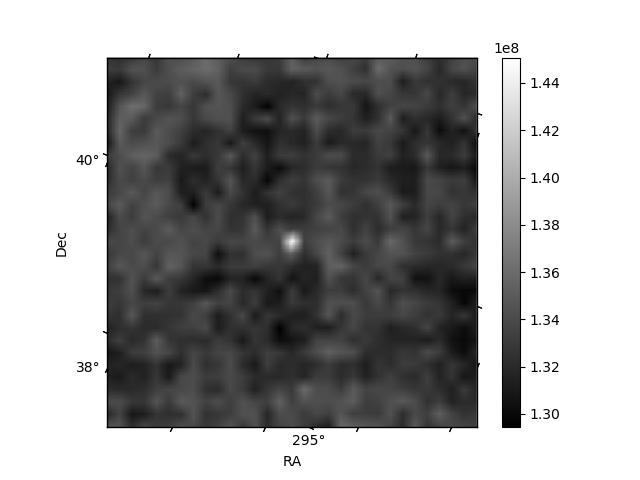
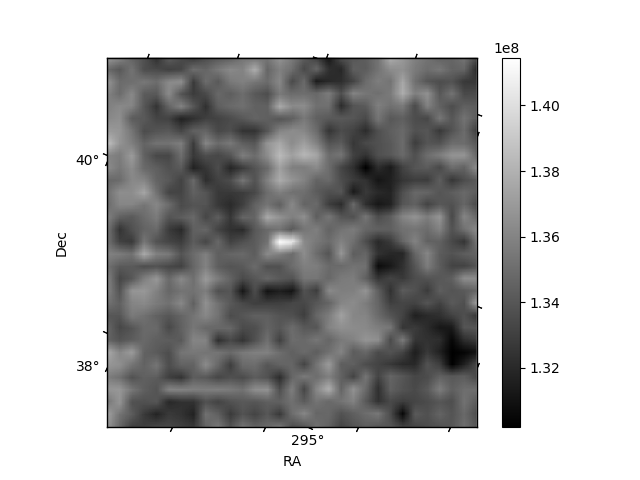
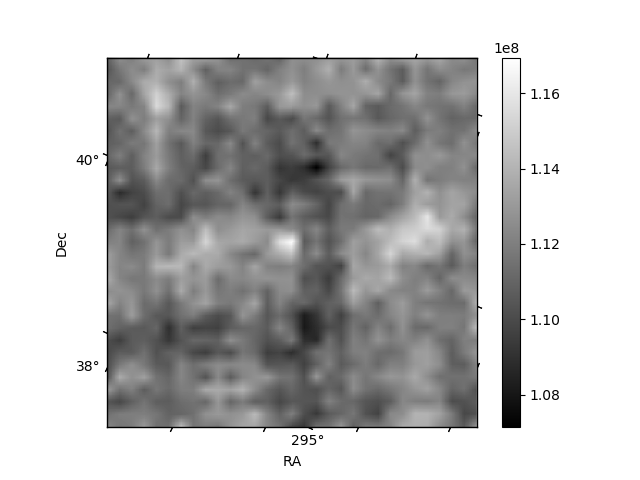
Histogram calculated using DETX and DETY for each event in the final _common_clean file
| Quadrant A | 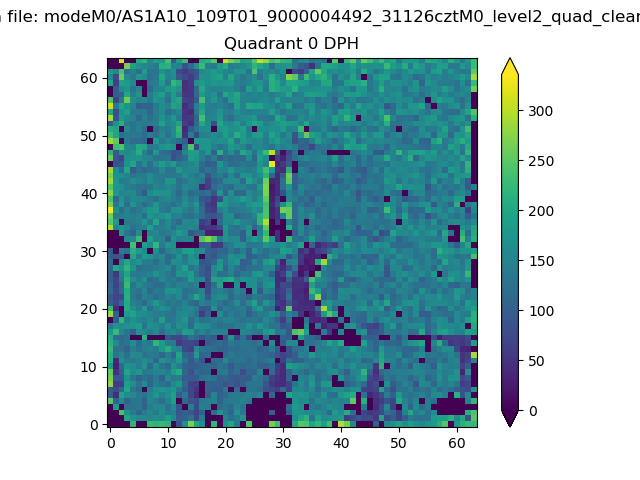 |
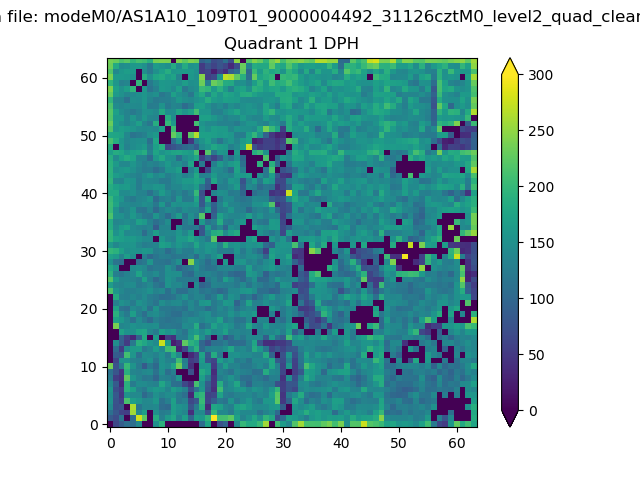 |
Quadrant B |
|---|---|---|---|
| Quadrant D | 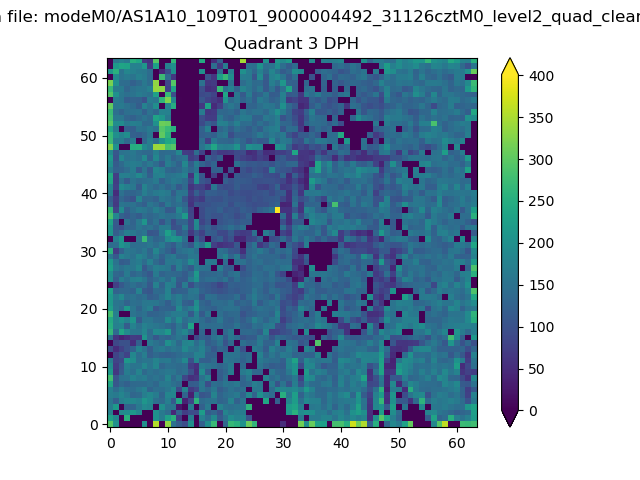 |
 |
Quadrant C |
| Plot type | Count rate plots | Images |
|---|---|---|
| Comparison with Poisson distribution Blue bars denote a histogram of data divided into 1 sec bins. Red curve is a Poisson curve with rate = median count rate of data. |
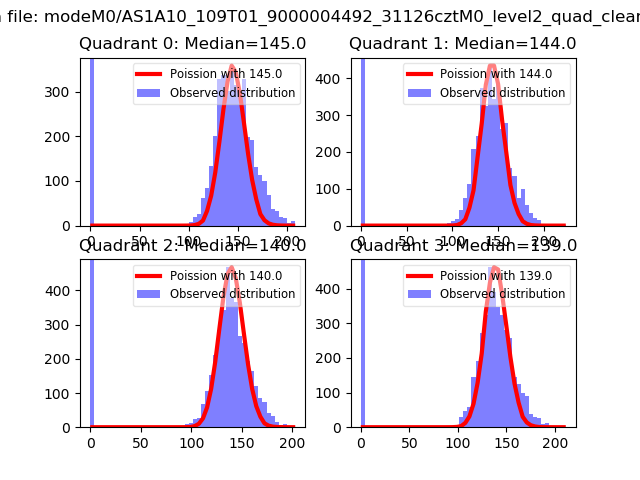 |
 |
| Quadrant-wise count rates Data is divided into 100 sec bins |
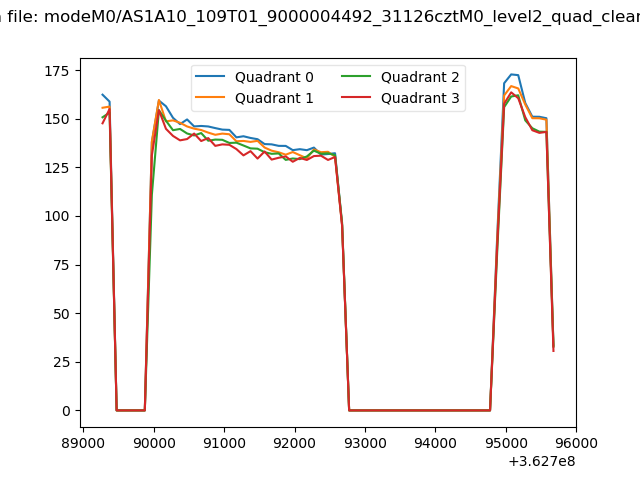 |
|
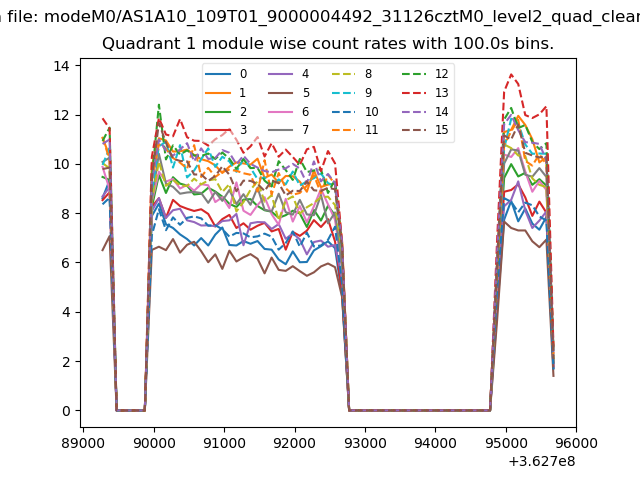
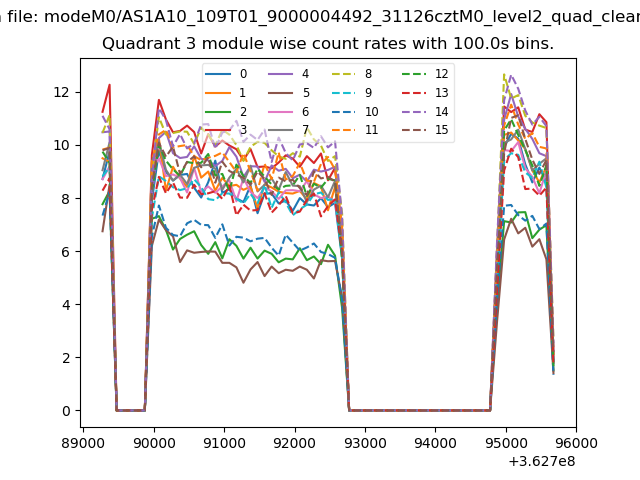
| Module-wise count rates for Quadrant A Data is divided into 100 sec bins |
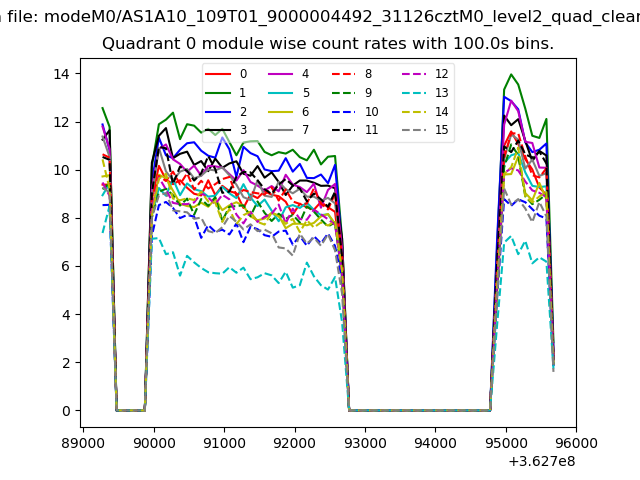 |
 |
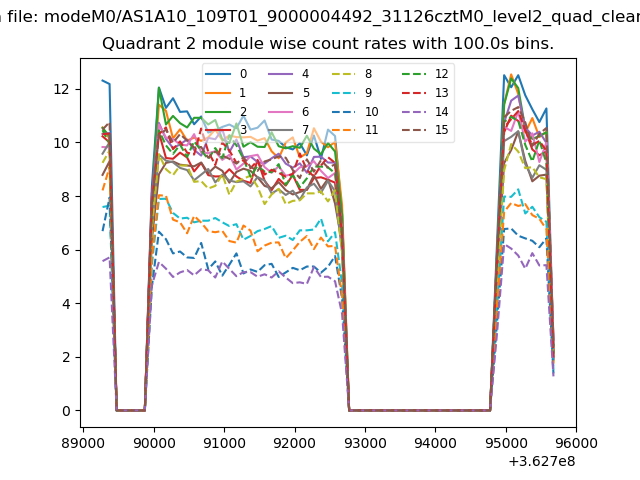
| Module-wise count rates for Quadrant B Data is divided into 100 sec bins |
 |
 |
| Module-wise count rates for Quadrant C Data is divided into 100 sec bins |
 |
 |
| Module-wise count rates for Quadrant D Data is divided into 100 sec bins |
 |
 |
| Parameter | Plot |
|---|---|
| CZT HV Monitor | 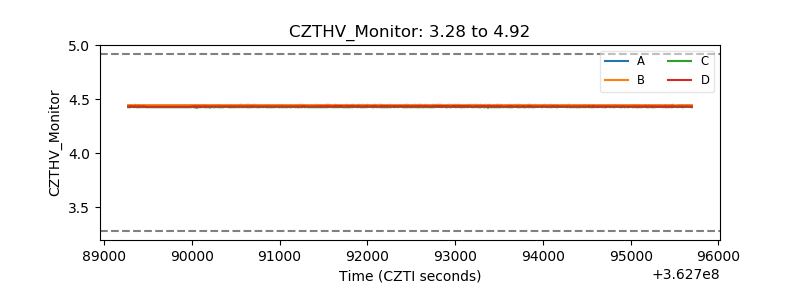 |
| D_VDD | 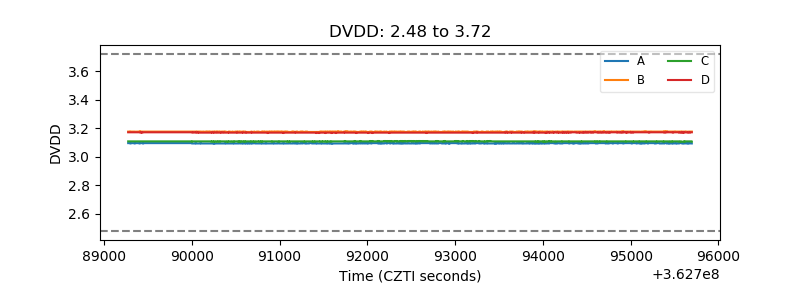 |
| Temperature 1 | 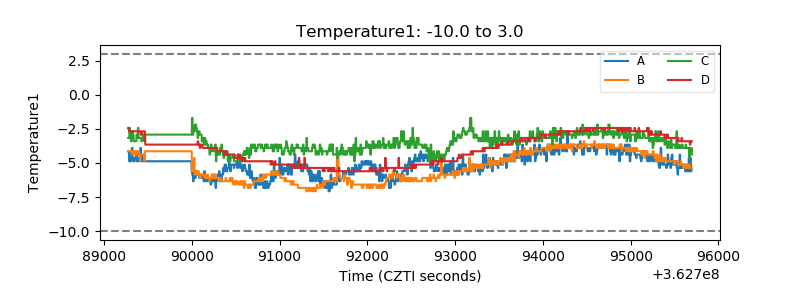 |
| Veto HV Monitor | 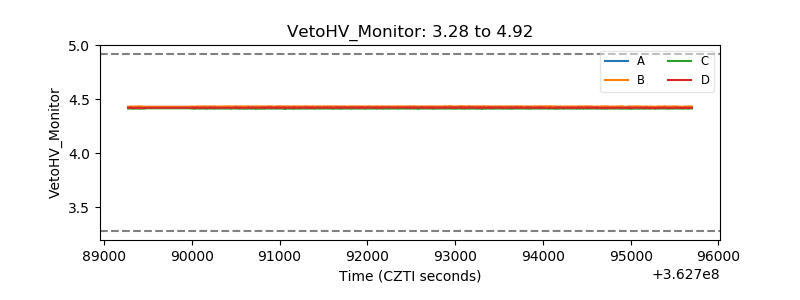 |
| Veto LLD | 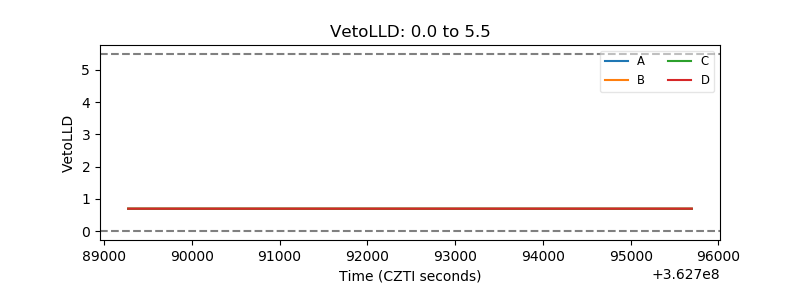 |
| Alpha Counter | 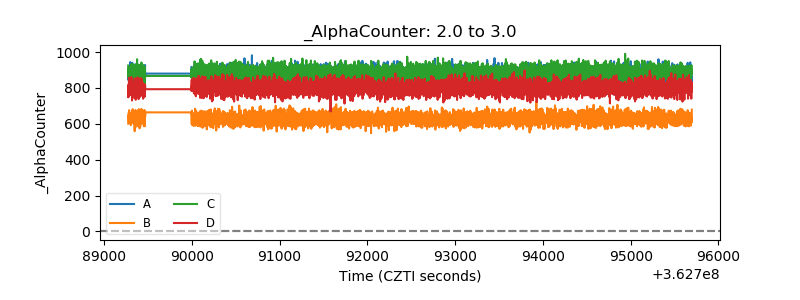 |
| _CPM_Rate | 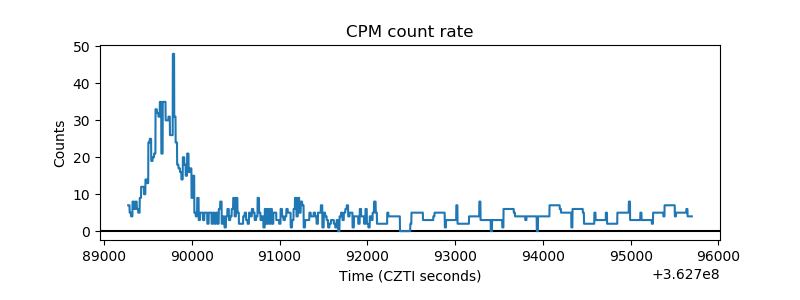 |
| CZT Counter | 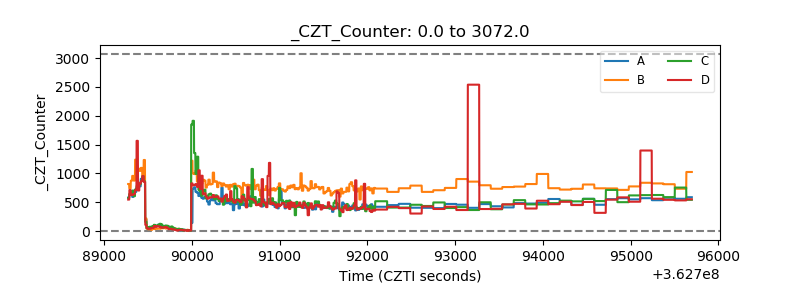 |
| +2.5 Volts monitor |  |
| +5 Volts monitor |  |
| _ROLL_ROT | 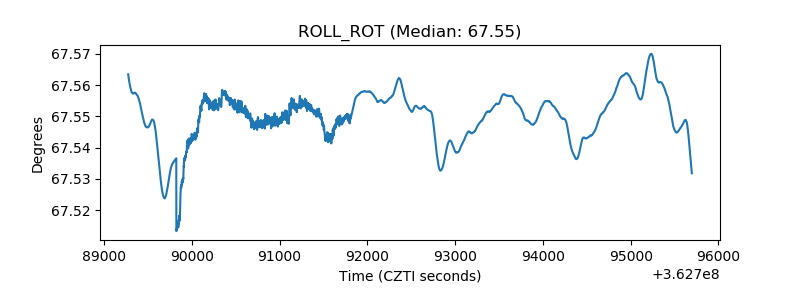 |
| _Roll_DEC | 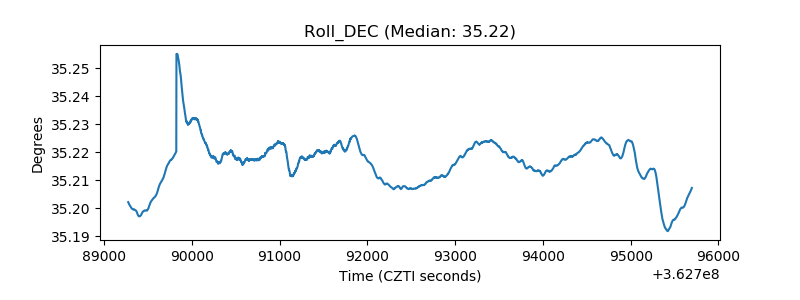 |
| _Roll_RA | 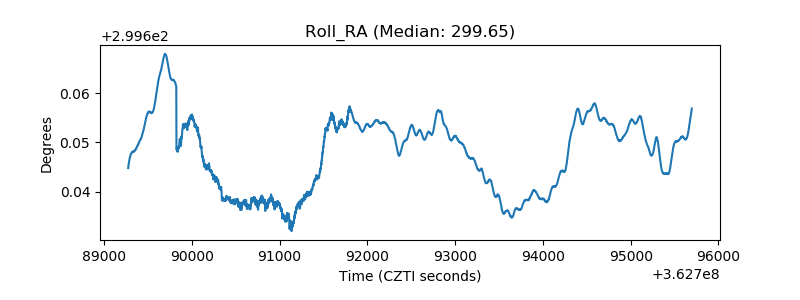 |
| Veto Counter | 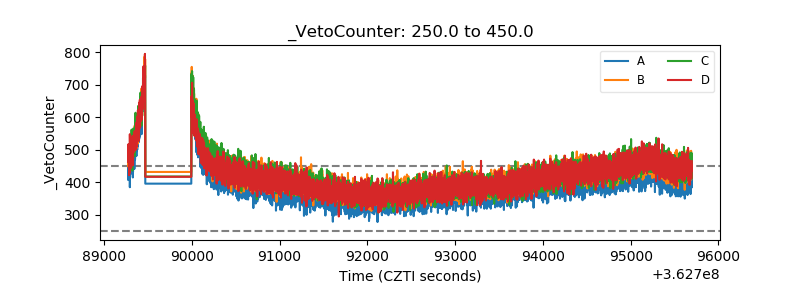 |