| Param | Original file | Final file |
|---|---|---|
| Filename | modeM0/AS1A10_109T01_9000004492_31293cztM0_level2.evt | modeM0/AS1A10_109T01_9000004492_31293cztM0_level2_quad_clean.evt |
| Size (bytes) | 221,587,200 | 36,371,520 |
| Size | 211.3 MB | 34.7 MB |
| Events in quadrant A | 1,392,101 | 243,156 |
| Events in quadrant B | 1,921,253 | 238,973 |
| Events in quadrant C | 1,790,632 | 216,535 |
| Events in quadrant D | 1,439,787 | 227,773 |
| Mode M0 | |||
|---|---|---|---|
| Quadrant | BADHDUFLAG | Total packets | Discarded packets |
| A | 0 | 8942 | 3317 |
| B | 0 | 12834 | 5666 |
| C | 0 | 10803 | 3814 |
| D | 0 | 10085 | 4333 |
| Mode SS | |||
|---|---|---|---|
| Quadrant | BADHDUFLAG | Total packets | Discarded packets |
| A | 0 | 82 | 33 |
| B | 0 | 83 | 41 |
| C | 0 | 86 | 40 |
| D | 0 | 86 | 34 |
| Mode M9 | |||
|---|---|---|---|
| Quadrant | BADHDUFLAG | Total packets | Discarded packets |
| A | 0 | 12 | 2 |
| B | 0 | 12 | 1 |
| C | 0 | 12 | 0 |
| D | 0 | 12 | 0 |
| Quadrant | Total seconds | Saturated seconds | Saturation percentage |
|---|---|---|---|
| A | 2517 | 36 | 1.430274% |
| B | 2319 | 90 | 3.880983% |
| C | 2461 | 176 | 7.151564% |
| D | 2441 | 38 | 1.556739% |
Noise dominated data is calculated using 1-second bins in cleaned event files. If a bin has >2000 counts, and if more than 50% of those come from <1% of pixels, then it is considered to be noise-dominated and hence unusable.
| Quadrant | # 1 sec bins | Bins with >0 counts | Bins with >2000 counts | High rate bins dominated by noise | Noise dominated (total time) | Noise dominated (detector-on time) | Marked lightcurve |
|---|---|---|---|---|---|---|---|
| A | 4831 | 2800 | 0 | 0 | 0.00% | 0.00% | 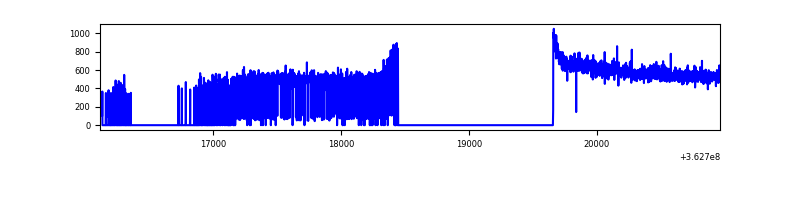 |
| B | 4761 | 2604 | 1 | 1 | 0.02% | 0.04% | 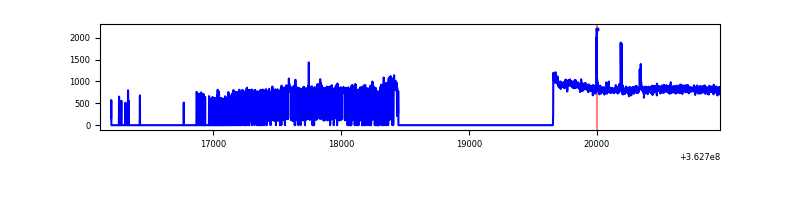 |
| C | 4816 | 2765 | 30 | 30 | 0.62% | 1.08% |  |
| D | 4849 | 2722 | 9 | 9 | 0.19% | 0.33% | 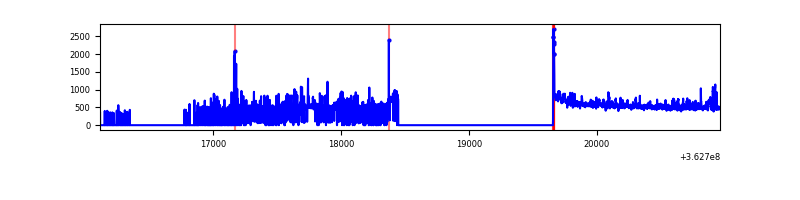 |
Top three noisy pixels from each quadrant. If the there are fewer than three noisy pixels in the level2.evt file, extra rows are filled as -1
| Pixel properties | Quadrant properties | ||||||
|---|---|---|---|---|---|---|---|
| Quadrant | DetID | PixID | Counts | Sigma | Mean | Median | Sigma |
| A | 13 | 254 | 4931 | 63.61 | 361 | 355 | 71.9 |
| A | 3 | 137 | 3296 | 40.88 | 361 | 355 | 71.9 |
| A | 0 | 226 | 3044 | 37.38 | 361 | 355 | 71.9 |
| B | 6 | 159 | 602145 | 9428.95 | 326 | 318 | 63.8 |
| B | 4 | 80 | 24711 | 382.17 | 326 | 318 | 63.8 |
| B | 0 | 230 | 11421 | 173.95 | 326 | 318 | 63.8 |
| C | 3 | 233 | 330414 | 4370.64 | 323 | 326 | 75.5 |
| C | 0 | 10 | 86316 | 1138.58 | 323 | 326 | 75.5 |
| C | 14 | 238 | 67560 | 890.23 | 323 | 326 | 75.5 |
| D | 8 | 195 | 125206 | 1533.09 | 332 | 324 | 81.5 |
| D | 12 | 233 | 31559 | 383.45 | 332 | 324 | 81.5 |
| D | 3 | 14 | 18480 | 222.89 | 332 | 324 | 81.5 |
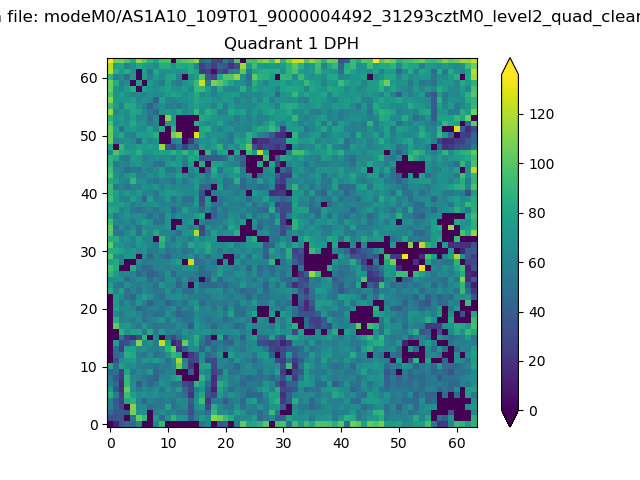
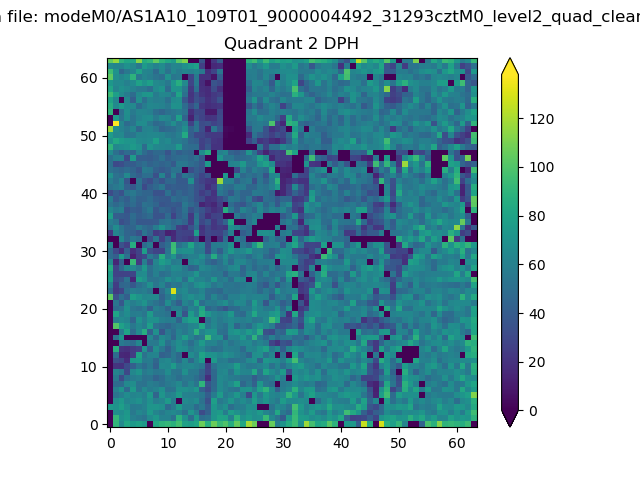
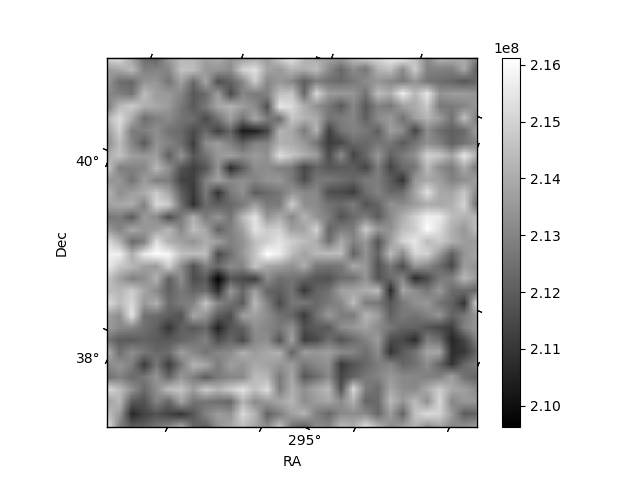
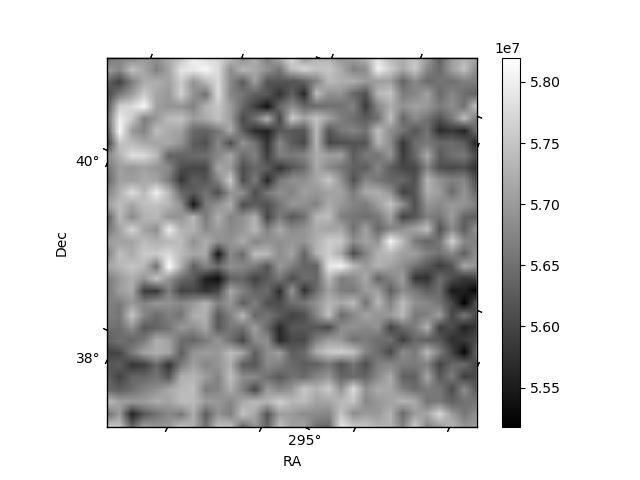
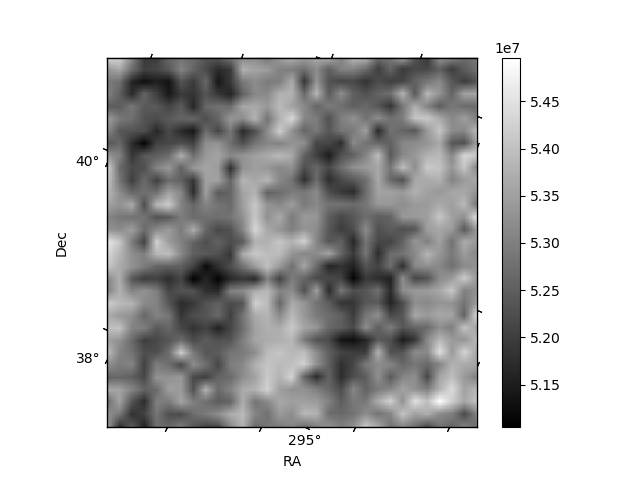
Histogram calculated using DETX and DETY for each event in the final _common_clean file
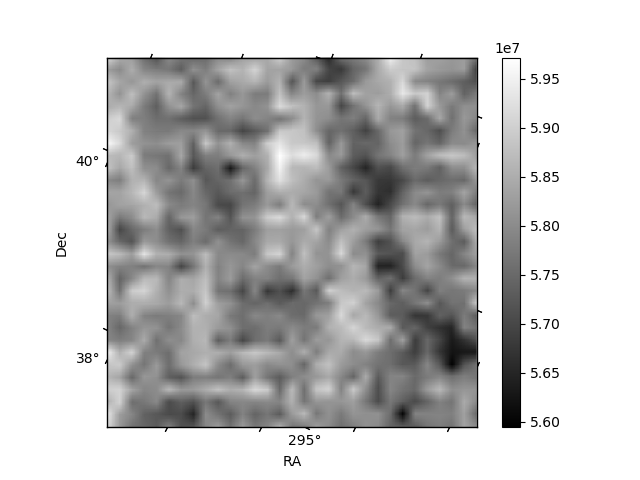
| Quadrant A | 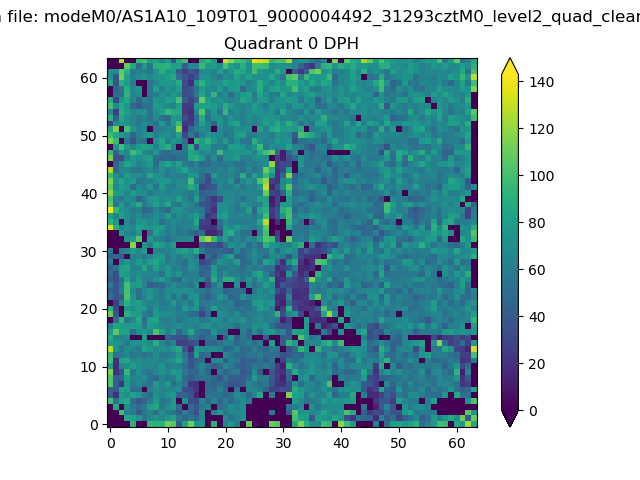 |
 |
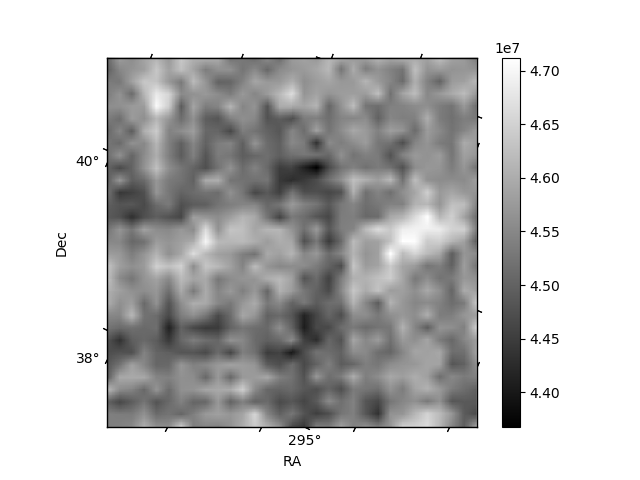
Quadrant B |
|---|---|---|---|
| Quadrant D | 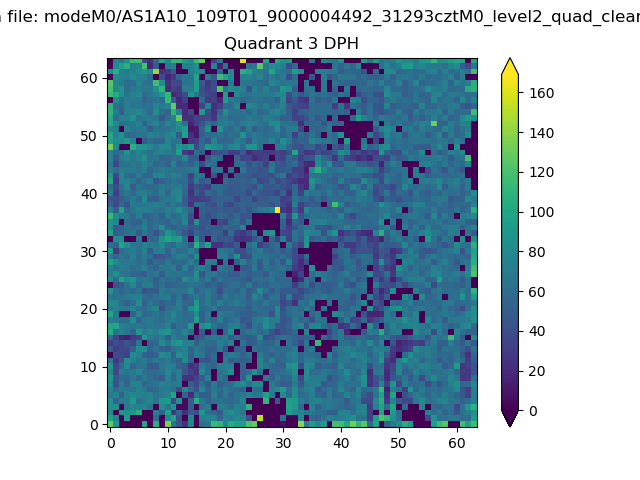 |
 |
Quadrant C |
| Plot type | Count rate plots | Images |
|---|---|---|
| Comparison with Poisson distribution Blue bars denote a histogram of data divided into 1 sec bins. Red curve is a Poisson curve with rate = median count rate of data. |
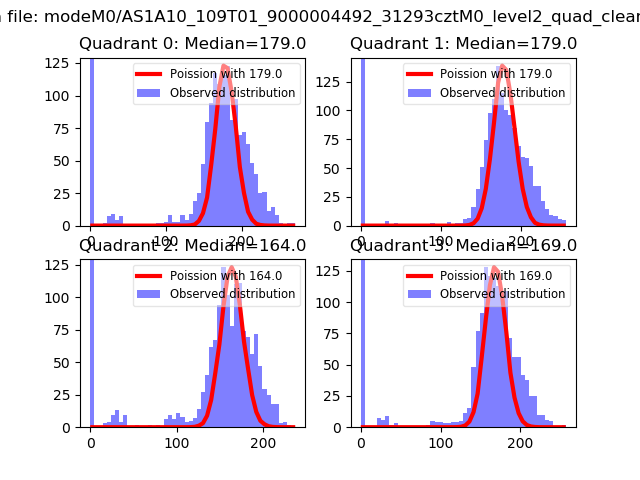 |
 |
| Quadrant-wise count rates Data is divided into 100 sec bins |
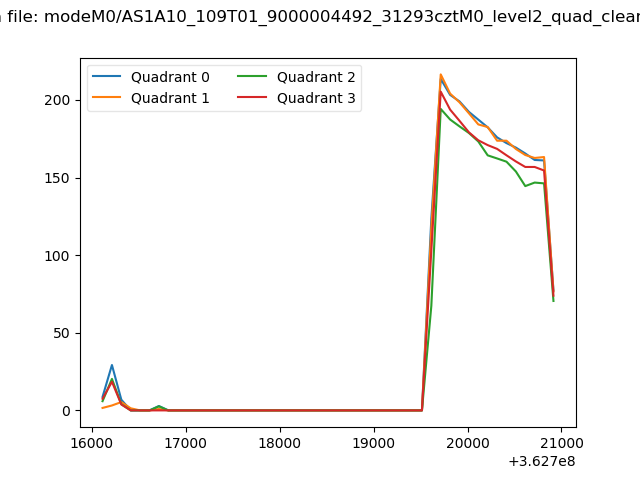 |
|
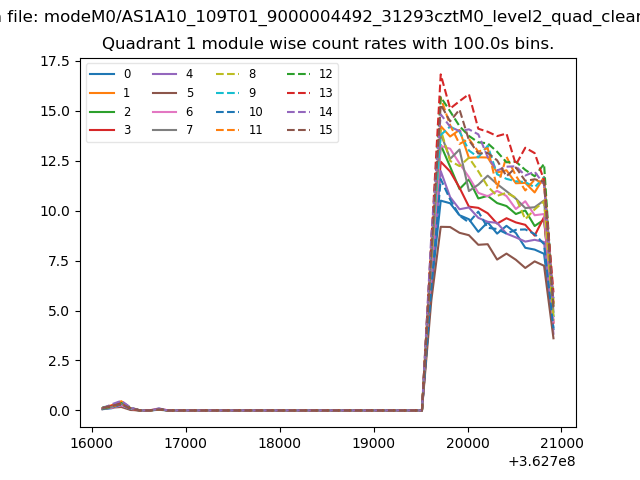
| Module-wise count rates for Quadrant A Data is divided into 100 sec bins |
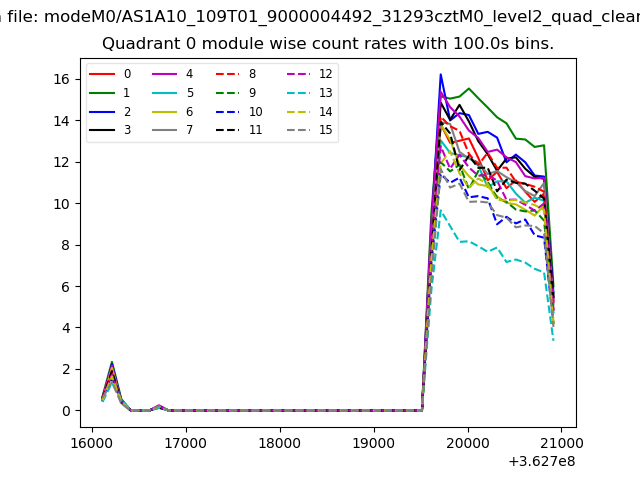 |
 |
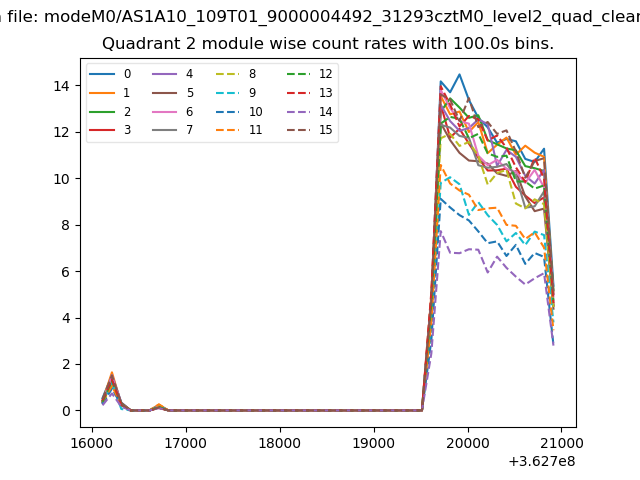
| Module-wise count rates for Quadrant B Data is divided into 100 sec bins |
 |
 |
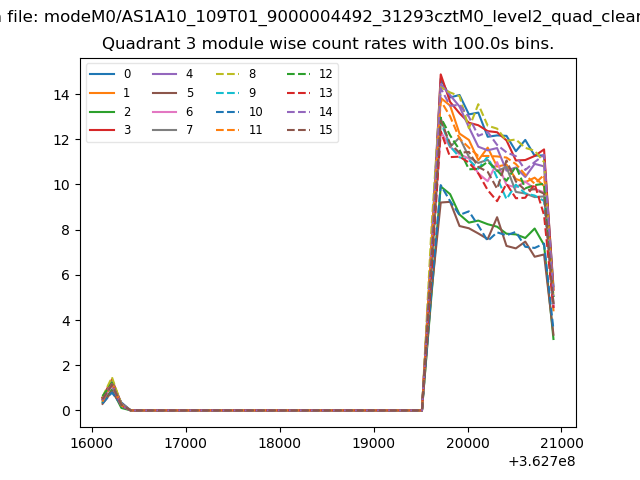
| Module-wise count rates for Quadrant C Data is divided into 100 sec bins |
 |
 |
| Module-wise count rates for Quadrant D Data is divided into 100 sec bins |
 |
 |
| Parameter | Plot |
|---|---|
| CZT HV Monitor | 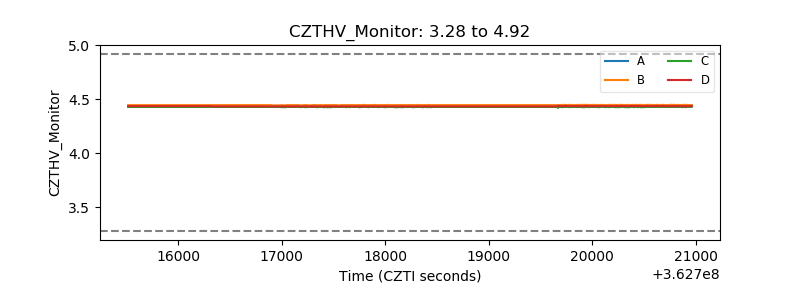 |
| D_VDD | 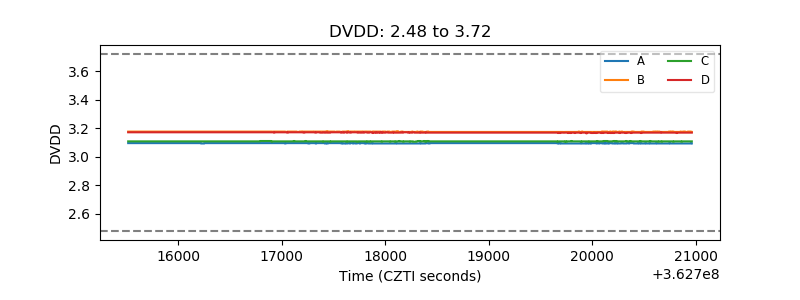 |
| Temperature 1 | 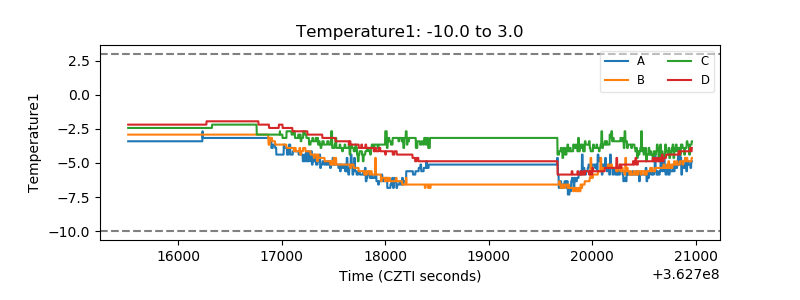 |
| Veto HV Monitor | 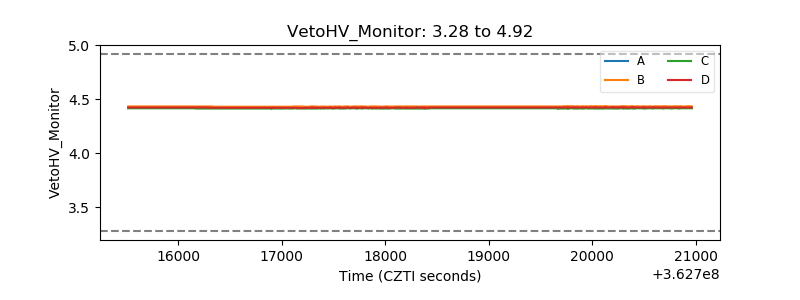 |
| Veto LLD | 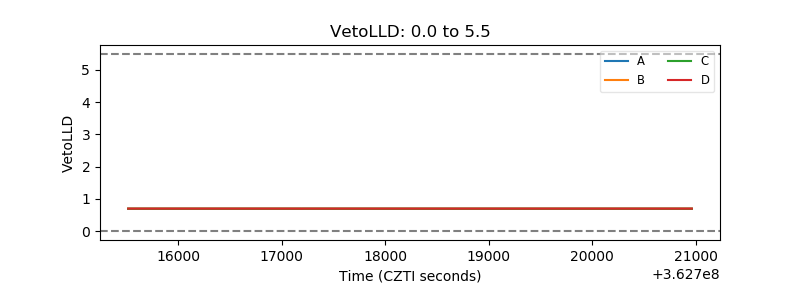 |
| Alpha Counter | 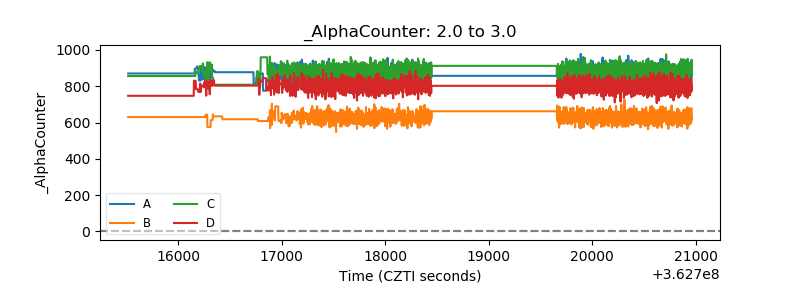 |
| _CPM_Rate | 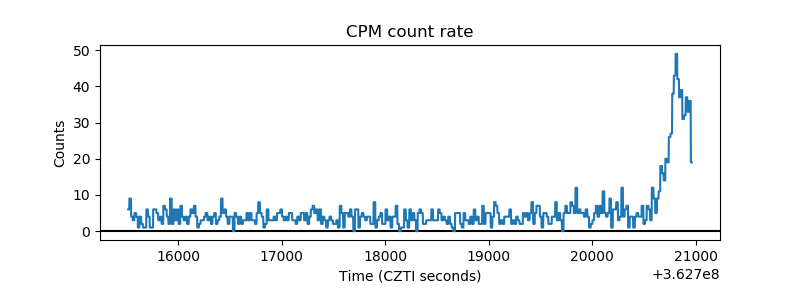 |
| CZT Counter | 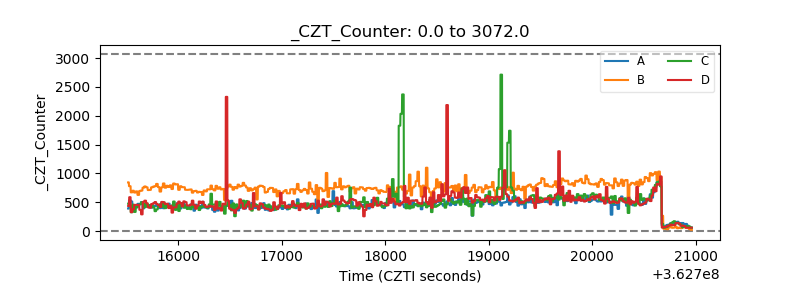 |
| +2.5 Volts monitor |  |
| +5 Volts monitor |  |
| _ROLL_ROT | 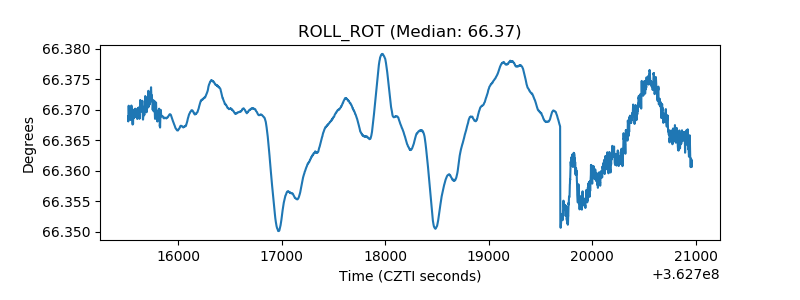 |
| _Roll_DEC | 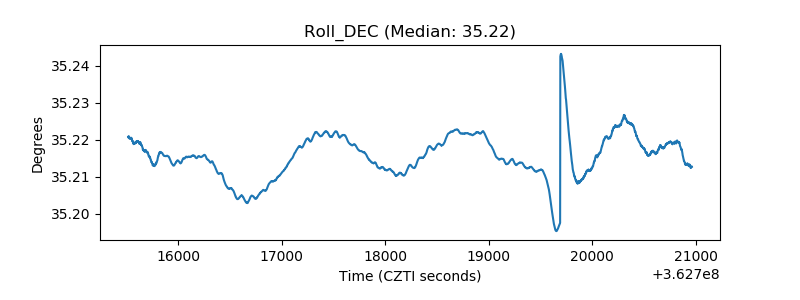 |
| _Roll_RA | 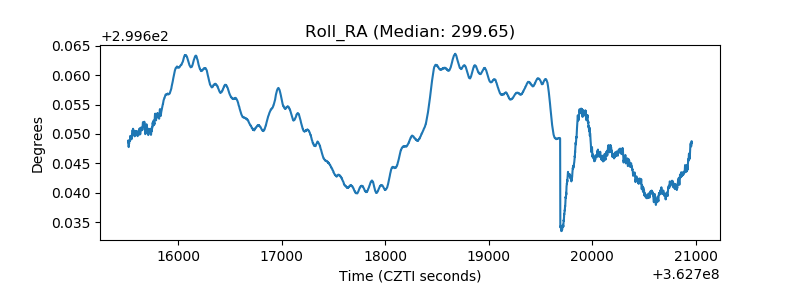 |
| Veto Counter | 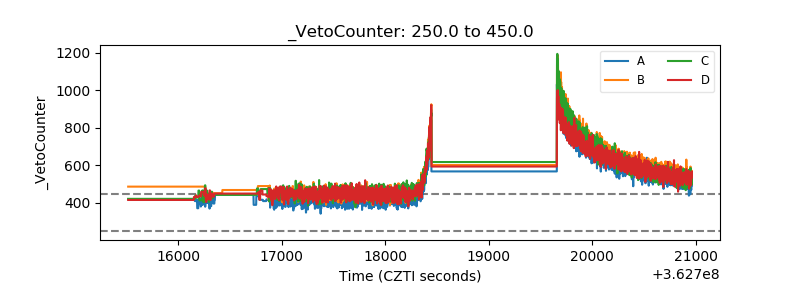 |