| Param | Original file | Final file |
|---|---|---|
| Filename | modeM0/AS1A10_071T64_9000004496cztM0_level2.fits | modeM0/AS1A10_071T64_9000004496cztM0_level2_quad_clean.evt |
| Size (bytes) | 226,964,160 | 85,469,760 |
| Size | 216.4 MB | 81.5 MB |
| Events in quadrant A | 1,463,548 | 300,506 |
| Events in quadrant B | 1,350,360 | 294,623 |
| Events in quadrant C | 1,385,818 | 284,025 |
| Events in quadrant D | 1,225,206 | 257,816 |
| Mode M9 | |||
|---|---|---|---|
| Quadrant | BADHDUFLAG | Total packets | Discarded packets |
| A | 0 | 51 | 0 |
| B | 0 | 51 | 0 |
| C | 0 | 51 | 0 |
| D | 0 | 51 | 0 |
| Mode SS | |||
|---|---|---|---|
| Quadrant | BADHDUFLAG | Total packets | Discarded packets |
| A | 0 | 428 | 0 |
| B | 0 | 428 | 0 |
| C | 0 | 428 | 0 |
| D | 0 | 428 | 0 |
| Mode M0 | |||
|---|---|---|---|
| Quadrant | BADHDUFLAG | Total packets | Discarded packets |
| A | 0 | 45273 | 0 |
| B | 0 | 66498 | 0 |
| C | 0 | 48066 | 0 |
| D | 0 | 59733 | 0 |
| Quadrant | Total seconds | Saturated seconds | Saturation percentage |
|---|---|---|---|
| A | 21045 | 288 | 1.368496% |
| B | 21045 | 617 | 2.931813% |
| C | 21045 | 720 | 3.421240% |
| D | 21045 | 596 | 2.832027% |
Noise dominated data is calculated using 1-second bins in cleaned event files. If a bin has >2000 counts, and if more than 50% of those come from <1% of pixels, then it is considered to be noise-dominated and hence unusable.
| Quadrant | # 1 sec bins | Bins with >0 counts | Bins with >2000 counts | High rate bins dominated by noise | Noise dominated (total time) | Noise dominated (detector-on time) | Marked lightcurve |
|---|---|---|---|---|---|---|---|
| A | 26100 | 21045 | 0 | 0 | 0.00% | 0.00% |  |
| B | 26100 | 21045 | 0 | 0 | 0.00% | 0.00% |  |
| C | 26100 | 21045 | 0 | 0 | 0.00% | 0.00% |  |
| D | 26100 | 21045 | 0 | 0 | 0.00% | 0.00% |  |
Top three noisy pixels from each quadrant. If the there are fewer than three noisy pixels in the level2.evt file, extra rows are filled as -1
| Pixel properties | Quadrant properties | ||||||
|---|---|---|---|---|---|---|---|
| Quadrant | DetID | PixID | Counts | Sigma | Mean | Median | Sigma |
| A | 0 | 29 | 1431 | 11.43 | 381 | 361 | 93.6 |
| A | 7 | 110 | 1194 | 8.9 | 381 | 361 | 93.6 |
| A | 9 | 19 | 1098 | 7.87 | 381 | 361 | 93.6 |
| B | 2 | 9 | 1040 | 9.68 | 358 | 344 | 71.9 |
| B | 5 | 128 | 961 | 8.58 | 358 | 344 | 71.9 |
| B | 3 | 80 | 920 | 8.01 | 358 | 344 | 71.9 |
| C | 3 | 202 | 1097 | 7.89 | 367 | 346 | 95.1 |
| C | 3 | 203 | 1003 | 6.91 | 367 | 346 | 95.1 |
| C | 3 | 126 | 926 | 6.1 | 367 | 346 | 95.1 |
| D | 15 | 46 | 937 | 6.61 | 350 | 322 | 93.1 |
| D | 10 | 189 | 925 | 6.48 | 350 | 322 | 93.1 |
| D | 6 | 231 | 853 | 5.71 | 350 | 322 | 93.1 |
Histogram calculated using DETX and DETY for each event in the final _common_clean file
| Quadrant A | 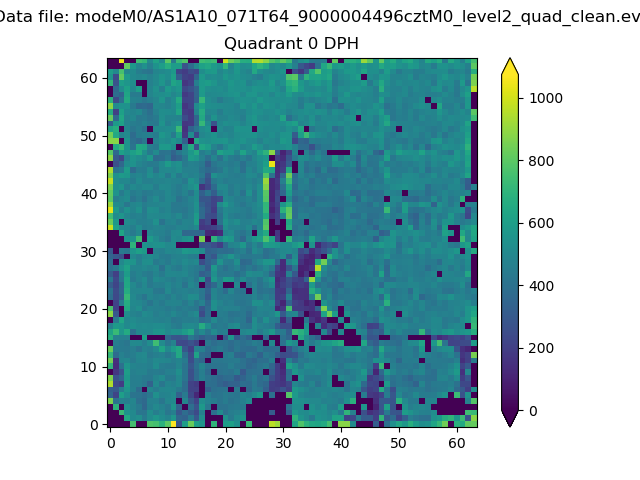 |
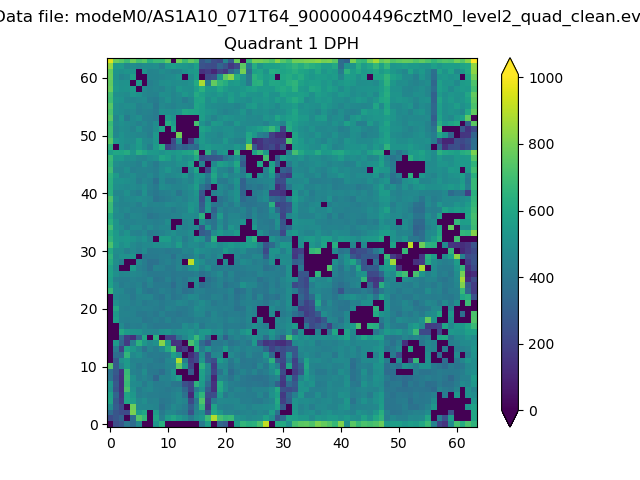 |
Quadrant B |
|---|---|---|---|
| Quadrant D | 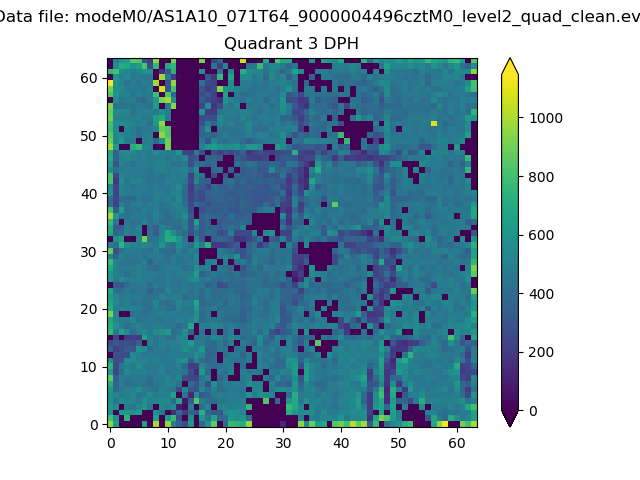 |
 |
Quadrant C |
| Plot type | Count rate plots | Images |
|---|---|---|
| Comparison with Poisson distribution Blue bars denote a histogram of data divided into 1 sec bins. Red curve is a Poisson curve with rate = median count rate of data. |
 |
 |
| Quadrant-wise count rates Data is divided into 100 sec bins |
 |
|
| Module-wise count rates for Quadrant A Data is divided into 100 sec bins |
 |
 |
| Module-wise count rates for Quadrant B Data is divided into 100 sec bins |
 |
 |
| Module-wise count rates for Quadrant C Data is divided into 100 sec bins |
 |
 |
| Module-wise count rates for Quadrant D Data is divided into 100 sec bins |
 |
 |
| Parameter | Plot |
|---|---|
| CZT HV Monitor |  |
| D_VDD | 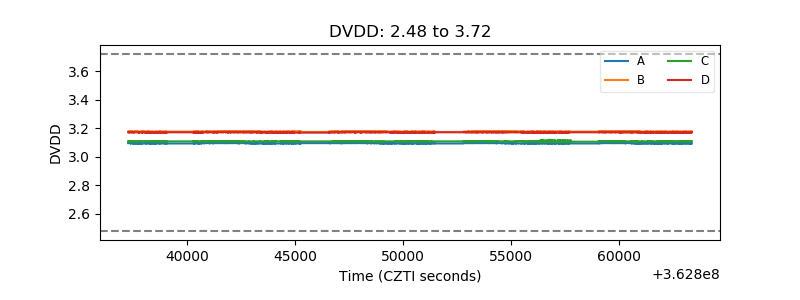 |
| Temperature 1 |  |
| Veto HV Monitor |  |
| Veto LLD |  |
| Alpha Counter |  |
| _CPM_Rate |  |
| CZT Counter |  |
| +2.5 Volts monitor |  |
| +5 Volts monitor |  |
| _ROLL_ROT |  |
| _Roll_DEC |  |
| _Roll_RA |  |
| Veto Counter |  |