| Param | Original file | Final file |
|---|---|---|
| Filename | modeM0/AS1A10_071T64_9000004496_31134cztM0_level2.evt | modeM0/AS1A10_071T64_9000004496_31134cztM0_level2_quad_clean.evt |
| Size (bytes) | 313,464,960 | 50,025,600 |
| Size | 298.9 MB | 47.7 MB |
| Events in quadrant A | 1,830,743 | 333,176 |
| Events in quadrant B | 2,866,823 | 327,477 |
| Events in quadrant C | 1,951,422 | 310,108 |
| Events in quadrant D | 2,617,490 | 307,492 |
| Mode M9 | |||
|---|---|---|---|
| Quadrant | BADHDUFLAG | Total packets | Discarded packets |
| A | 0 | 12 | 0 |
| B | 0 | 12 | 0 |
| C | 0 | 12 | 0 |
| D | 0 | 12 | 0 |
| Mode SS | |||
|---|---|---|---|
| Quadrant | BADHDUFLAG | Total packets | Discarded packets |
| A | 0 | 68 | 0 |
| B | 0 | 68 | 0 |
| C | 0 | 68 | 0 |
| D | 0 | 68 | 0 |
| Mode M0 | |||
|---|---|---|---|
| Quadrant | BADHDUFLAG | Total packets | Discarded packets |
| A | 0 | 7560 | 2 |
| B | 0 | 10709 | 1 |
| C | 0 | 7931 | 1 |
| D | 0 | 10289 | 1 |
| Quadrant | Total seconds | Saturated seconds | Saturation percentage |
|---|---|---|---|
| A | 3331 | 67 | 2.011408% |
| B | 3331 | 142 | 4.262984% |
| C | 3331 | 138 | 4.142900% |
| D | 3331 | 66 | 1.981387% |
Noise dominated data is calculated using 1-second bins in cleaned event files. If a bin has >2000 counts, and if more than 50% of those come from <1% of pixels, then it is considered to be noise-dominated and hence unusable.
| Quadrant | # 1 sec bins | Bins with >0 counts | Bins with >2000 counts | High rate bins dominated by noise | Noise dominated (total time) | Noise dominated (detector-on time) | Marked lightcurve |
|---|---|---|---|---|---|---|---|
| A | 4531 | 3332 | 0 | 0 | 0.00% | 0.00% | 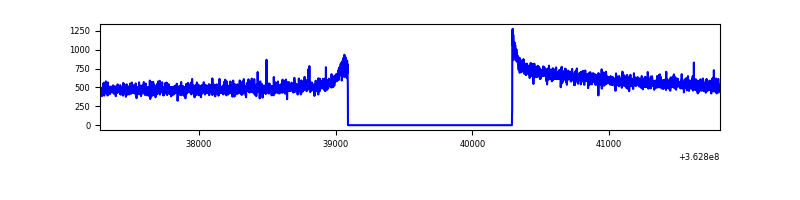 |
| B | 4531 | 3332 | 15 | 15 | 0.33% | 0.45% | 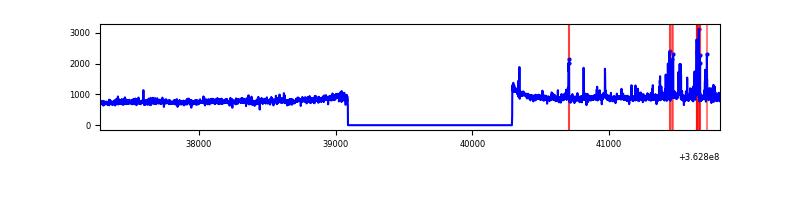 |
| C | 4531 | 3332 | 15 | 15 | 0.33% | 0.45% | 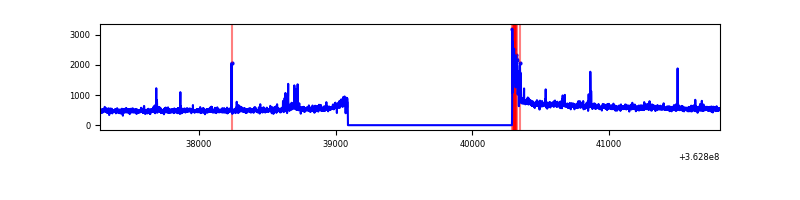 |
| D | 4531 | 3332 | 12 | 12 | 0.26% | 0.36% | 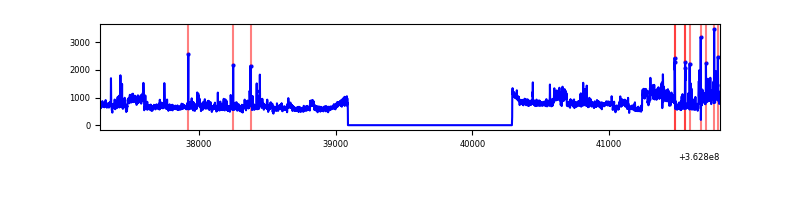 |
Top three noisy pixels from each quadrant. If the there are fewer than three noisy pixels in the level2.evt file, extra rows are filled as -1
| Pixel properties | Quadrant properties | ||||||
|---|---|---|---|---|---|---|---|
| Quadrant | DetID | PixID | Counts | Sigma | Mean | Median | Sigma |
| A | 13 | 254 | 7276 | 72.06 | 473 | 466 | 94.5 |
| A | 3 | 137 | 4333 | 40.92 | 473 | 466 | 94.5 |
| A | 0 | 226 | 4118 | 38.64 | 473 | 466 | 94.5 |
| B | 6 | 159 | 881900 | 9868.49 | 461 | 451 | 89.3 |
| B | 0 | 190 | 77476 | 862.35 | 461 | 451 | 89.3 |
| B | 5 | 172 | 40244 | 445.51 | 461 | 451 | 89.3 |
| C | 0 | 10 | 120634 | 1152.47 | 443 | 446 | 104.3 |
| C | 14 | 238 | 72323 | 689.22 | 443 | 446 | 104.3 |
| C | 4 | 175 | 9911 | 90.76 | 443 | 446 | 104.3 |
| D | 8 | 195 | 740197 | 6782.09 | 456 | 445 | 109.1 |
| D | 12 | 218 | 46426 | 421.56 | 456 | 445 | 109.1 |
| D | 2 | 250 | 35424 | 320.69 | 456 | 445 | 109.1 |
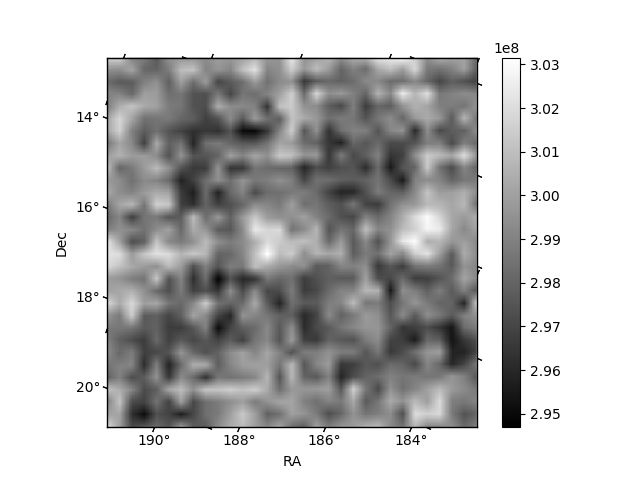
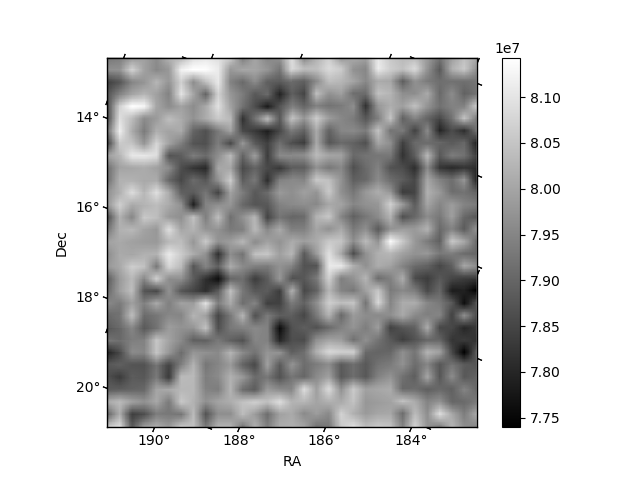
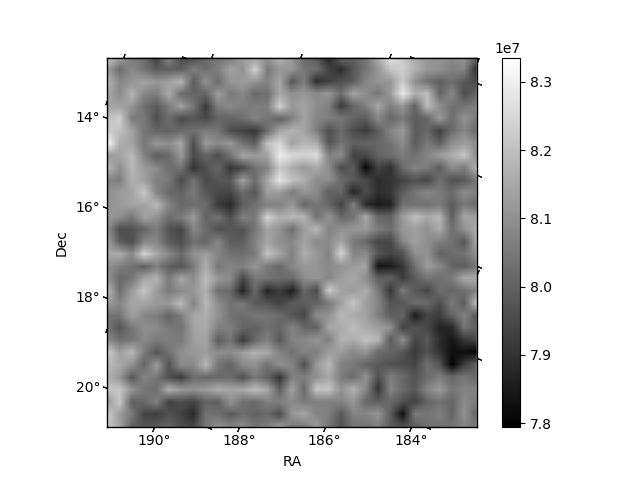
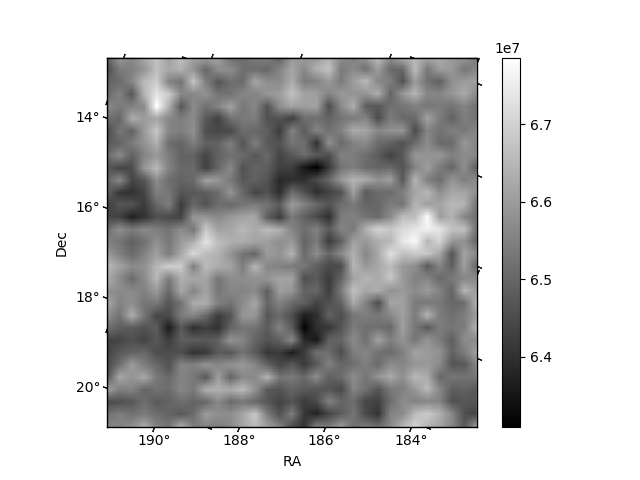
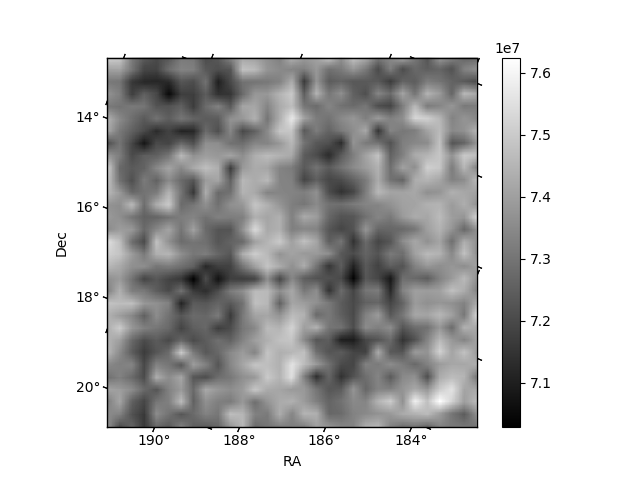
Histogram calculated using DETX and DETY for each event in the final _common_clean file
| Quadrant A | 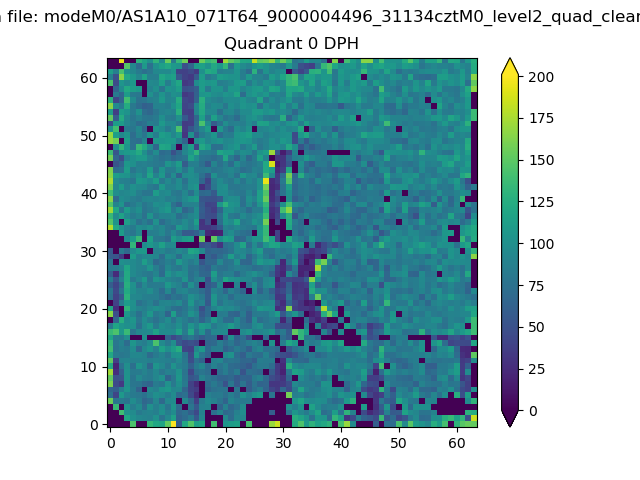 |
 |
Quadrant B |
|---|---|---|---|
| Quadrant D | 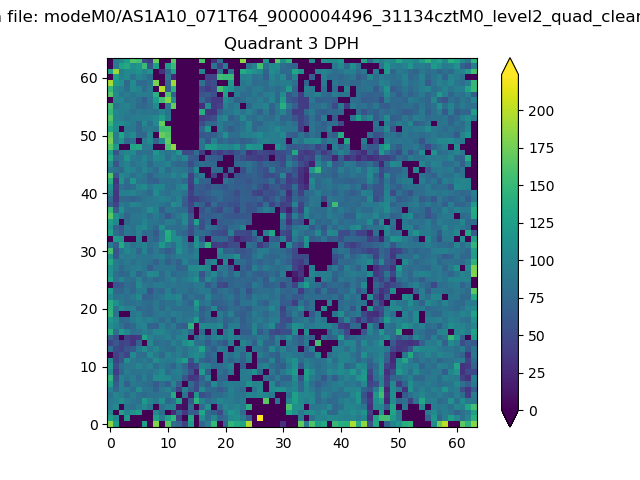 |
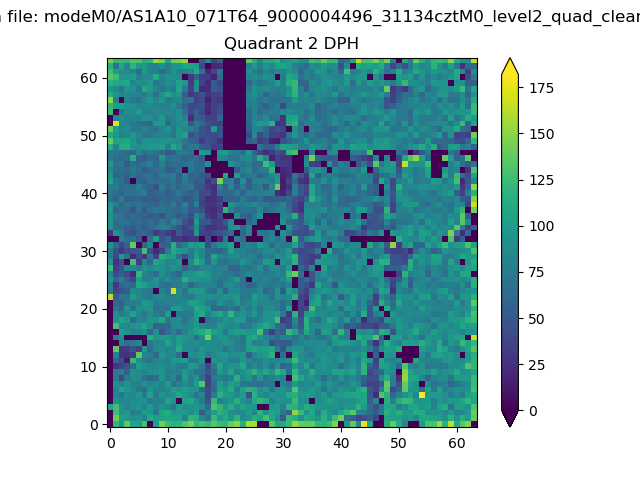 |
Quadrant C |
| Plot type | Count rate plots | Images |
|---|---|---|
| Comparison with Poisson distribution Blue bars denote a histogram of data divided into 1 sec bins. Red curve is a Poisson curve with rate = median count rate of data. |
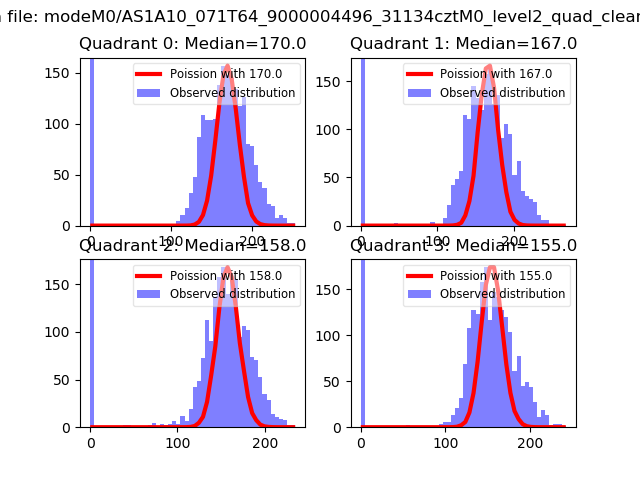 |
 |
| Quadrant-wise count rates Data is divided into 100 sec bins |
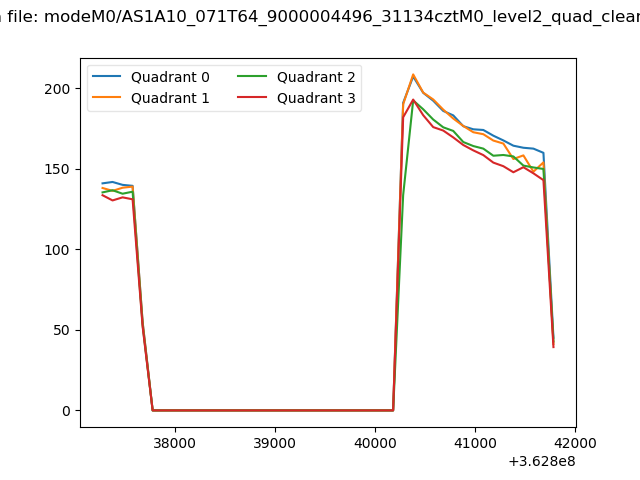 |
|
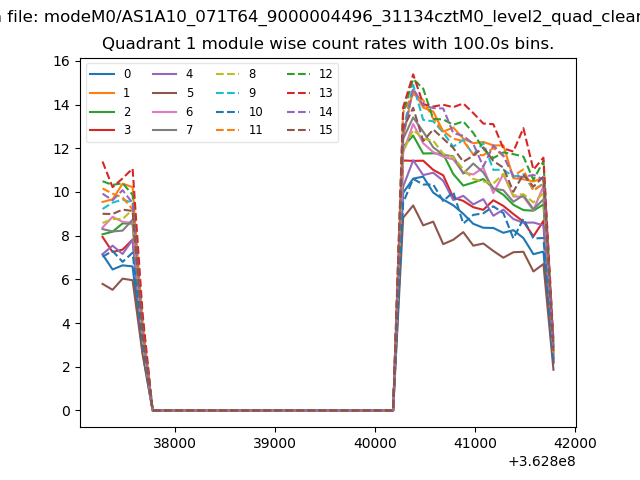
| Module-wise count rates for Quadrant A Data is divided into 100 sec bins |
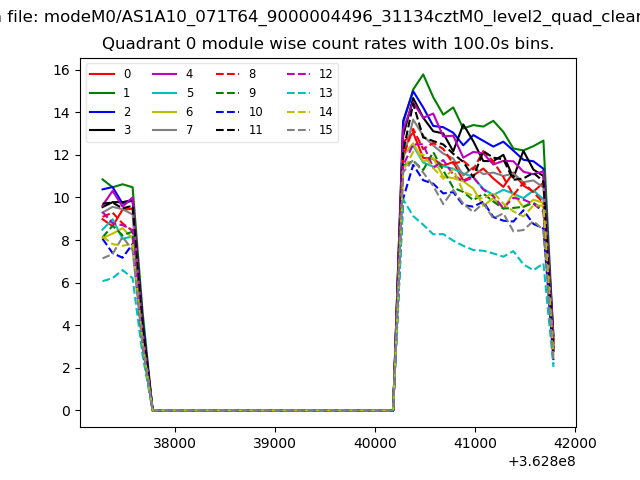 |
 |
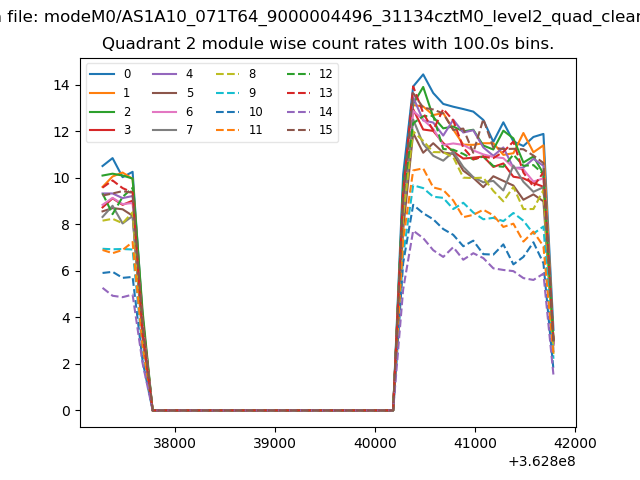
| Module-wise count rates for Quadrant B Data is divided into 100 sec bins |
 |
 |
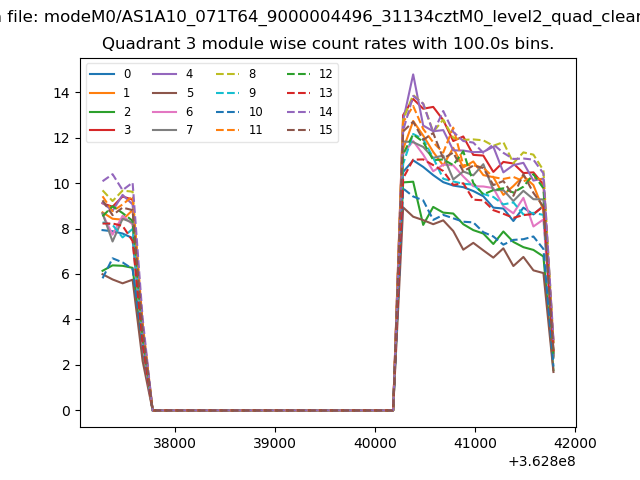
| Module-wise count rates for Quadrant C Data is divided into 100 sec bins |
 |
 |
| Module-wise count rates for Quadrant D Data is divided into 100 sec bins |
 |
 |
| Parameter | Plot |
|---|---|
| CZT HV Monitor | 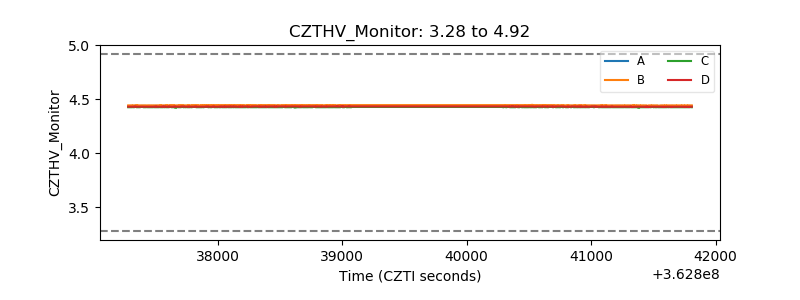 |
| D_VDD | 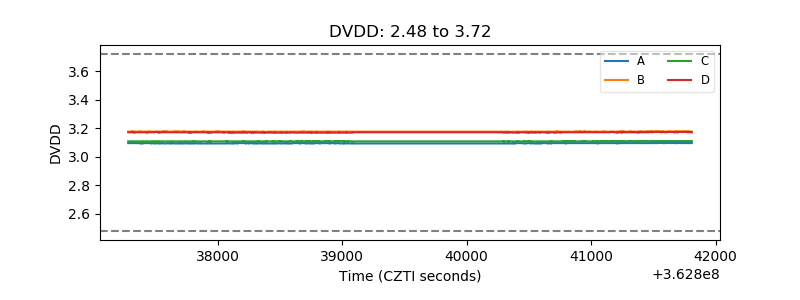 |
| Temperature 1 | 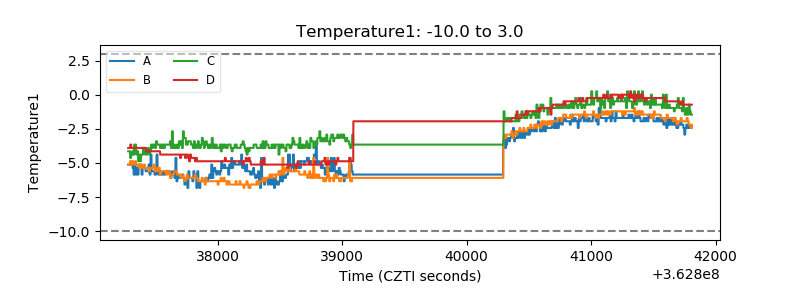 |
| Veto HV Monitor | 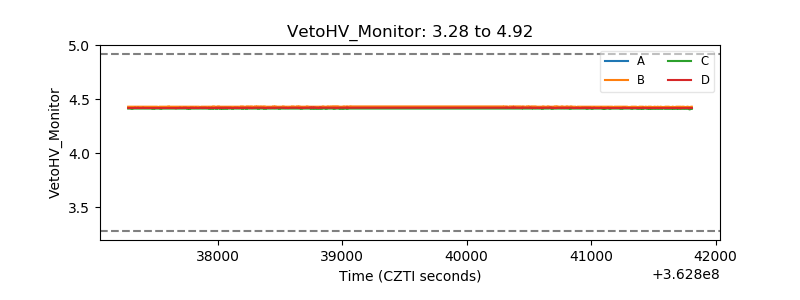 |
| Veto LLD | 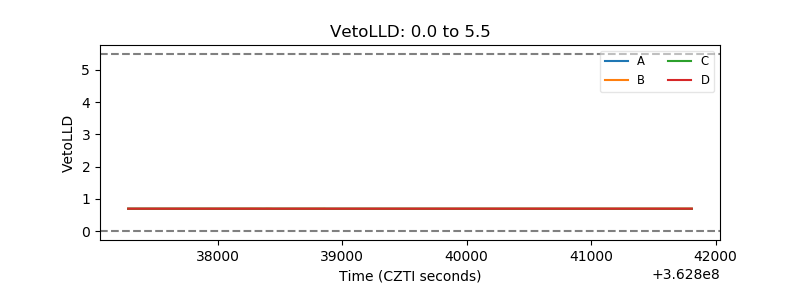 |
| Alpha Counter | 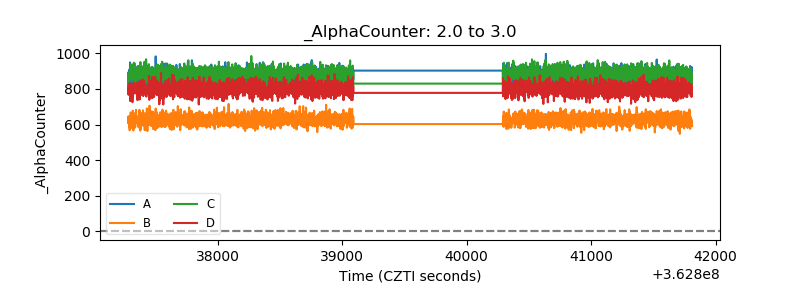 |
| _CPM_Rate | 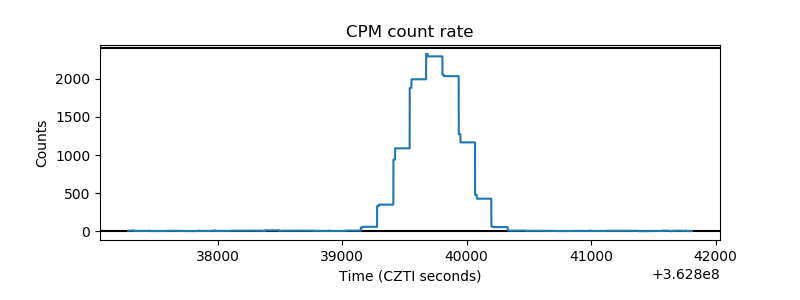 |
| CZT Counter | 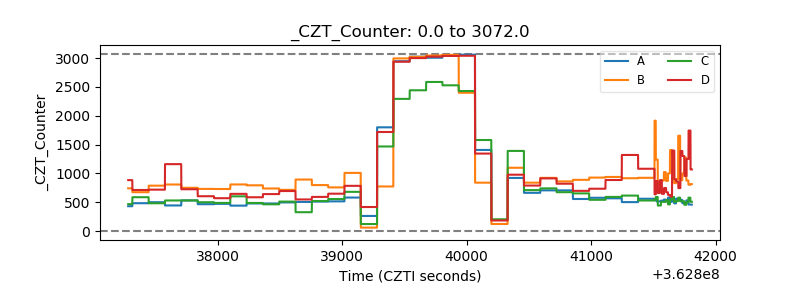 |
| +2.5 Volts monitor |  |
| +5 Volts monitor |  |
| _ROLL_ROT | 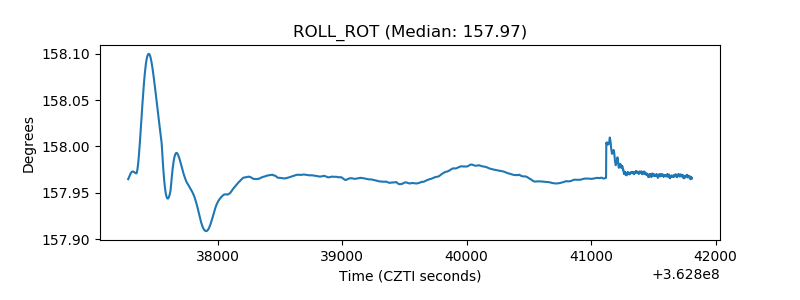 |
| _Roll_DEC | 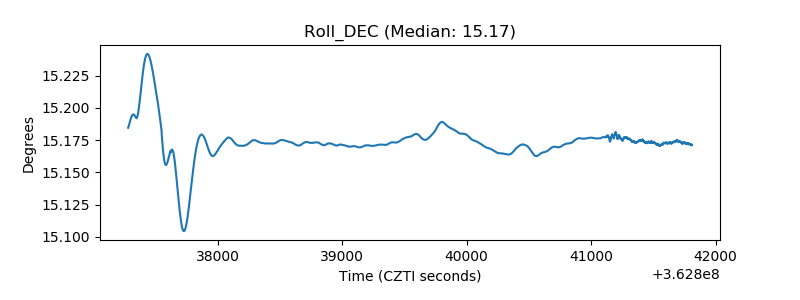 |
| _Roll_RA | 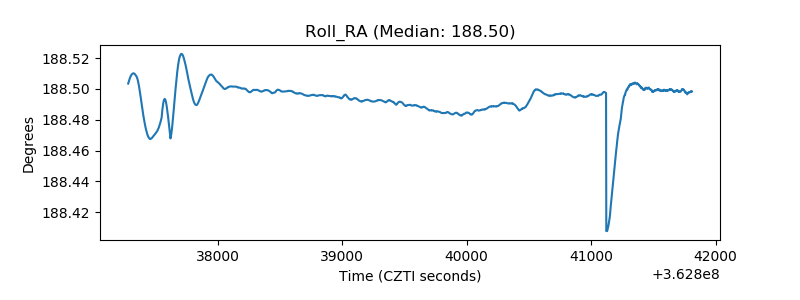 |
| Veto Counter | 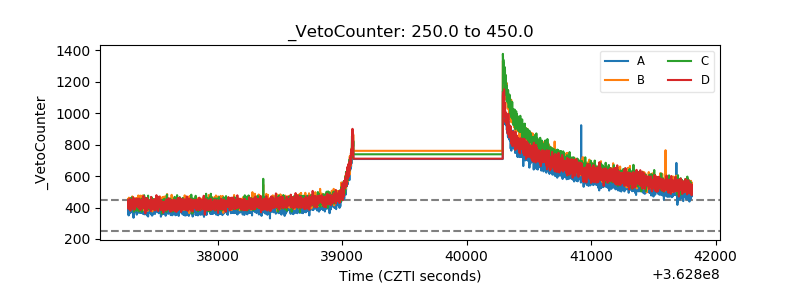 |