| Param | Original file | Final file |
|---|---|---|
| Filename | modeM0/AS1A10_071T64_9000004496_31137cztM0_level2.evt | modeM0/AS1A10_071T64_9000004496_31137cztM0_level2_quad_clean.evt |
| Size (bytes) | 563,924,160 | 95,074,560 |
| Size | 537.8 MB | 90.7 MB |
| Events in quadrant A | 3,267,958 | 631,186 |
| Events in quadrant B | 5,344,437 | 629,950 |
| Events in quadrant C | 3,485,921 | 599,530 |
| Events in quadrant D | 4,554,231 | 578,997 |
| Mode M9 | |||
|---|---|---|---|
| Quadrant | BADHDUFLAG | Total packets | Discarded packets |
| A | 0 | 19 | 0 |
| B | 0 | 20 | 0 |
| C | 0 | 20 | 0 |
| D | 0 | 20 | 0 |
| Mode SS | |||
|---|---|---|---|
| Quadrant | BADHDUFLAG | Total packets | Discarded packets |
| A | 0 | 128 | 0 |
| B | 0 | 128 | 0 |
| C | 0 | 128 | 0 |
| D | 0 | 128 | 0 |
| Mode M0 | |||
|---|---|---|---|
| Quadrant | BADHDUFLAG | Total packets | Discarded packets |
| A | 0 | 13583 | 2 |
| B | 0 | 20046 | 2 |
| C | 0 | 14194 | 2 |
| D | 0 | 17658 | 3 |
| Quadrant | Total seconds | Saturated seconds | Saturation percentage |
|---|---|---|---|
| A | 6295 | 71 | 1.127879% |
| B | 6295 | 173 | 2.748213% |
| C | 6295 | 194 | 3.081811% |
| D | 6294 | 176 | 2.796314% |
Noise dominated data is calculated using 1-second bins in cleaned event files. If a bin has >2000 counts, and if more than 50% of those come from <1% of pixels, then it is considered to be noise-dominated and hence unusable.
| Quadrant | # 1 sec bins | Bins with >0 counts | Bins with >2000 counts | High rate bins dominated by noise | Noise dominated (total time) | Noise dominated (detector-on time) | Marked lightcurve |
|---|---|---|---|---|---|---|---|
| A | 7565 | 6296 | 0 | 0 | 0.00% | 0.00% | 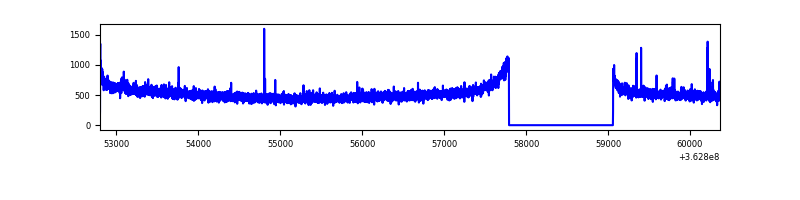 |
| B | 7565 | 6296 | 9 | 9 | 0.12% | 0.14% | 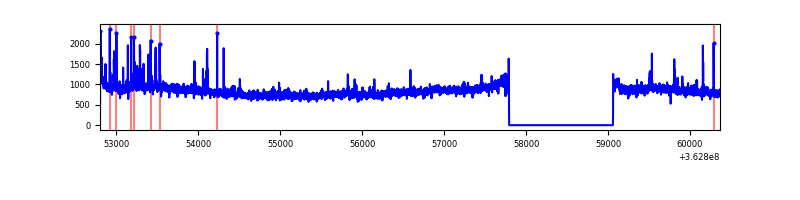 |
| C | 7565 | 6296 | 30 | 30 | 0.40% | 0.48% | 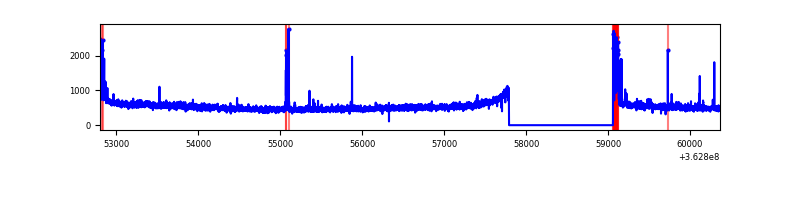 |
| D | 7564 | 6295 | 96 | 96 | 1.27% | 1.53% | 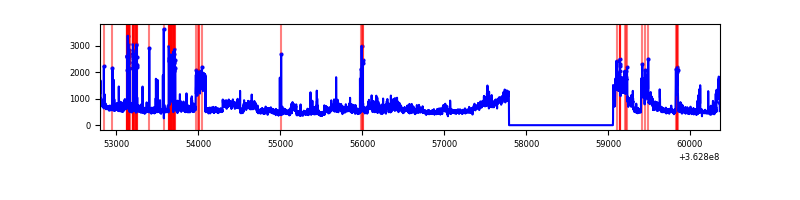 |
Top three noisy pixels from each quadrant. If the there are fewer than three noisy pixels in the level2.evt file, extra rows are filled as -1
| Pixel properties | Quadrant properties | ||||||
|---|---|---|---|---|---|---|---|
| Quadrant | DetID | PixID | Counts | Sigma | Mean | Median | Sigma |
| A | 12 | 96 | 17593 | 99.33 | 842 | 826 | 168.8 |
| A | 13 | 254 | 11843 | 65.27 | 842 | 826 | 168.8 |
| A | 3 | 137 | 7663 | 40.5 | 842 | 826 | 168.8 |
| B | 6 | 159 | 1894952 | 12009.52 | 833 | 814 | 157.7 |
| B | 0 | 190 | 52219 | 325.93 | 833 | 814 | 157.7 |
| B | 0 | 230 | 34830 | 215.67 | 833 | 814 | 157.7 |
| C | 0 | 10 | 174596 | 926.43 | 798 | 806 | 187.6 |
| C | 14 | 238 | 130803 | 692.98 | 798 | 806 | 187.6 |
| C | 4 | 175 | 37410 | 195.13 | 798 | 806 | 187.6 |
| D | 8 | 195 | 1339285 | 6915.77 | 806 | 787 | 193.5 |
| D | 2 | 120 | 46218 | 234.73 | 806 | 787 | 193.5 |
| D | 13 | 249 | 33653 | 169.81 | 806 | 787 | 193.5 |
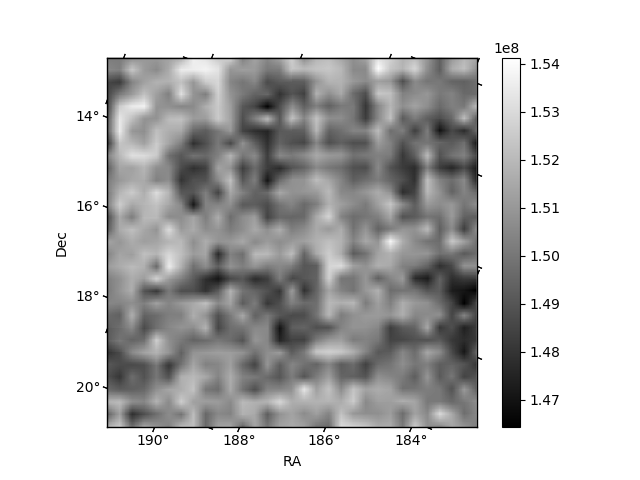
Histogram calculated using DETX and DETY for each event in the final _common_clean file
| Quadrant A |  |
 |
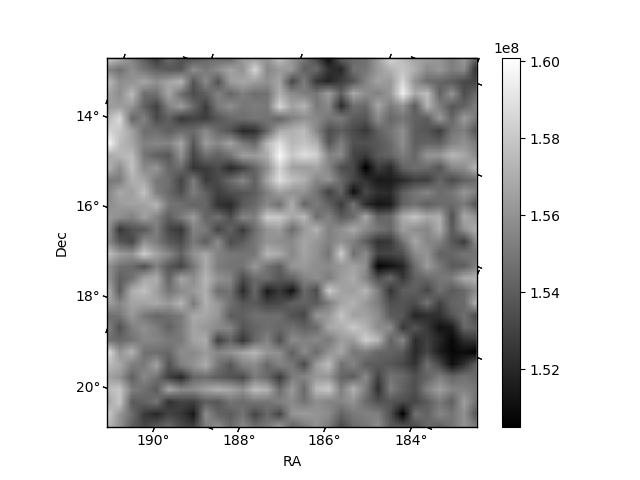
Quadrant B |
|---|---|---|---|
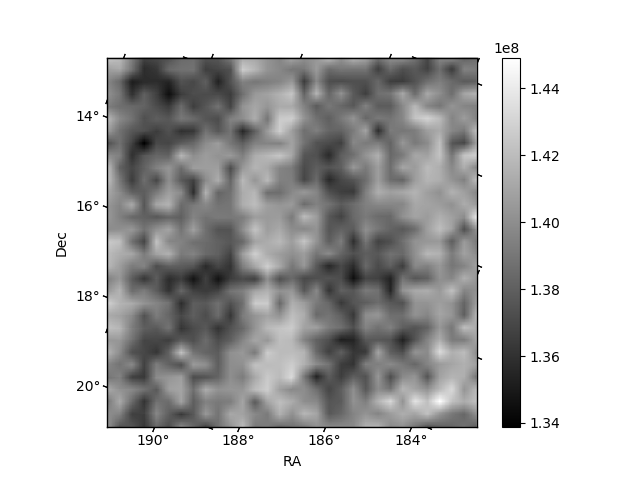
| Quadrant D | 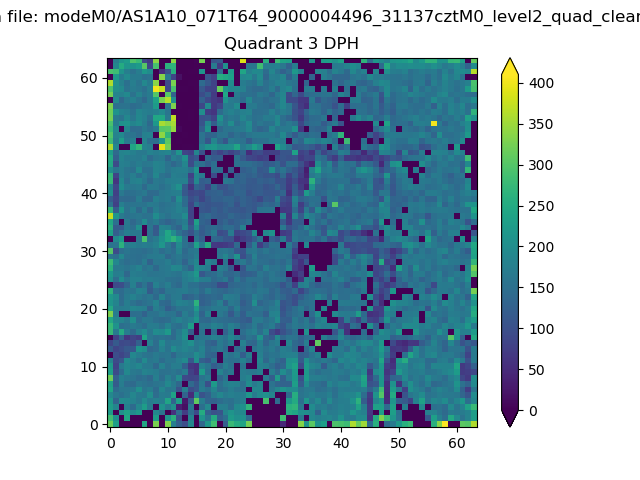 |
 |
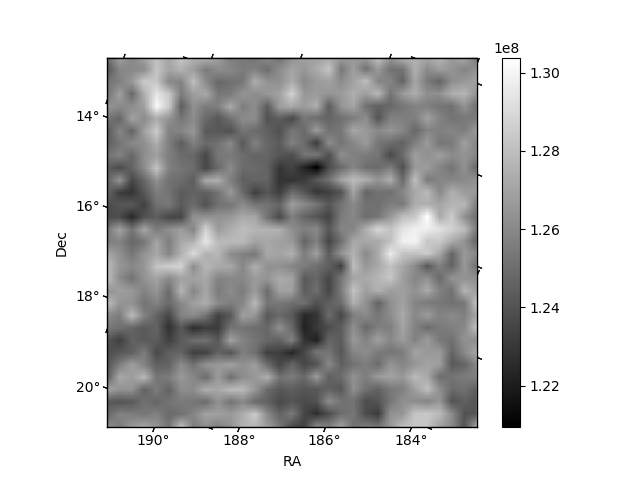
Quadrant C |
| Plot type | Count rate plots | Images |
|---|---|---|
| Comparison with Poisson distribution Blue bars denote a histogram of data divided into 1 sec bins. Red curve is a Poisson curve with rate = median count rate of data. |
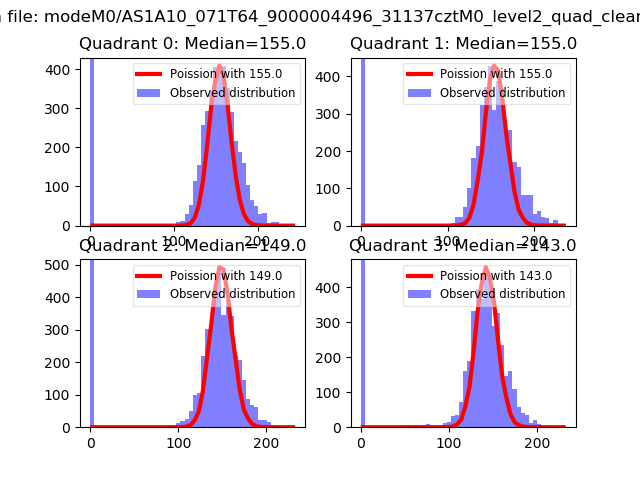 |
 |
| Quadrant-wise count rates Data is divided into 100 sec bins |
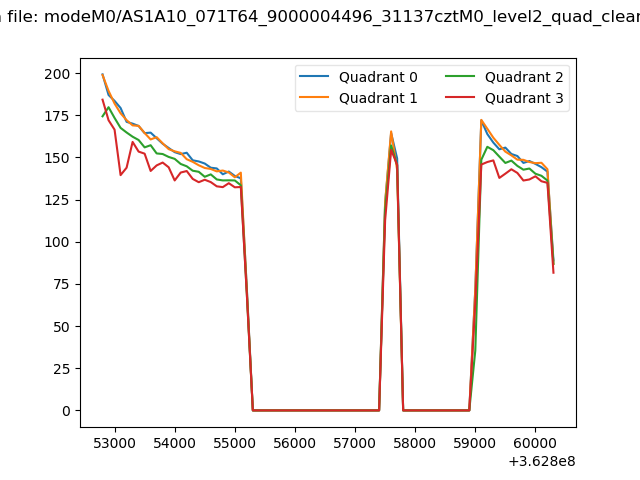 |
|
| Module-wise count rates for Quadrant A Data is divided into 100 sec bins |
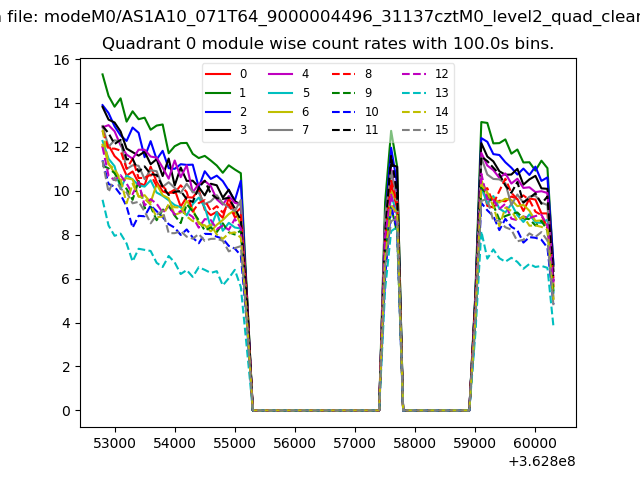 |
 |
| Module-wise count rates for Quadrant B Data is divided into 100 sec bins |
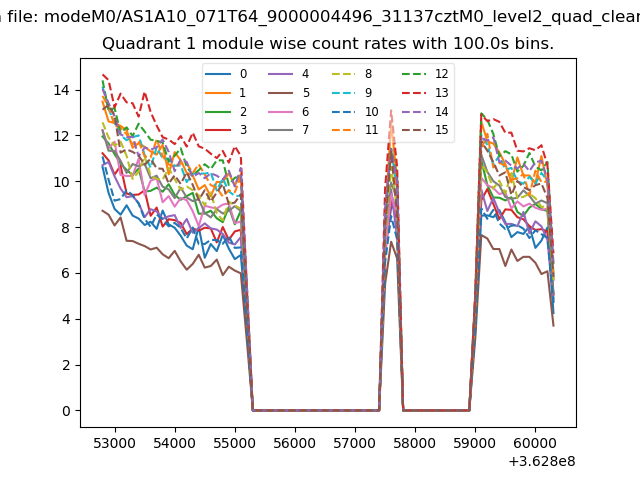 |
 |
| Module-wise count rates for Quadrant C Data is divided into 100 sec bins |
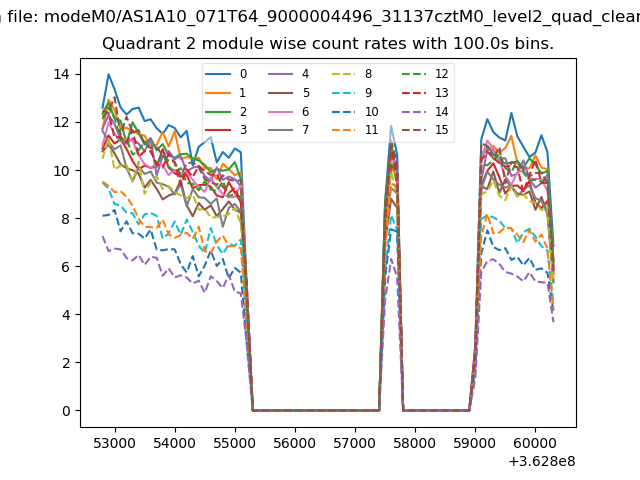 |
 |
| Module-wise count rates for Quadrant D Data is divided into 100 sec bins |
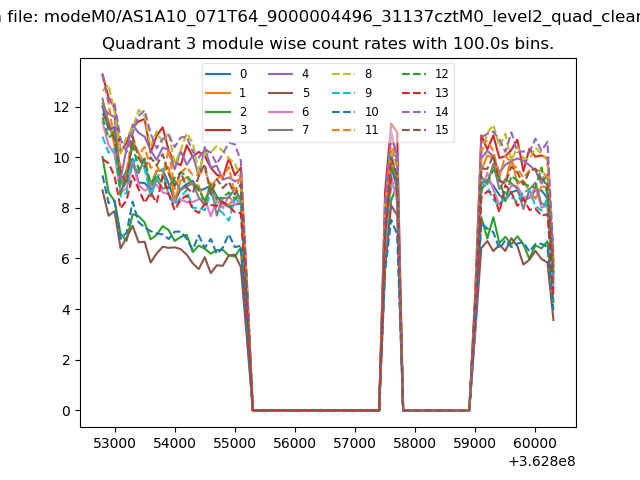 |
 |
| Parameter | Plot |
|---|---|
| CZT HV Monitor |  |
| D_VDD | 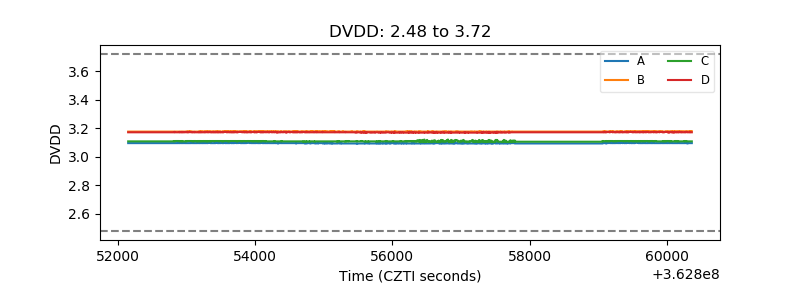 |
| Temperature 1 | 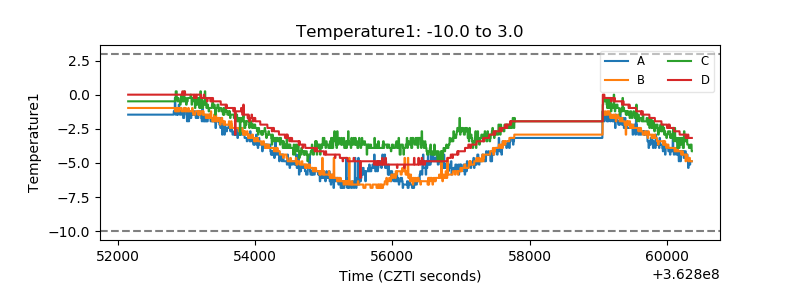 |
| Veto HV Monitor | 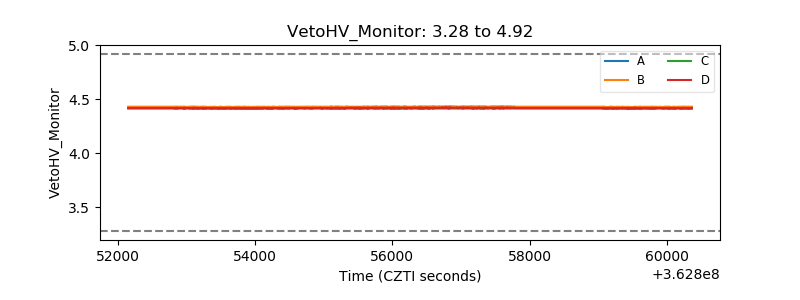 |
| Veto LLD | 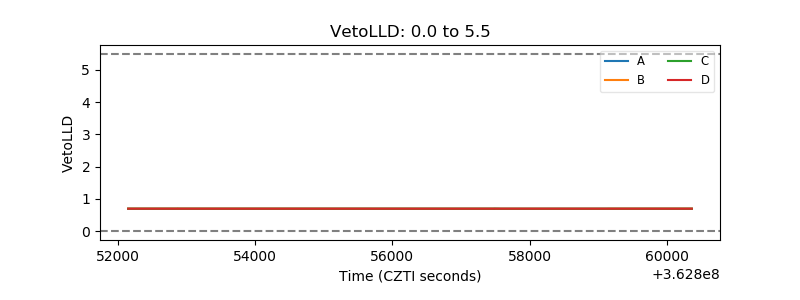 |
| Alpha Counter | 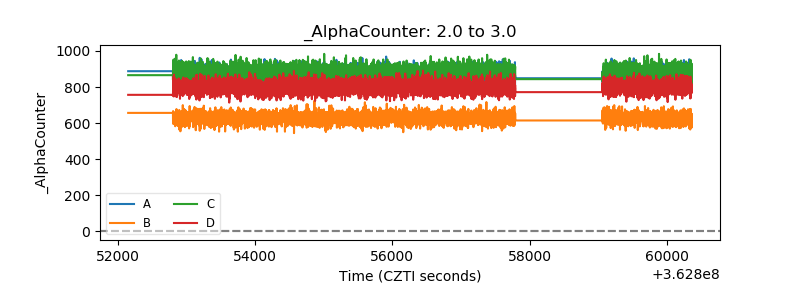 |
| _CPM_Rate | 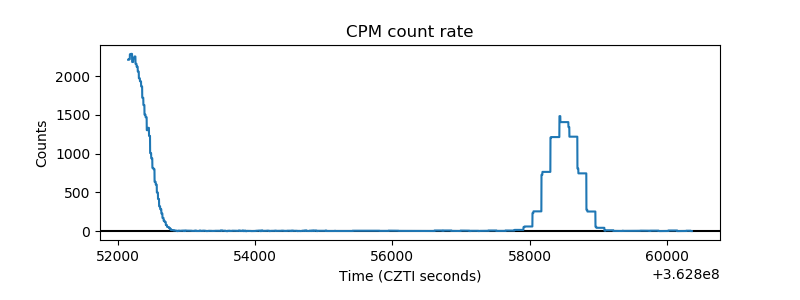 |
| CZT Counter | 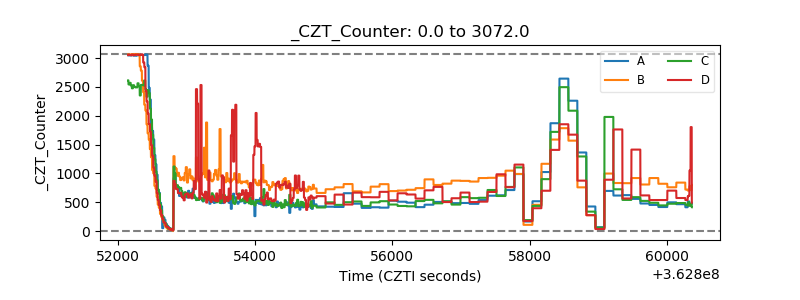 |
| +2.5 Volts monitor |  |
| +5 Volts monitor |  |
| _ROLL_ROT | 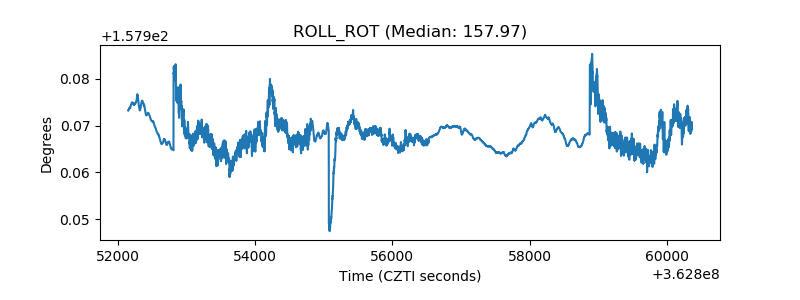 |
| _Roll_DEC | 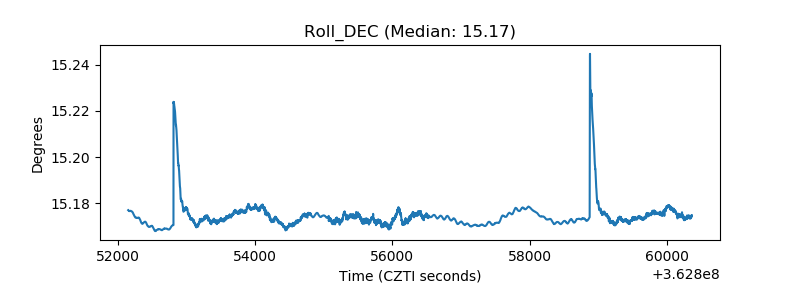 |
| _Roll_RA | 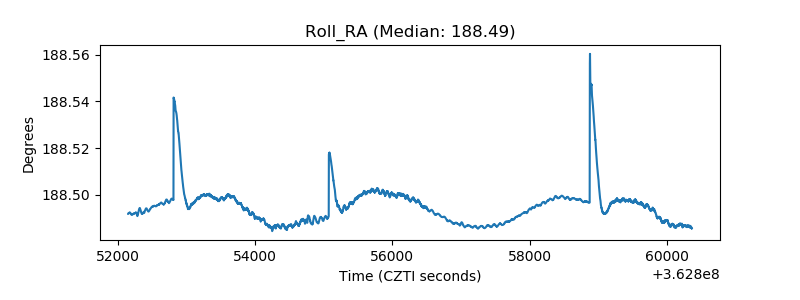 |
| Veto Counter | 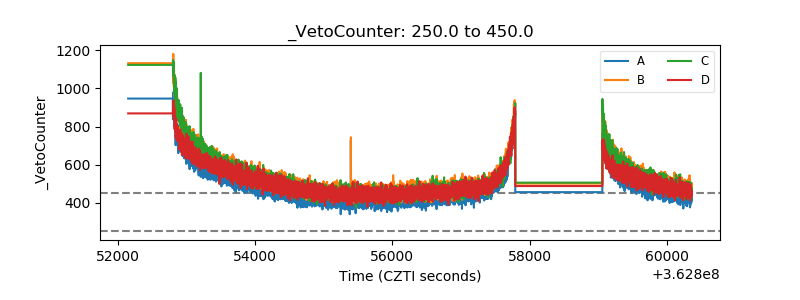 |