| Param | Original file | Final file |
|---|---|---|
| Filename | modeM0/AS1A10_071T64_9000004496_31138cztM0_level2.evt | modeM0/AS1A10_071T64_9000004496_31138cztM0_level2_quad_clean.evt |
| Size (bytes) | 364,178,880 | 48,496,320 |
| Size | 347.3 MB | 46.2 MB |
| Events in quadrant A | 2,058,797 | 301,215 |
| Events in quadrant B | 3,470,223 | 300,855 |
| Events in quadrant C | 2,260,563 | 284,963 |
| Events in quadrant D | 2,946,101 | 277,110 |
| Mode M9 | |||
|---|---|---|---|
| Quadrant | BADHDUFLAG | Total packets | Discarded packets |
| A | 0 | 2 | 0 |
| B | 0 | 3 | 0 |
| C | 0 | 3 | 0 |
| D | 0 | 3 | 0 |
| Mode SS | |||
|---|---|---|---|
| Quadrant | BADHDUFLAG | Total packets | Discarded packets |
| A | 0 | 86 | 0 |
| B | 0 | 86 | 0 |
| C | 0 | 86 | 0 |
| D | 0 | 86 | 0 |
| Mode M0 | |||
|---|---|---|---|
| Quadrant | BADHDUFLAG | Total packets | Discarded packets |
| A | 0 | 8843 | 1 |
| B | 0 | 13243 | 1 |
| C | 0 | 9354 | 1 |
| D | 0 | 11645 | 1 |
| Quadrant | Total seconds | Saturated seconds | Saturation percentage |
|---|---|---|---|
| A | 4318 | 9 | 0.208430% |
| B | 4318 | 23 | 0.532654% |
| C | 4318 | 87 | 2.014822% |
| D | 4318 | 80 | 1.852710% |
Noise dominated data is calculated using 1-second bins in cleaned event files. If a bin has >2000 counts, and if more than 50% of those come from <1% of pixels, then it is considered to be noise-dominated and hence unusable.
| Quadrant | # 1 sec bins | Bins with >0 counts | Bins with >2000 counts | High rate bins dominated by noise | Noise dominated (total time) | Noise dominated (detector-on time) | Marked lightcurve |
|---|---|---|---|---|---|---|---|
| A | 4318 | 4318 | 0 | 0 | 0.00% | 0.00% | 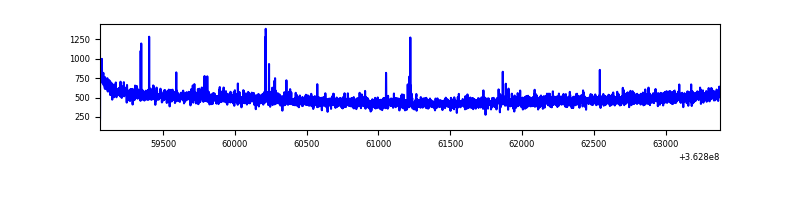 |
| B | 4318 | 4318 | 1 | 1 | 0.02% | 0.02% | 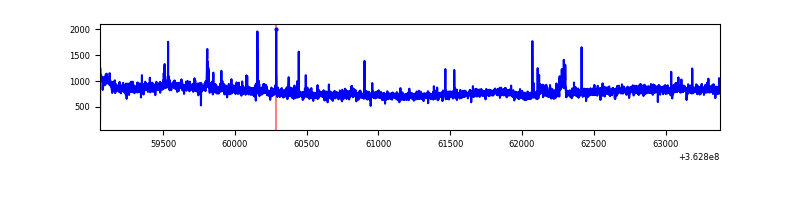 |
| C | 4318 | 4318 | 25 | 25 | 0.58% | 0.58% | 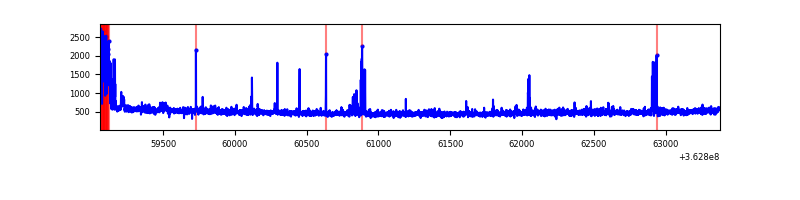 |
| D | 4318 | 4318 | 63 | 63 | 1.46% | 1.46% | 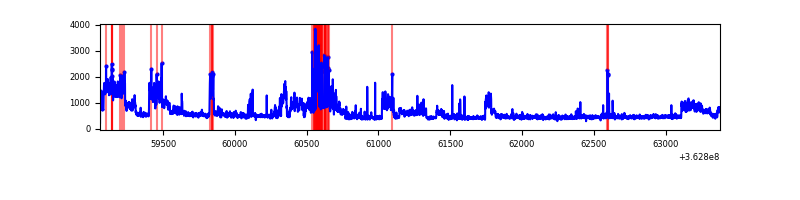 |
Top three noisy pixels from each quadrant. If the there are fewer than three noisy pixels in the level2.evt file, extra rows are filled as -1
| Pixel properties | Quadrant properties | ||||||
|---|---|---|---|---|---|---|---|
| Quadrant | DetID | PixID | Counts | Sigma | Mean | Median | Sigma |
| A | 12 | 96 | 17812 | 162.73 | 528 | 518 | 106.3 |
| A | 13 | 254 | 7963 | 70.05 | 528 | 518 | 106.3 |
| A | 3 | 137 | 5052 | 42.66 | 528 | 518 | 106.3 |
| B | 6 | 159 | 1309927 | 12911.35 | 527 | 514 | 101.4 |
| B | 0 | 190 | 20301 | 195.11 | 527 | 514 | 101.4 |
| B | 0 | 230 | 17477 | 167.26 | 527 | 514 | 101.4 |
| C | 0 | 10 | 173658 | 1448.48 | 503 | 507 | 119.5 |
| C | 14 | 238 | 83691 | 695.87 | 503 | 507 | 119.5 |
| C | 4 | 175 | 14028 | 113.11 | 503 | 507 | 119.5 |
| D | 8 | 195 | 820002 | 6285.51 | 504 | 494 | 130.4 |
| D | 13 | 249 | 140483 | 1073.7 | 504 | 494 | 130.4 |
| D | 2 | 250 | 17473 | 130.23 | 504 | 494 | 130.4 |
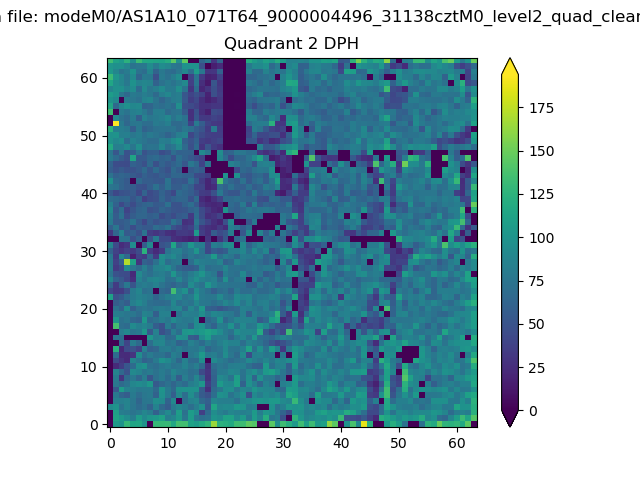
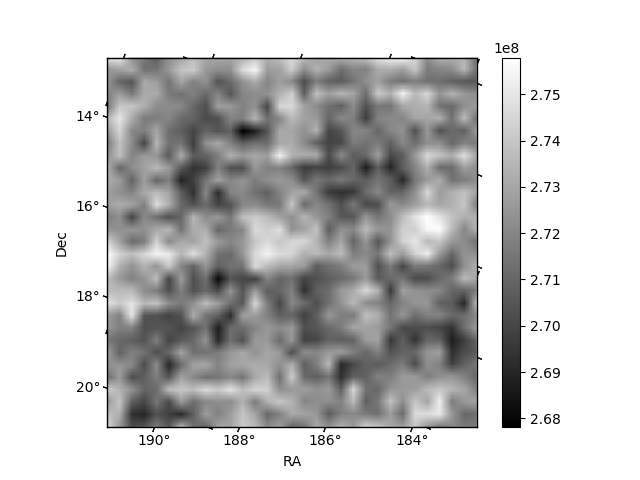
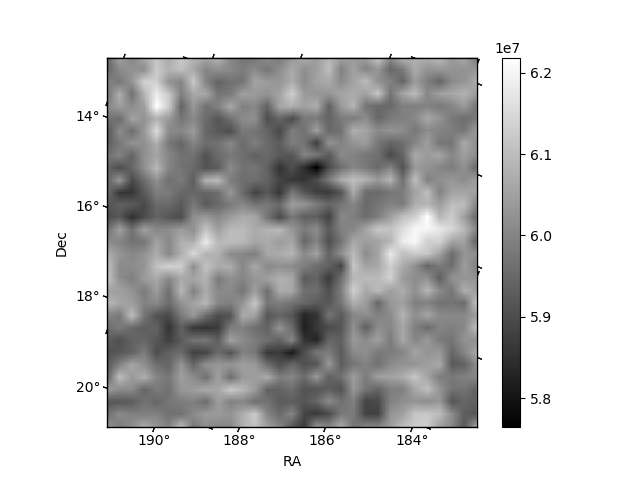
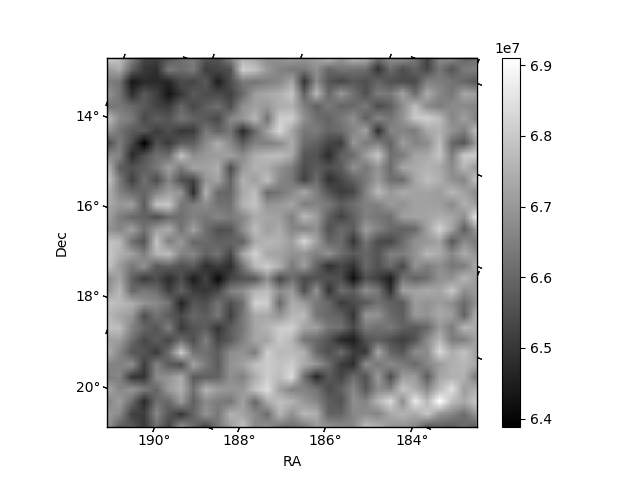
Histogram calculated using DETX and DETY for each event in the final _common_clean file
| Quadrant A | 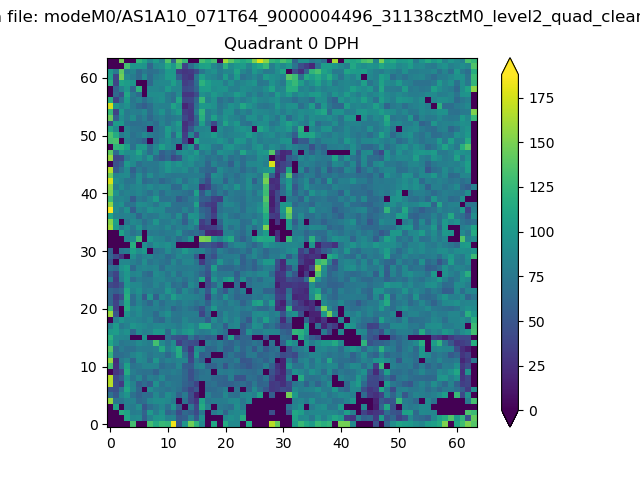 |
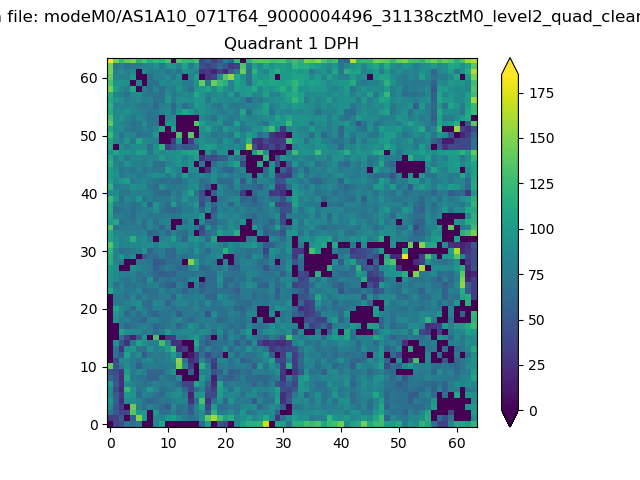 |
Quadrant B |
|---|---|---|---|
| Quadrant D | 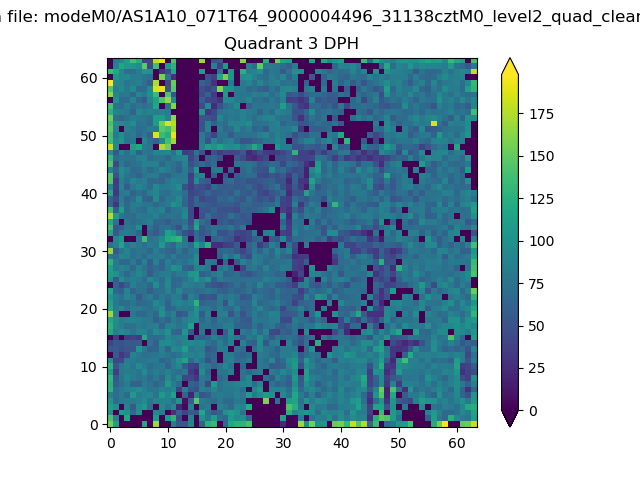 |
 |
Quadrant C |
| Plot type | Count rate plots | Images |
|---|---|---|
| Comparison with Poisson distribution Blue bars denote a histogram of data divided into 1 sec bins. Red curve is a Poisson curve with rate = median count rate of data. |
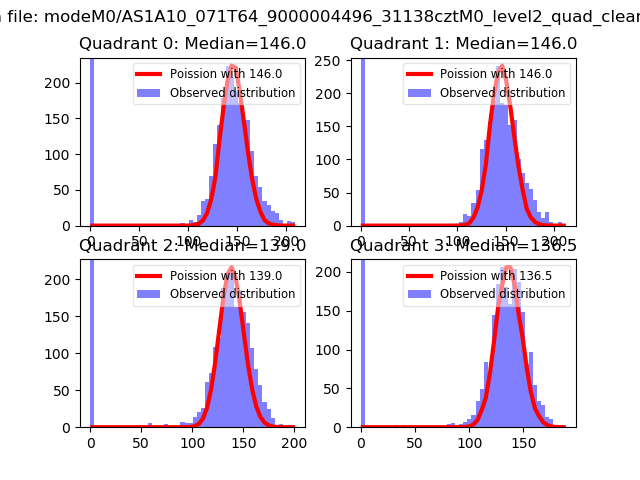 |
 |
| Quadrant-wise count rates Data is divided into 100 sec bins |
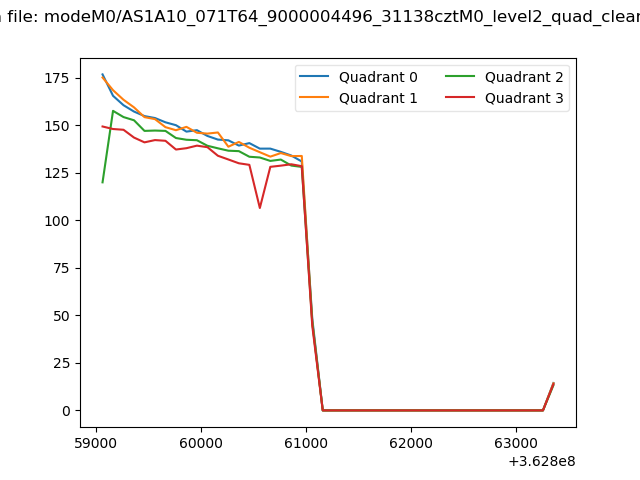 |
|
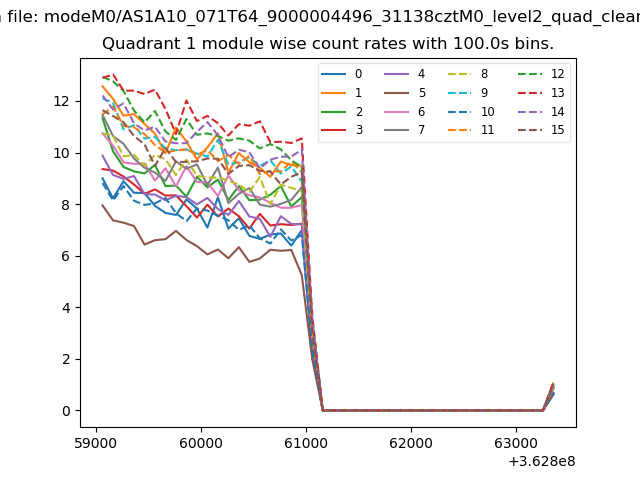
| Module-wise count rates for Quadrant A Data is divided into 100 sec bins |
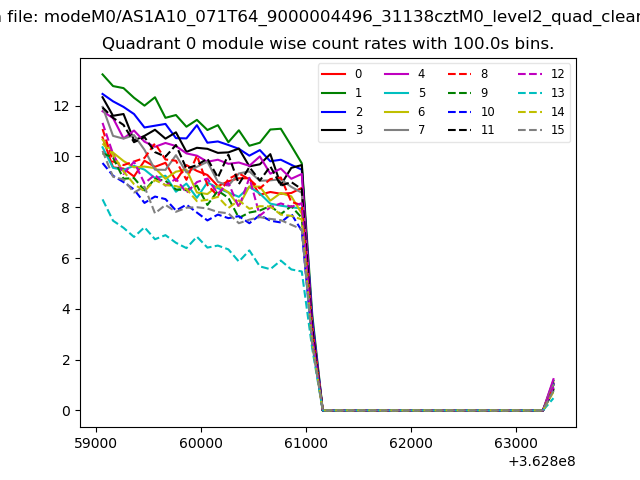 |
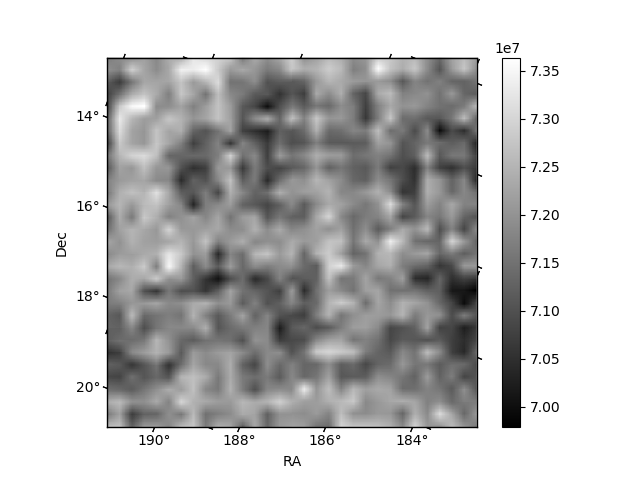 |
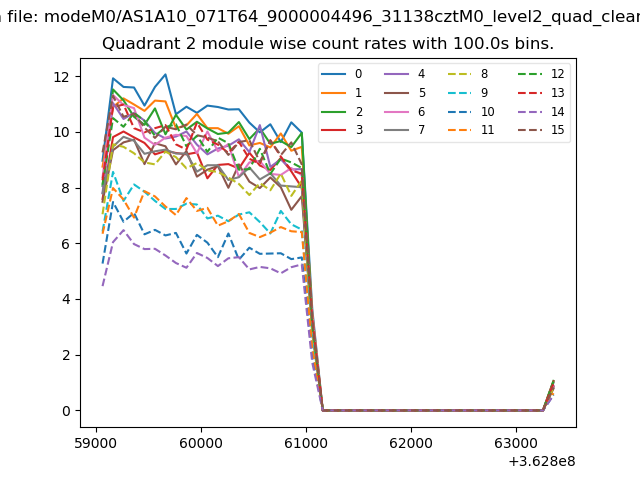
| Module-wise count rates for Quadrant B Data is divided into 100 sec bins |
 |
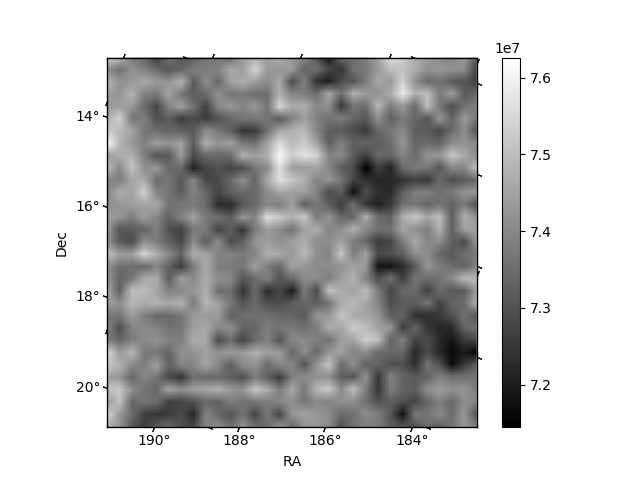 |
| Module-wise count rates for Quadrant C Data is divided into 100 sec bins |
 |
 |
| Module-wise count rates for Quadrant D Data is divided into 100 sec bins |
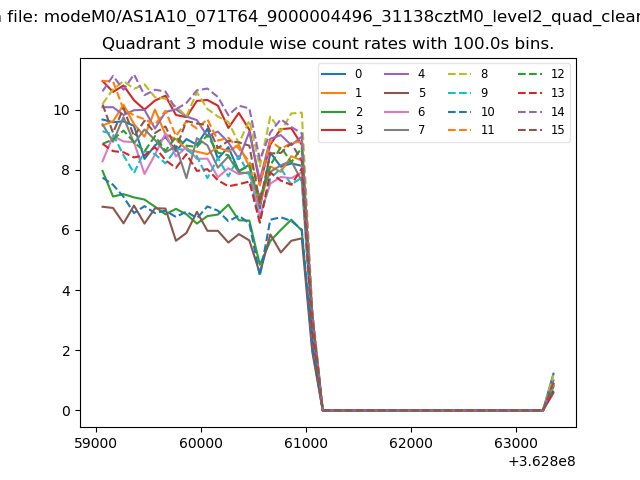 |
 |
| Parameter | Plot |
|---|---|
| CZT HV Monitor | 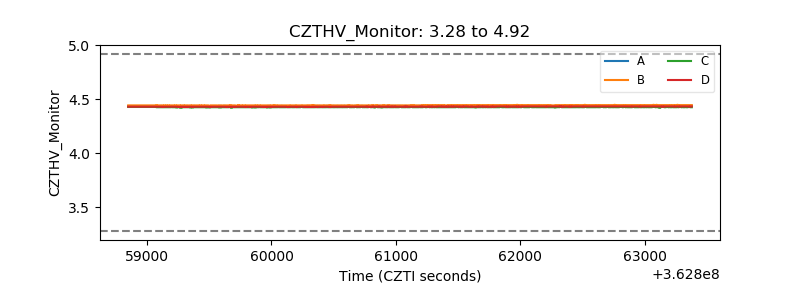 |
| D_VDD | 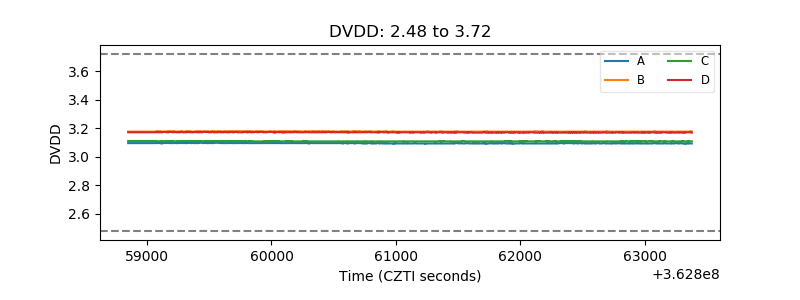 |
| Temperature 1 | 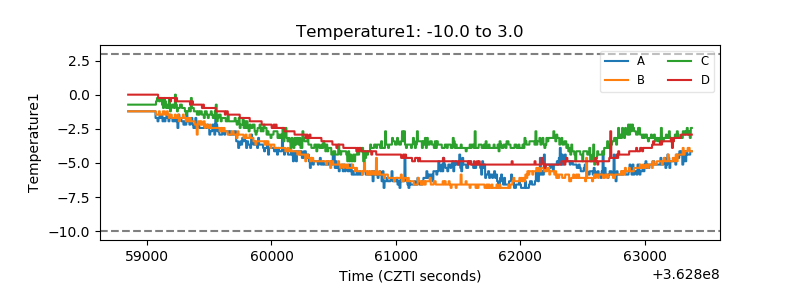 |
| Veto HV Monitor | 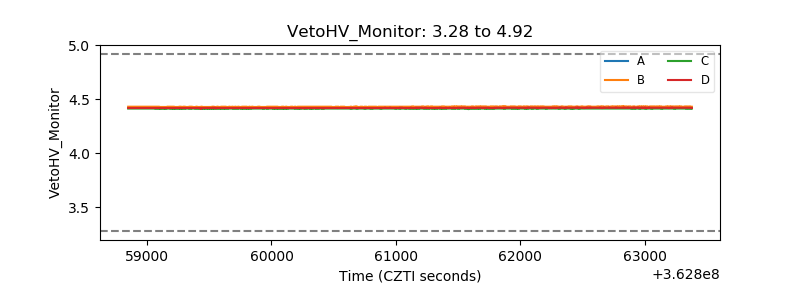 |
| Veto LLD | 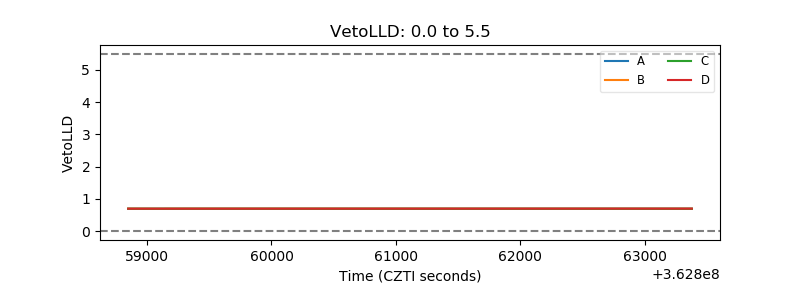 |
| Alpha Counter | 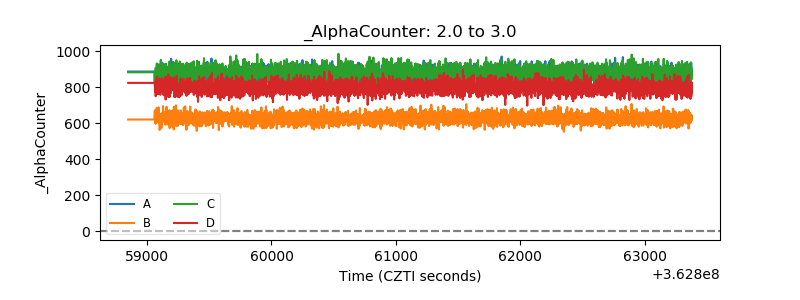 |
| _CPM_Rate | 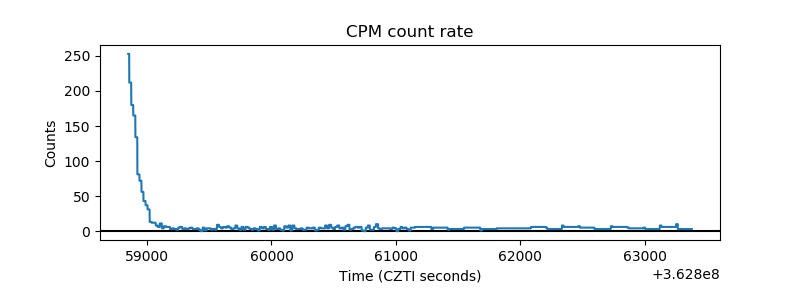 |
| CZT Counter | 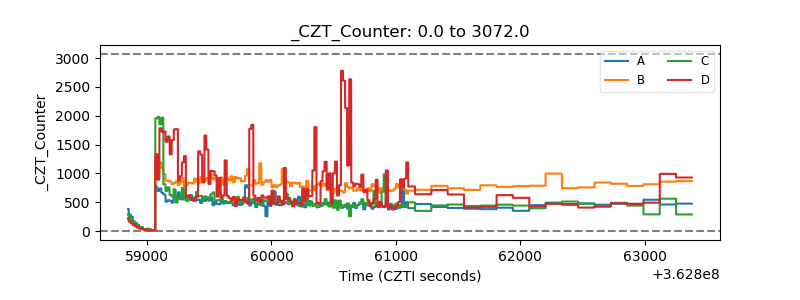 |
| +2.5 Volts monitor | 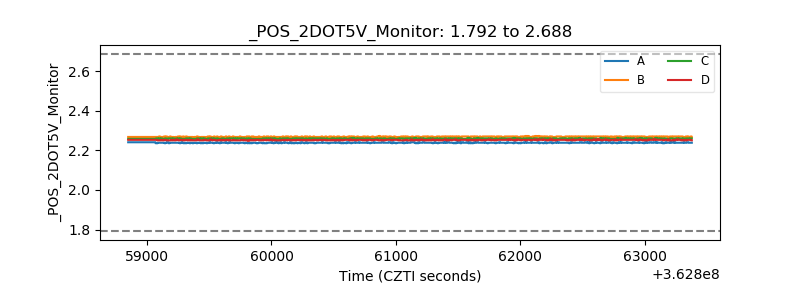 |
| +5 Volts monitor |  |
| _ROLL_ROT | 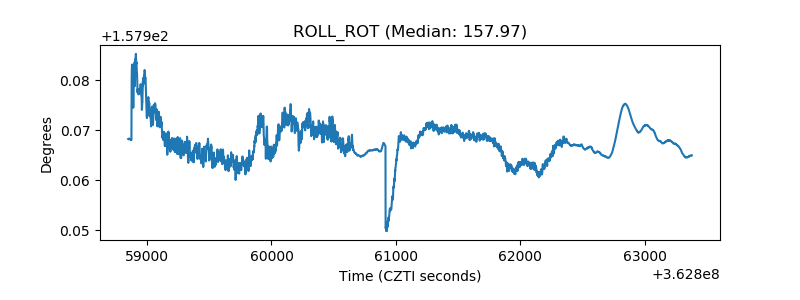 |
| _Roll_DEC | 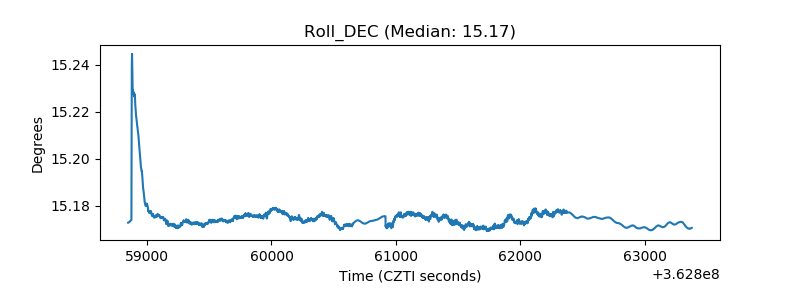 |
| _Roll_RA | 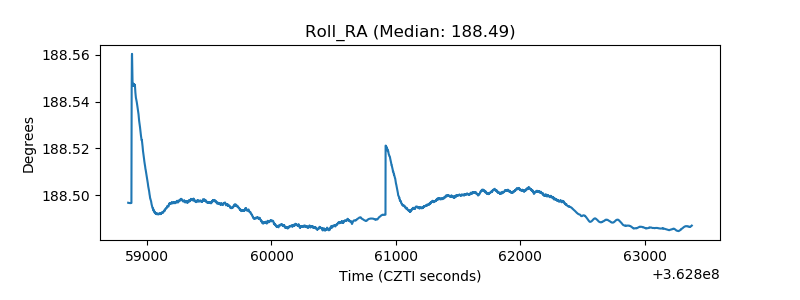 |
| Veto Counter | 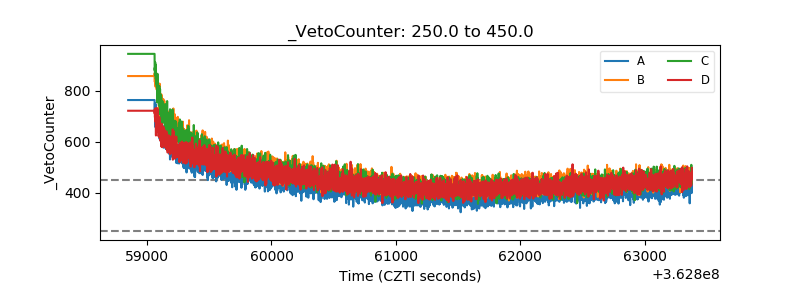 |