| Param | Original file | Final file |
|---|---|---|
| Filename | modeM0/AS1A10_071T66_9000004498cztM0_level2.fits | modeM0/AS1A10_071T66_9000004498cztM0_level2_quad_clean.evt |
| Size (bytes) | 337,429,440 | 234,092,160 |
| Size | 321.8 MB | 223.2 MB |
| Events in quadrant A | 2,084,873 | 1,237,845 |
| Events in quadrant B | 1,943,696 | 1,219,007 |
| Events in quadrant C | 2,005,492 | 1,157,092 |
| Events in quadrant D | 1,734,802 | 1,024,106 |
| Mode M0 | |||
|---|---|---|---|
| Quadrant | BADHDUFLAG | Total packets | Discarded packets |
| A | 0 | 73188 | 0 |
| B | 0 | 108729 | 0 |
| C | 0 | 77936 | 0 |
| D | 0 | 113966 | 0 |
| Mode M9 | |||
|---|---|---|---|
| Quadrant | BADHDUFLAG | Total packets | Discarded packets |
| A | 0 | 52 | 0 |
| B | 0 | 52 | 0 |
| C | 0 | 52 | 0 |
| D | 0 | 52 | 0 |
| Mode SS | |||
|---|---|---|---|
| Quadrant | BADHDUFLAG | Total packets | Discarded packets |
| A | 0 | 842 | 0 |
| B | 0 | 842 | 0 |
| C | 0 | 842 | 0 |
| D | 0 | 722 | 0 |
| Quadrant | Total seconds | Saturated seconds | Saturation percentage |
|---|---|---|---|
| A | 35376 | 390 | 1.102442% |
| B | 35357 | 828 | 2.341828% |
| C | 35364 | 856 | 2.420541% |
| D | 35380 | 1727 | 4.881289% |
Noise dominated data is calculated using 1-second bins in cleaned event files. If a bin has >2000 counts, and if more than 50% of those come from <1% of pixels, then it is considered to be noise-dominated and hence unusable.
| Quadrant | # 1 sec bins | Bins with >0 counts | Bins with >2000 counts | High rate bins dominated by noise | Noise dominated (total time) | Noise dominated (detector-on time) | Marked lightcurve |
|---|---|---|---|---|---|---|---|
| A | 39531 | 35340 | 0 | 0 | 0.00% | 0.00% | 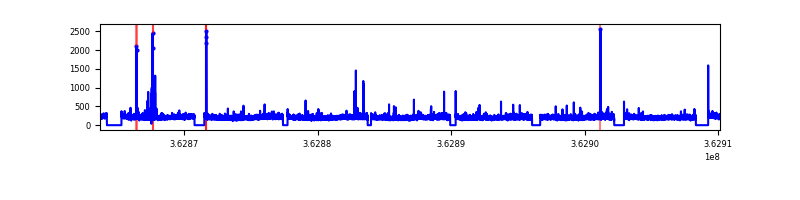 |
| B | 39530 | 35339 | 0 | 0 | 0.00% | 0.00% |  |
| C | 39530 | 35334 | 0 | 0 | 0.00% | 0.00% | 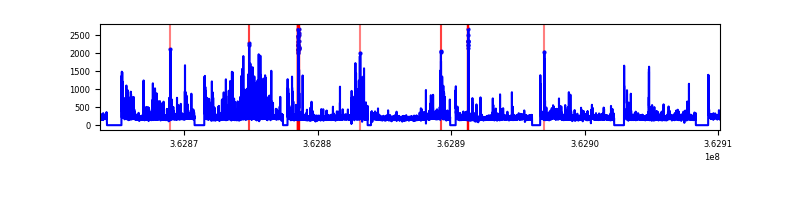 |
| D | 39530 | 35325 | 0 | 0 | 0.00% | 0.00% |  |
Top three noisy pixels from each quadrant. If the there are fewer than three noisy pixels in the level2.evt file, extra rows are filled as -1
| Pixel properties | Quadrant properties | ||||||
|---|---|---|---|---|---|---|---|
| Quadrant | DetID | PixID | Counts | Sigma | Mean | Median | Sigma |
| A | 0 | 29 | 2023 | 11.27 | 542 | 508 | 134.4 |
| A | 7 | 110 | 1653 | 8.52 | 542 | 508 | 134.4 |
| A | 0 | 30 | 1550 | 7.75 | 542 | 508 | 134.4 |
| B | 2 | 9 | 1615 | 10.86 | 513 | 488 | 103.8 |
| B | 2 | 8 | 1393 | 8.72 | 513 | 488 | 103.8 |
| B | 5 | 232 | 1348 | 8.29 | 513 | 488 | 103.8 |
| C | 12 | 241 | 1398 | 6.64 | 530 | 494 | 136.2 |
| C | 9 | 233 | 1351 | 6.29 | 530 | 494 | 136.2 |
| C | 7 | 111 | 1347 | 6.26 | 530 | 494 | 136.2 |
| D | 15 | 46 | 1332 | 6.61 | 495 | 449 | 133.7 |
| D | 10 | 189 | 1253 | 6.01 | 495 | 449 | 133.7 |
| D | 4 | 160 | 1224 | 5.8 | 495 | 449 | 133.7 |
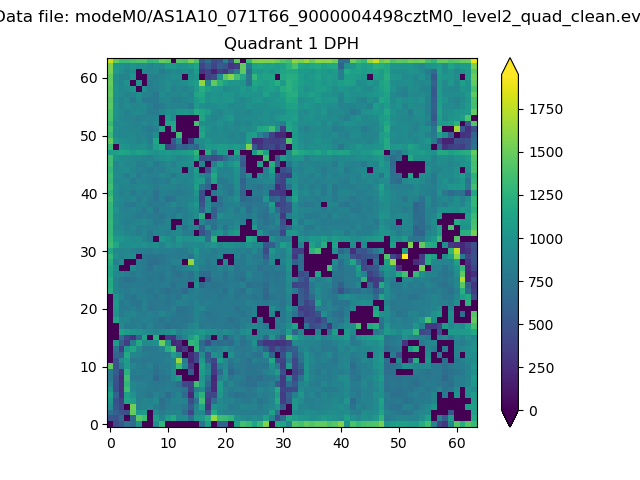
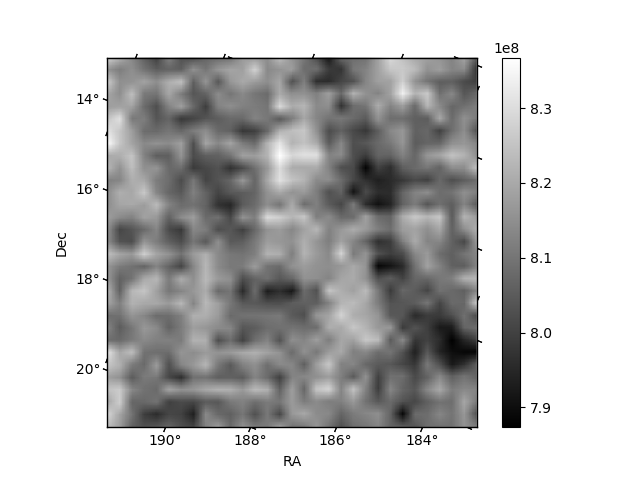
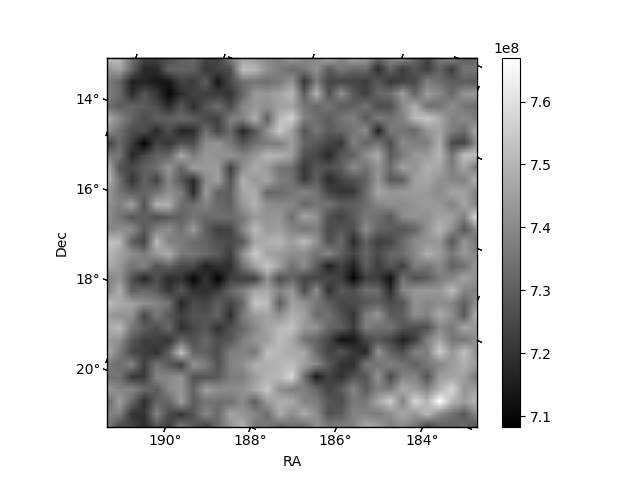
Histogram calculated using DETX and DETY for each event in the final _common_clean file
| Quadrant A |  |
 |
Quadrant B |
|---|---|---|---|
| Quadrant D | 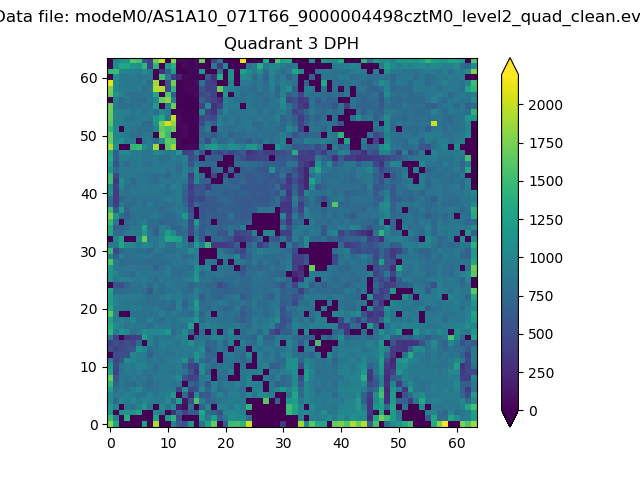 |
 |
Quadrant C |
| Plot type | Count rate plots | Images |
|---|---|---|
| Comparison with Poisson distribution Blue bars denote a histogram of data divided into 1 sec bins. Red curve is a Poisson curve with rate = median count rate of data. |
 |
 |
| Quadrant-wise count rates Data is divided into 100 sec bins |
 |
|
| Module-wise count rates for Quadrant A Data is divided into 100 sec bins |
 |
 |
| Module-wise count rates for Quadrant B Data is divided into 100 sec bins |
 |
 |
| Module-wise count rates for Quadrant C Data is divided into 100 sec bins |
 |
 |
| Module-wise count rates for Quadrant D Data is divided into 100 sec bins |
 |
 |
| Parameter | Plot |
|---|---|
| CZT HV Monitor | 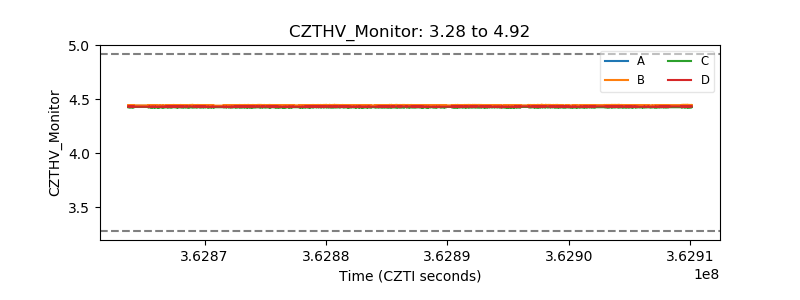 |
| D_VDD |  |
| Temperature 1 |  |
| Veto HV Monitor |  |
| Veto LLD | 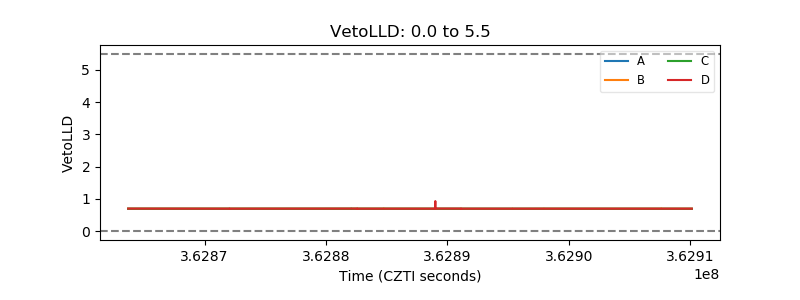 |
| Alpha Counter |  |
| _CPM_Rate |  |
| CZT Counter | 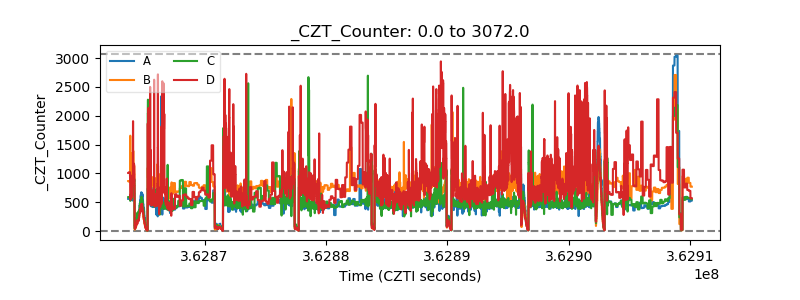 |
| +2.5 Volts monitor |  |
| +5 Volts monitor |  |
| _ROLL_ROT |  |
| _Roll_DEC | 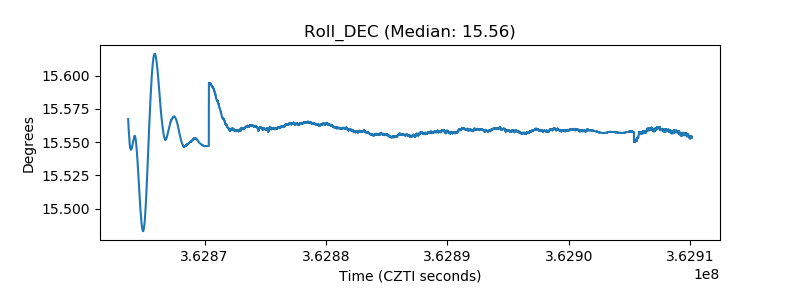 |
| _Roll_RA |  |
| Veto Counter |  |