| Param | Original file | Final file |
|---|---|---|
| Filename | modeM0/AS1A10_071T66_9000004498_31139cztM0_level2.evt | modeM0/AS1A10_071T66_9000004498_31139cztM0_level2_quad_clean.evt |
| Size (bytes) | 591,324,480 | 94,389,120 |
| Size | 563.9 MB | 90.0 MB |
| Events in quadrant A | 3,330,050 | 616,306 |
| Events in quadrant B | 5,451,373 | 613,119 |
| Events in quadrant C | 3,701,499 | 585,910 |
| Events in quadrant D | 4,962,841 | 566,648 |
| Mode M0 | |||
|---|---|---|---|
| Quadrant | BADHDUFLAG | Total packets | Discarded packets |
| A | 0 | 14267 | 2 |
| B | 0 | 21064 | 3 |
| C | 0 | 15286 | 2 |
| D | 0 | 19584 | 2 |
| Mode M9 | |||
|---|---|---|---|
| Quadrant | BADHDUFLAG | Total packets | Discarded packets |
| A | 0 | 15 | 0 |
| B | 0 | 16 | 0 |
| C | 0 | 16 | 0 |
| D | 0 | 16 | 0 |
| Mode SS | |||
|---|---|---|---|
| Quadrant | BADHDUFLAG | Total packets | Discarded packets |
| A | 0 | 140 | 0 |
| B | 0 | 140 | 0 |
| C | 0 | 140 | 0 |
| D | 0 | 140 | 0 |
| Quadrant | Total seconds | Saturated seconds | Saturation percentage |
|---|---|---|---|
| A | 6834 | 34 | 0.497512% |
| B | 6833 | 85 | 1.243963% |
| C | 6833 | 143 | 2.092785% |
| D | 6833 | 138 | 2.019611% |
Noise dominated data is calculated using 1-second bins in cleaned event files. If a bin has >2000 counts, and if more than 50% of those come from <1% of pixels, then it is considered to be noise-dominated and hence unusable.
| Quadrant | # 1 sec bins | Bins with >0 counts | Bins with >2000 counts | High rate bins dominated by noise | Noise dominated (total time) | Noise dominated (detector-on time) | Marked lightcurve |
|---|---|---|---|---|---|---|---|
| A | 7569 | 6835 | 14 | 14 | 0.18% | 0.20% | 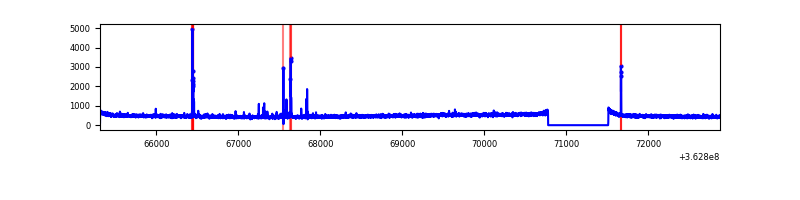 |
| B | 7568 | 6834 | 4 | 4 | 0.05% | 0.06% | 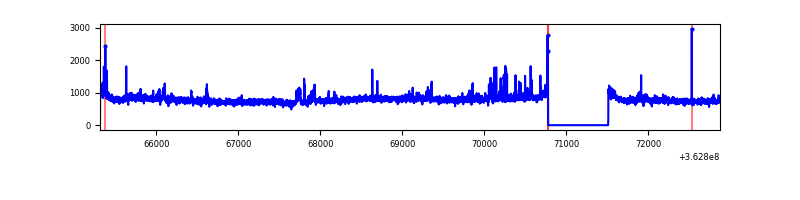 |
| C | 7568 | 6834 | 36 | 36 | 0.48% | 0.53% | 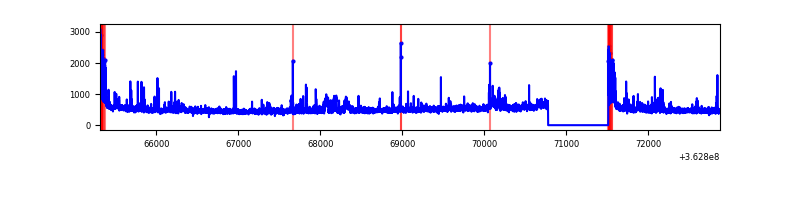 |
| D | 7568 | 6834 | 98 | 98 | 1.29% | 1.43% | 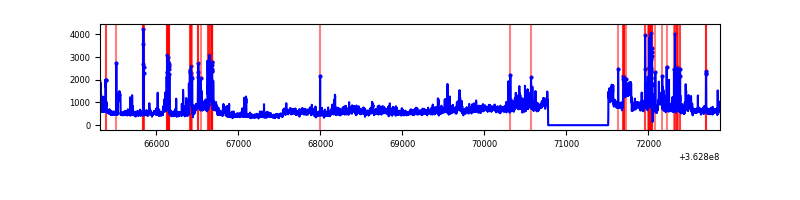 |
Top three noisy pixels from each quadrant. If the there are fewer than three noisy pixels in the level2.evt file, extra rows are filled as -1
| Pixel properties | Quadrant properties | ||||||
|---|---|---|---|---|---|---|---|
| Quadrant | DetID | PixID | Counts | Sigma | Mean | Median | Sigma |
| A | 12 | 96 | 79076 | 465.13 | 839 | 823 | 168.2 |
| A | 13 | 254 | 13294 | 74.13 | 839 | 823 | 168.2 |
| A | 11 | 29 | 11254 | 62.0 | 839 | 823 | 168.2 |
| B | 6 | 159 | 1955480 | 12129.43 | 833 | 812 | 161.2 |
| B | 0 | 190 | 81812 | 502.63 | 833 | 812 | 161.2 |
| B | 0 | 183 | 70425 | 431.97 | 833 | 812 | 161.2 |
| C | 0 | 10 | 283801 | 1492.22 | 802 | 809 | 189.6 |
| C | 14 | 238 | 127851 | 669.89 | 802 | 809 | 189.6 |
| C | 10 | 22 | 55441 | 288.08 | 802 | 809 | 189.6 |
| D | 8 | 195 | 1510414 | 7778.03 | 806 | 786 | 194.1 |
| D | 13 | 249 | 282038 | 1449.09 | 806 | 786 | 194.1 |
| D | 2 | 250 | 54896 | 278.79 | 806 | 786 | 194.1 |
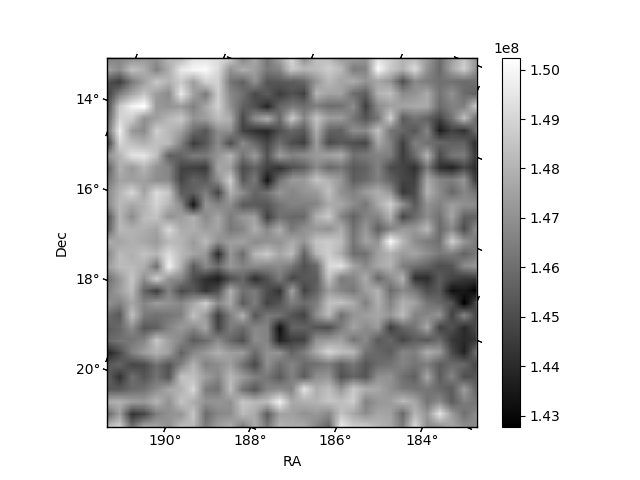
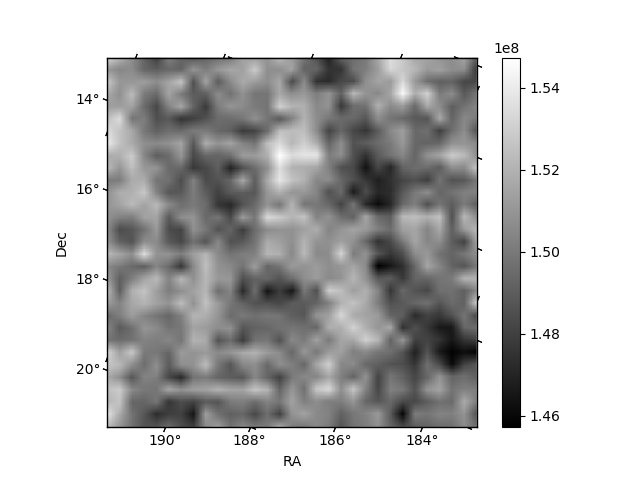
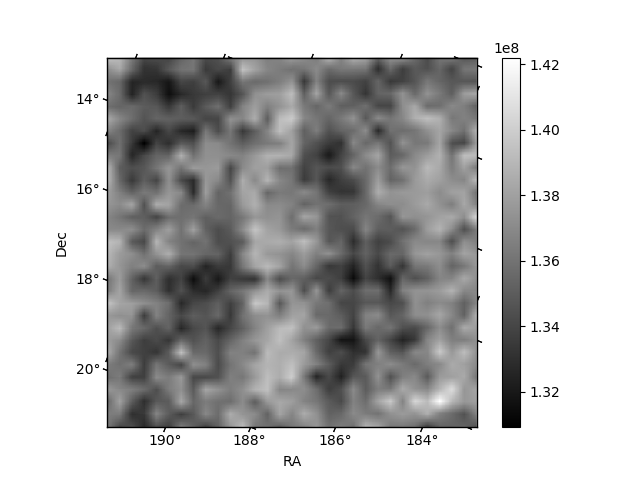
Histogram calculated using DETX and DETY for each event in the final _common_clean file
| Quadrant A | 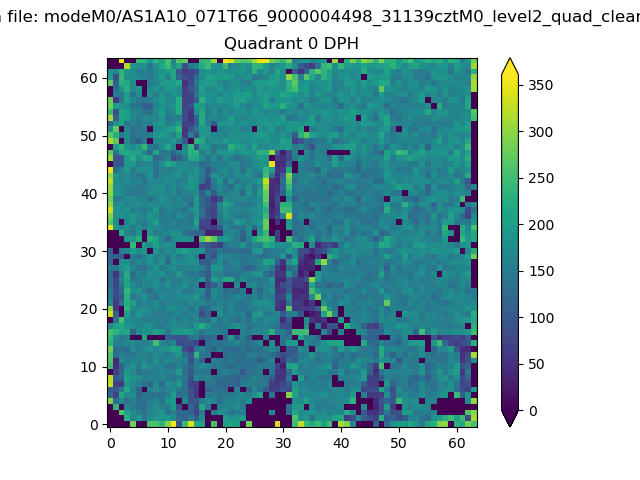 |
 |
Quadrant B |
|---|---|---|---|
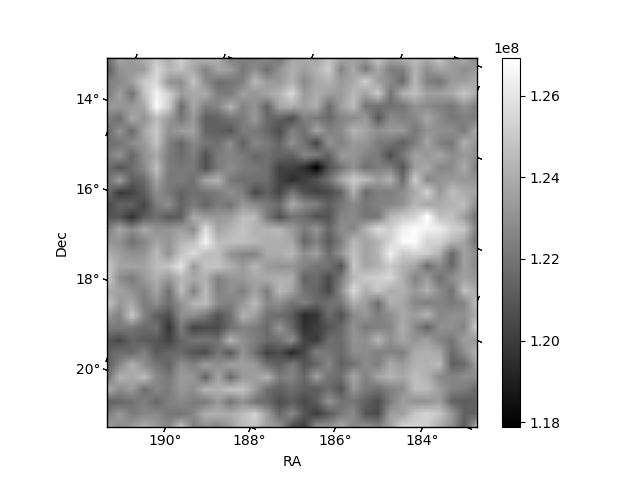
| Quadrant D | 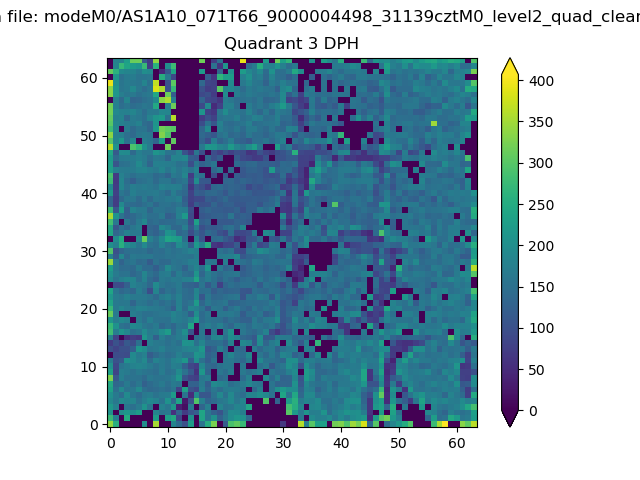 |
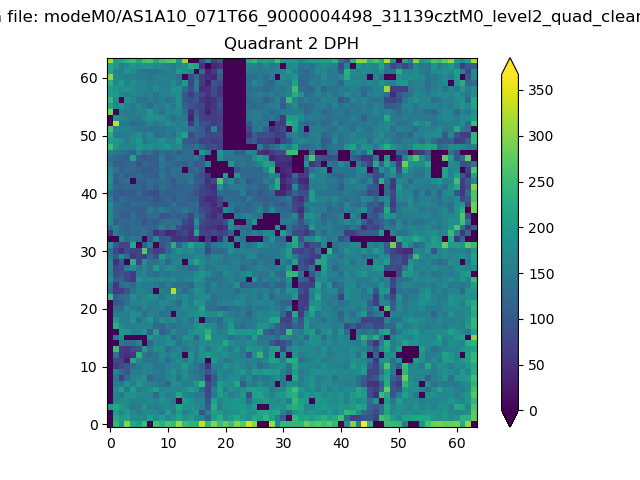 |
Quadrant C |
| Plot type | Count rate plots | Images |
|---|---|---|
| Comparison with Poisson distribution Blue bars denote a histogram of data divided into 1 sec bins. Red curve is a Poisson curve with rate = median count rate of data. |
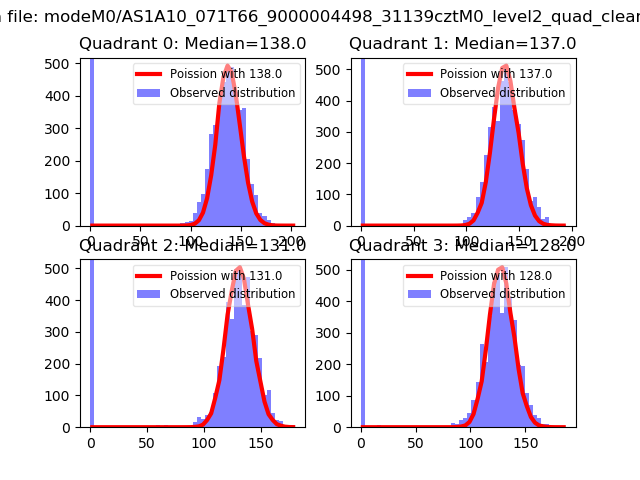 |
 |
| Quadrant-wise count rates Data is divided into 100 sec bins |
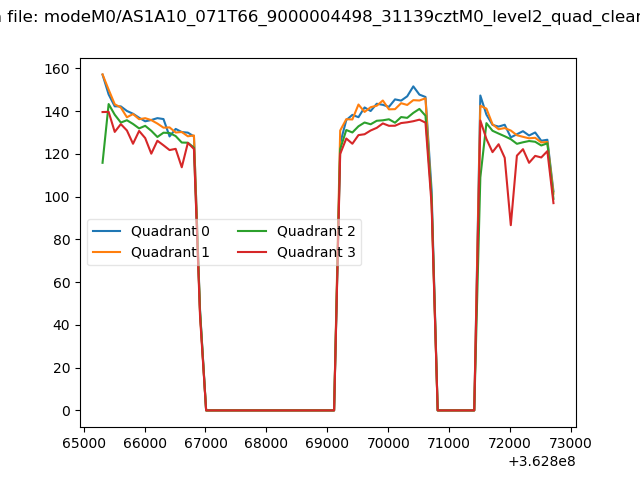 |
|
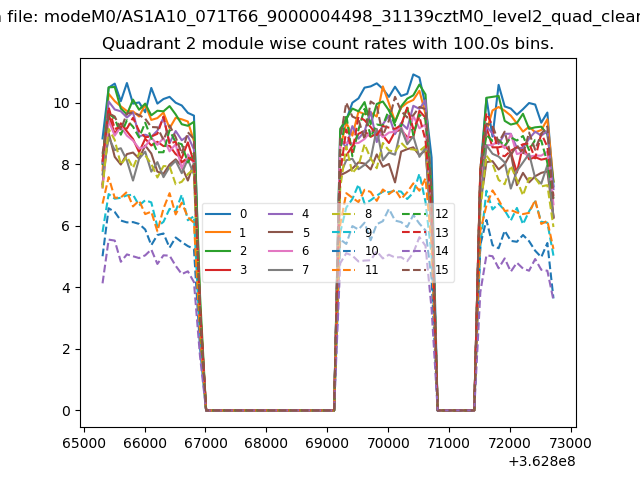
| Module-wise count rates for Quadrant A Data is divided into 100 sec bins |
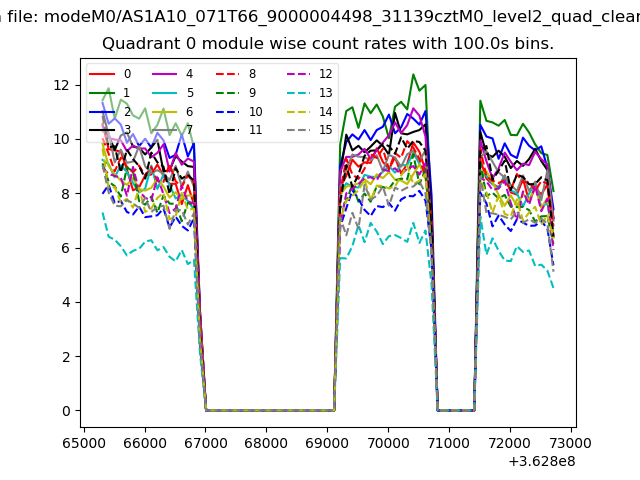 |
 |
| Module-wise count rates for Quadrant B Data is divided into 100 sec bins |
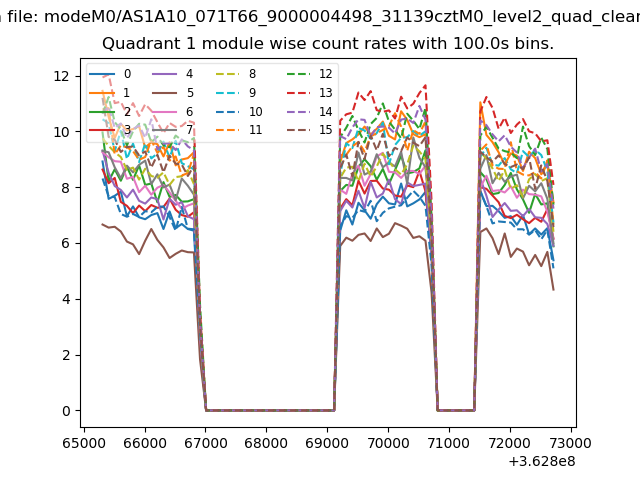 |
 |
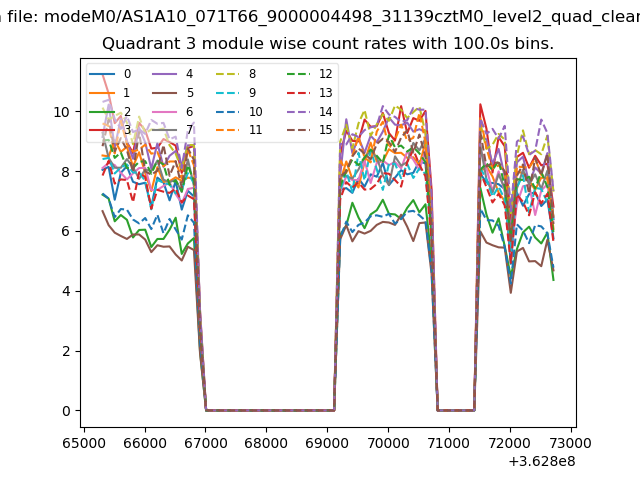
| Module-wise count rates for Quadrant C Data is divided into 100 sec bins |
 |
 |
| Module-wise count rates for Quadrant D Data is divided into 100 sec bins |
 |
 |
| Parameter | Plot |
|---|---|
| CZT HV Monitor | 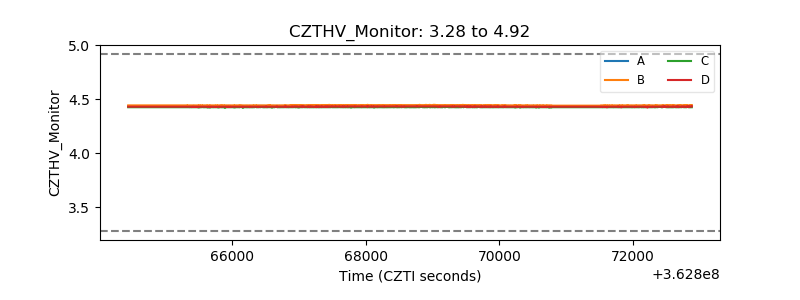 |
| D_VDD | 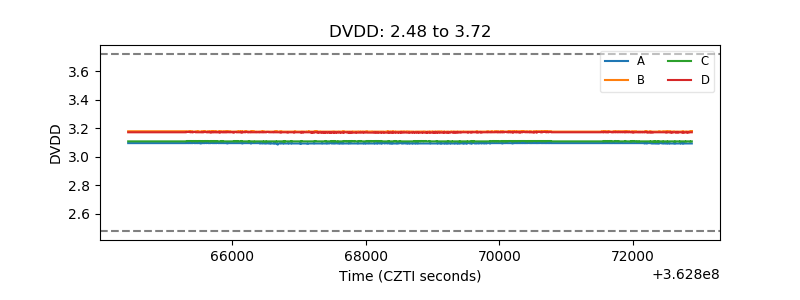 |
| Temperature 1 | 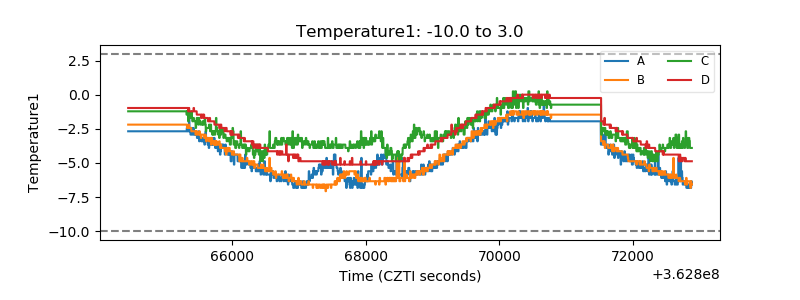 |
| Veto HV Monitor | 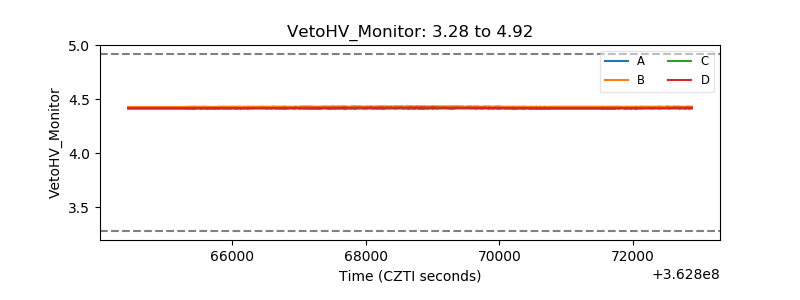 |
| Veto LLD |  |
| Alpha Counter | 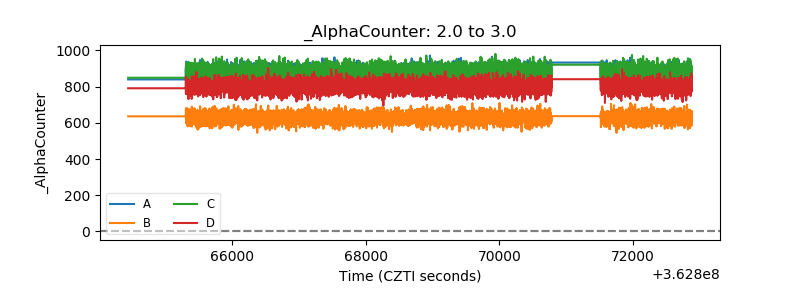 |
| _CPM_Rate | 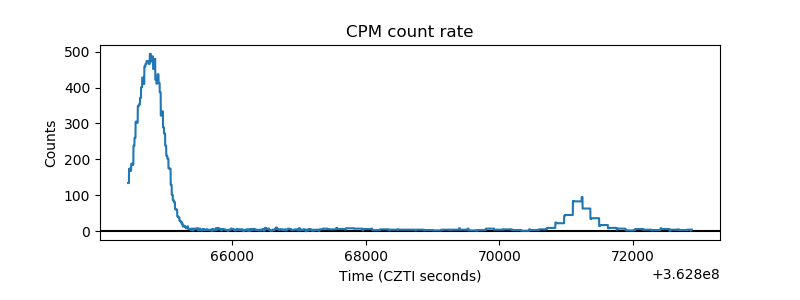 |
| CZT Counter | 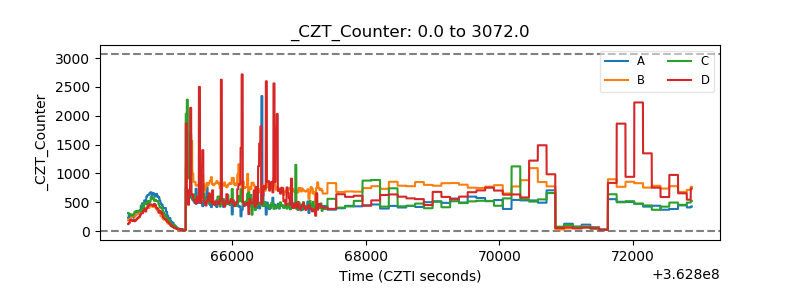 |
| +2.5 Volts monitor |  |
| +5 Volts monitor |  |
| _ROLL_ROT | 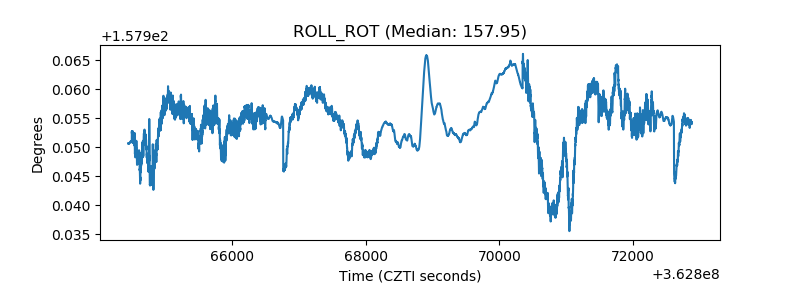 |
| _Roll_DEC | 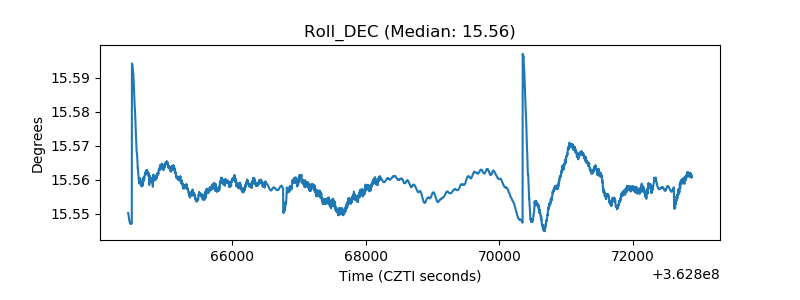 |
| _Roll_RA |  |
| Veto Counter | 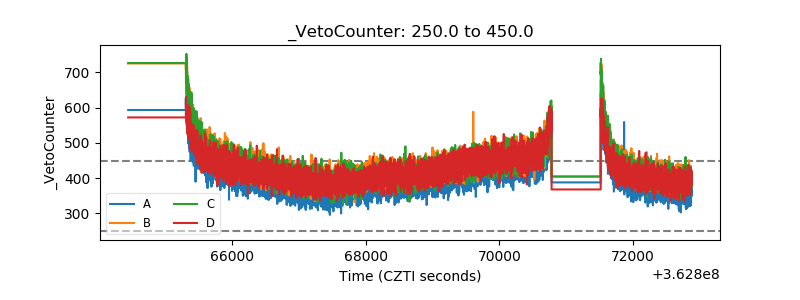 |