| Param | Original file | Final file |
|---|---|---|
| Filename | modeM0/AS1A10_071T66_9000004498_31140cztM0_level2.evt | modeM0/AS1A10_071T66_9000004498_31140cztM0_level2_quad_clean.evt |
| Size (bytes) | 649,471,680 | 94,296,960 |
| Size | 619.4 MB | 89.9 MB |
| Events in quadrant A | 3,506,643 | 603,833 |
| Events in quadrant B | 5,853,500 | 599,200 |
| Events in quadrant C | 4,281,752 | 576,825 |
| Events in quadrant D | 5,527,937 | 561,407 |
| Mode M0 | |||
|---|---|---|---|
| Quadrant | BADHDUFLAG | Total packets | Discarded packets |
| A | 0 | 15198 | 2 |
| B | 0 | 22776 | 2 |
| C | 0 | 17347 | 2 |
| D | 0 | 21550 | 2 |
| Mode M9 | |||
|---|---|---|---|
| Quadrant | BADHDUFLAG | Total packets | Discarded packets |
| A | 0 | 4 | 0 |
| B | 0 | 4 | 0 |
| C | 0 | 4 | 0 |
| D | 0 | 4 | 0 |
| Mode SS | |||
|---|---|---|---|
| Quadrant | BADHDUFLAG | Total packets | Discarded packets |
| A | 0 | 150 | 0 |
| B | 0 | 150 | 0 |
| C | 0 | 150 | 0 |
| D | 0 | 150 | 0 |
| Quadrant | Total seconds | Saturated seconds | Saturation percentage |
|---|---|---|---|
| A | 7386 | 64 | 0.866504% |
| B | 7387 | 168 | 2.274266% |
| C | 7387 | 245 | 3.316637% |
| D | 7387 | 175 | 2.369027% |
Noise dominated data is calculated using 1-second bins in cleaned event files. If a bin has >2000 counts, and if more than 50% of those come from <1% of pixels, then it is considered to be noise-dominated and hence unusable.
| Quadrant | # 1 sec bins | Bins with >0 counts | Bins with >2000 counts | High rate bins dominated by noise | Noise dominated (total time) | Noise dominated (detector-on time) | Marked lightcurve |
|---|---|---|---|---|---|---|---|
| A | 7731 | 7387 | 3 | 3 | 0.04% | 0.04% | 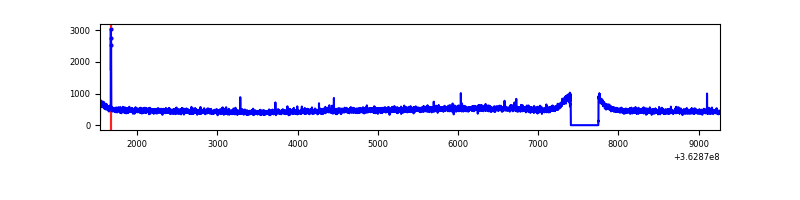 |
| B | 7732 | 7388 | 7 | 7 | 0.09% | 0.09% | 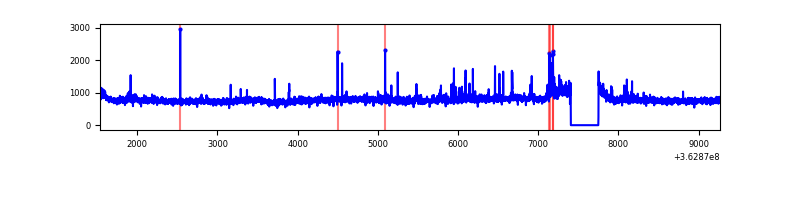 |
| C | 7732 | 7388 | 67 | 67 | 0.87% | 0.91% | 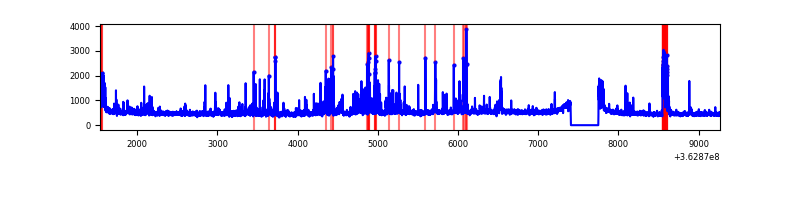 |
| D | 7732 | 7388 | 96 | 96 | 1.24% | 1.30% | 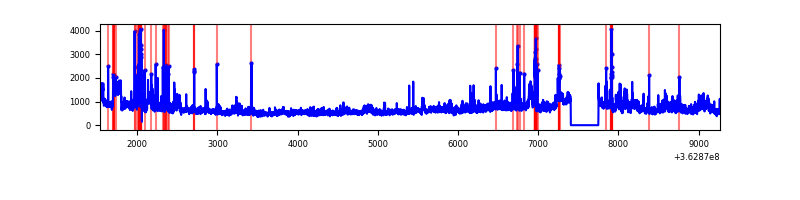 |
Top three noisy pixels from each quadrant. If the there are fewer than three noisy pixels in the level2.evt file, extra rows are filled as -1
| Pixel properties | Quadrant properties | ||||||
|---|---|---|---|---|---|---|---|
| Quadrant | DetID | PixID | Counts | Sigma | Mean | Median | Sigma |
| A | 13 | 254 | 14673 | 75.14 | 905 | 883 | 183.5 |
| A | 11 | 29 | 11378 | 57.19 | 905 | 883 | 183.5 |
| A | 3 | 137 | 9217 | 45.41 | 905 | 883 | 183.5 |
| B | 6 | 159 | 2119969 | 12022.07 | 897 | 873 | 176.3 |
| B | 0 | 190 | 107116 | 602.74 | 897 | 873 | 176.3 |
| B | 0 | 230 | 32241 | 177.96 | 897 | 873 | 176.3 |
| C | 15 | 208 | 431758 | 2094.62 | 865 | 870 | 205.7 |
| C | 0 | 10 | 291226 | 1411.47 | 865 | 870 | 205.7 |
| C | 14 | 238 | 137927 | 666.26 | 865 | 870 | 205.7 |
| D | 8 | 195 | 1856700 | 8126.81 | 863 | 846 | 228.4 |
| D | 13 | 249 | 274426 | 1198.01 | 863 | 846 | 228.4 |
| D | 2 | 120 | 38959 | 166.9 | 863 | 846 | 228.4 |
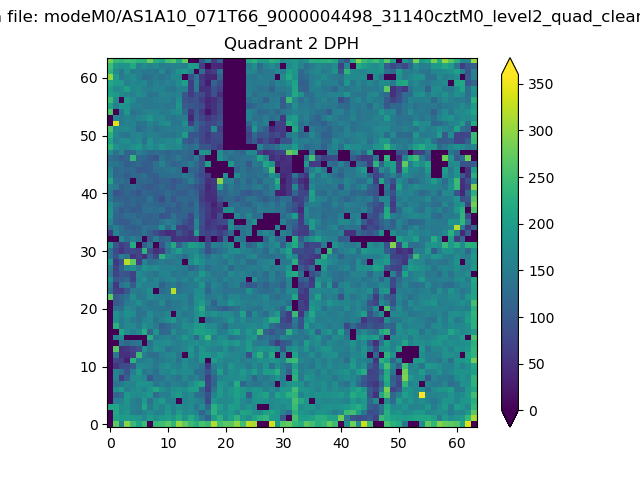
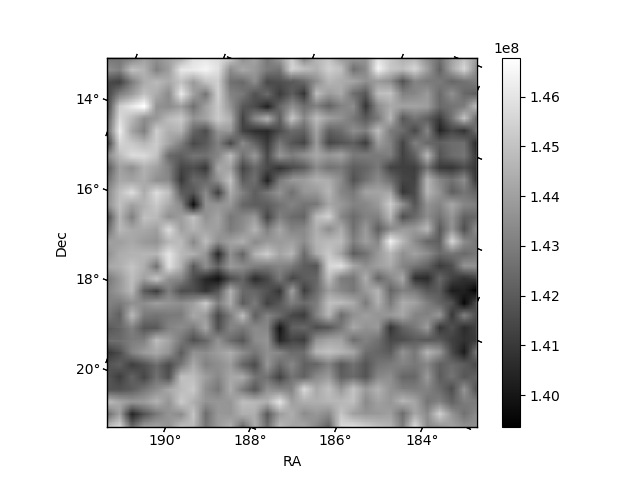
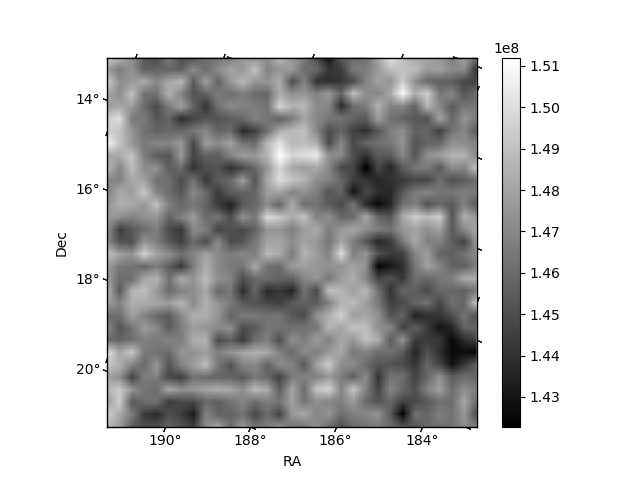
Histogram calculated using DETX and DETY for each event in the final _common_clean file
| Quadrant A | 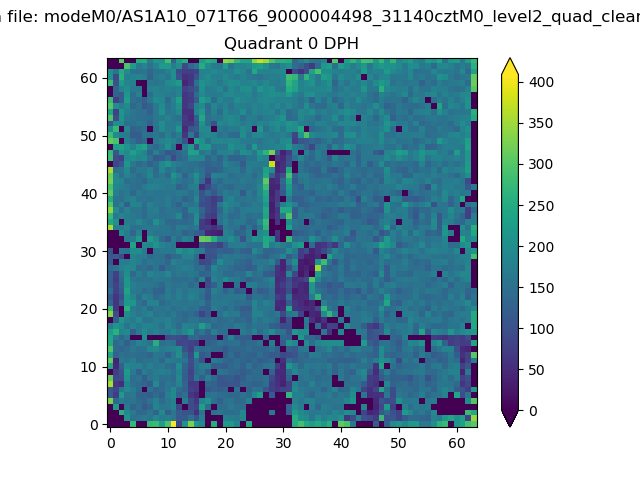 |
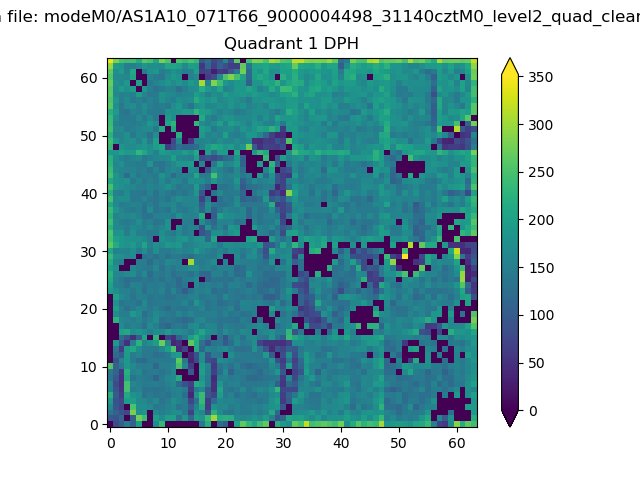 |
Quadrant B |
|---|---|---|---|
| Quadrant D | 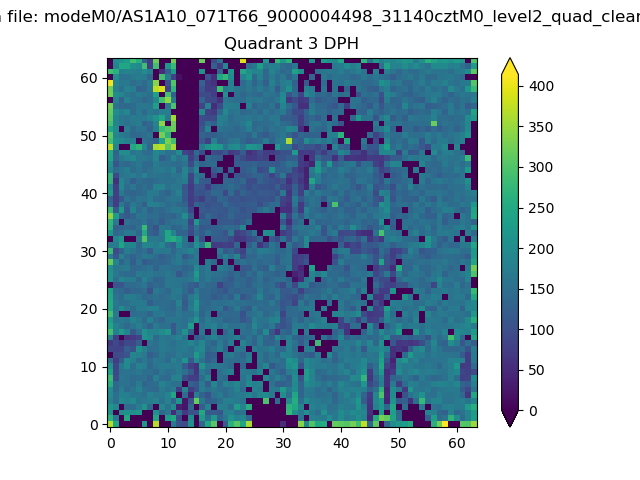 |
 |
Quadrant C |
| Plot type | Count rate plots | Images |
|---|---|---|
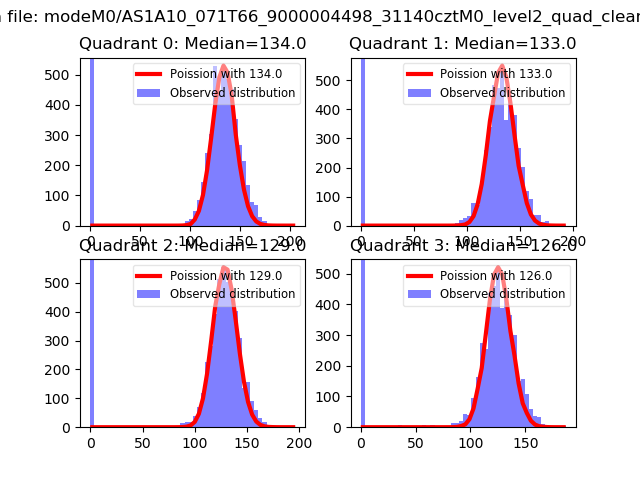
| Comparison with Poisson distribution Blue bars denote a histogram of data divided into 1 sec bins. Red curve is a Poisson curve with rate = median count rate of data. |
 |
 |
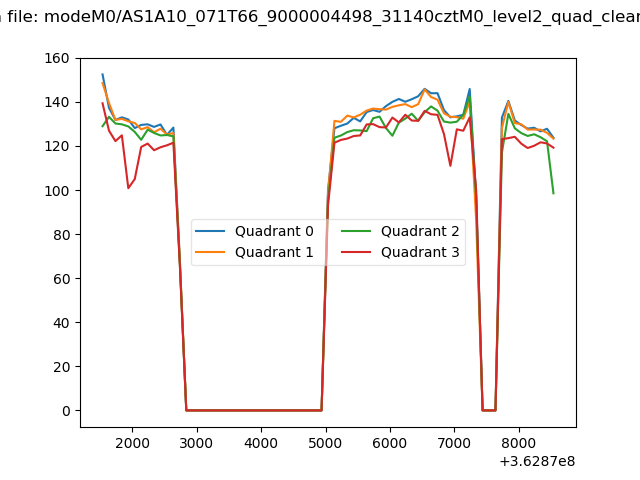
| Quadrant-wise count rates Data is divided into 100 sec bins |
 |
|
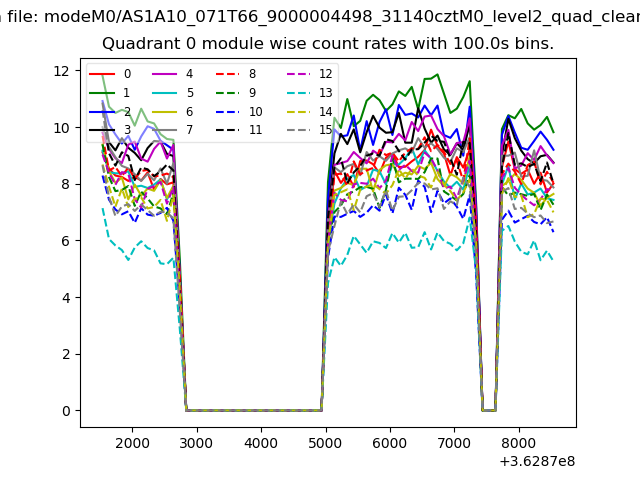
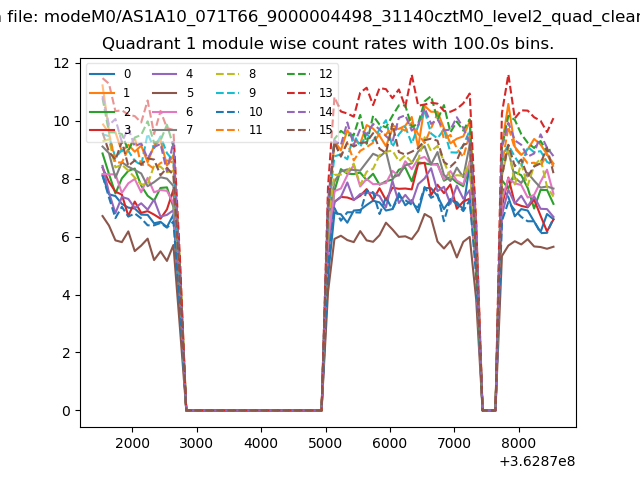
| Module-wise count rates for Quadrant A Data is divided into 100 sec bins |
 |
 |
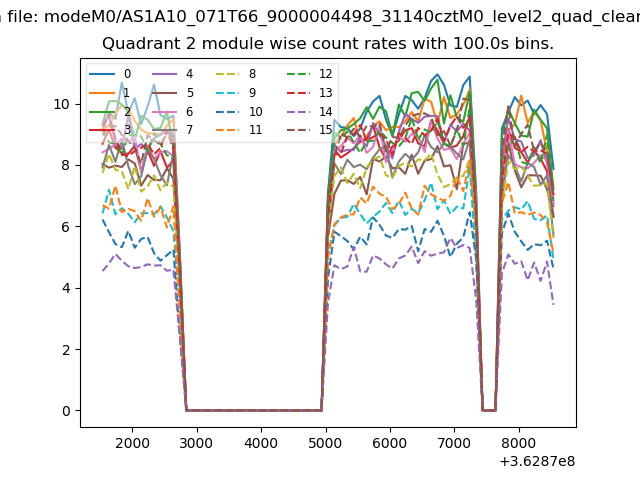
| Module-wise count rates for Quadrant B Data is divided into 100 sec bins |
 |
 |
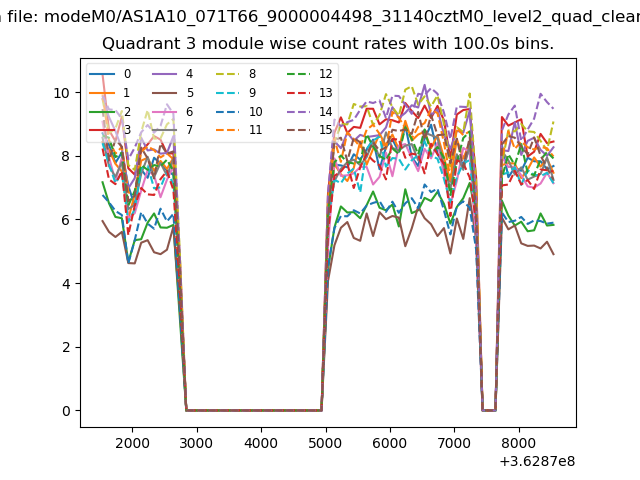
| Module-wise count rates for Quadrant C Data is divided into 100 sec bins |
 |
 |
| Module-wise count rates for Quadrant D Data is divided into 100 sec bins |
 |
 |
| Parameter | Plot |
|---|---|
| CZT HV Monitor | 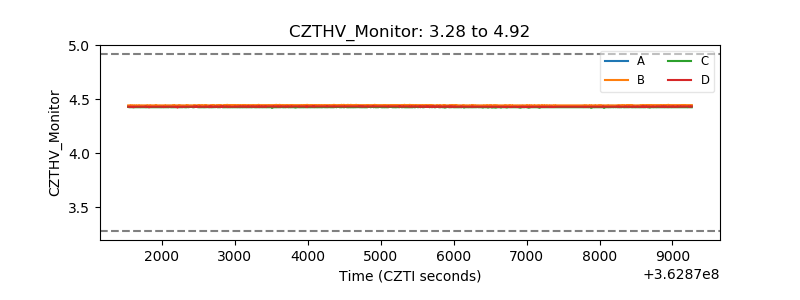 |
| D_VDD | 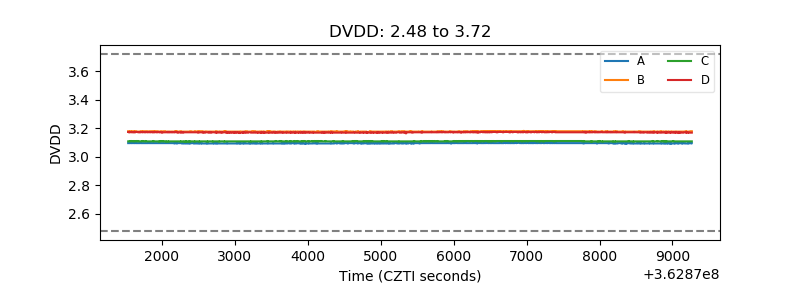 |
| Temperature 1 | 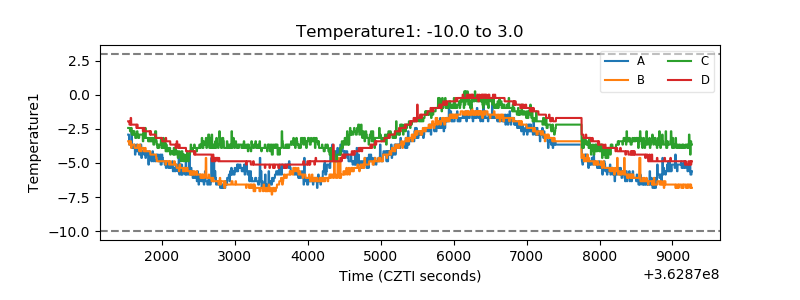 |
| Veto HV Monitor | 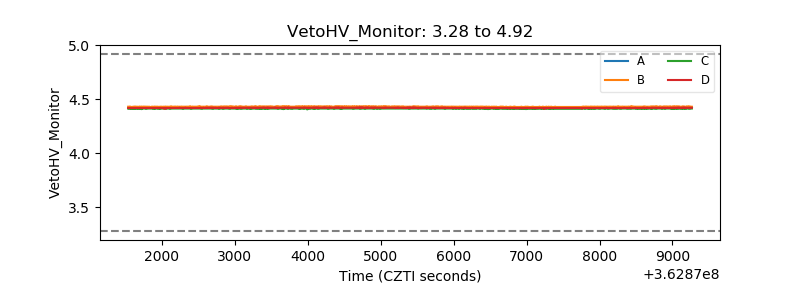 |
| Veto LLD | 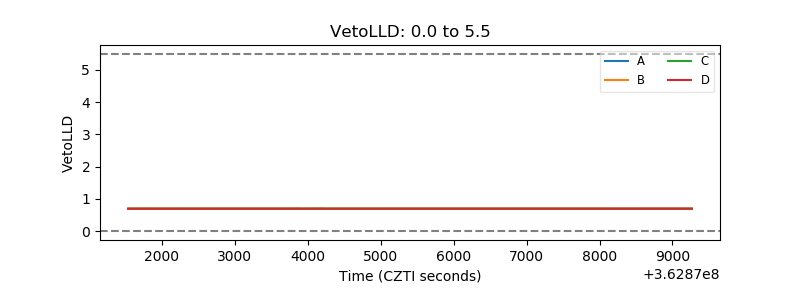 |
| Alpha Counter | 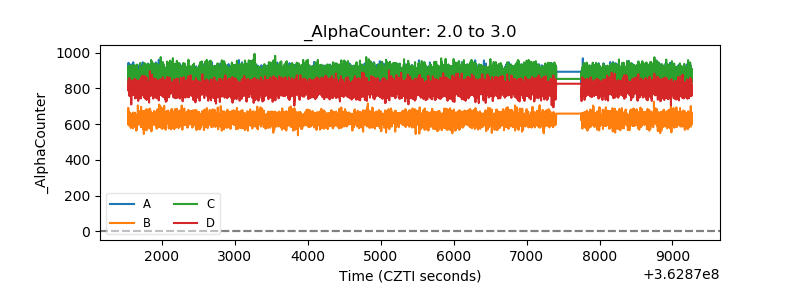 |
| _CPM_Rate | 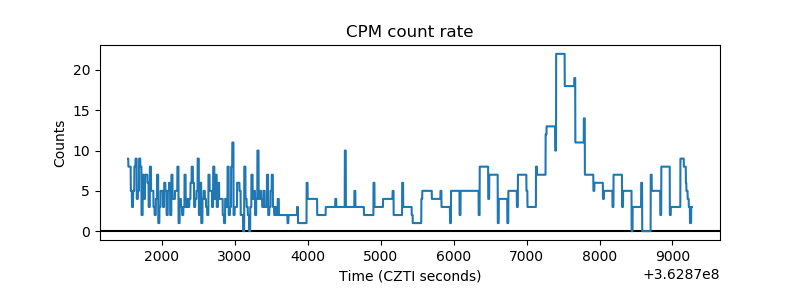 |
| CZT Counter | 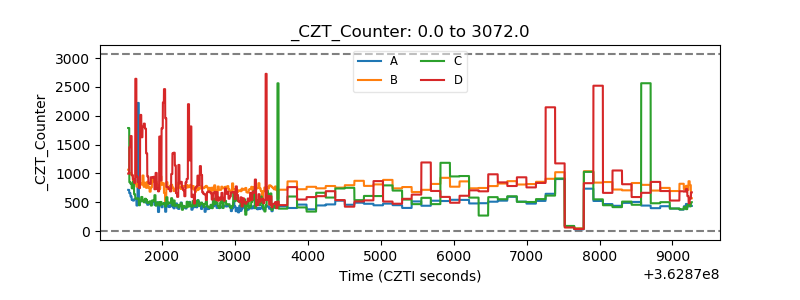 |
| +2.5 Volts monitor | 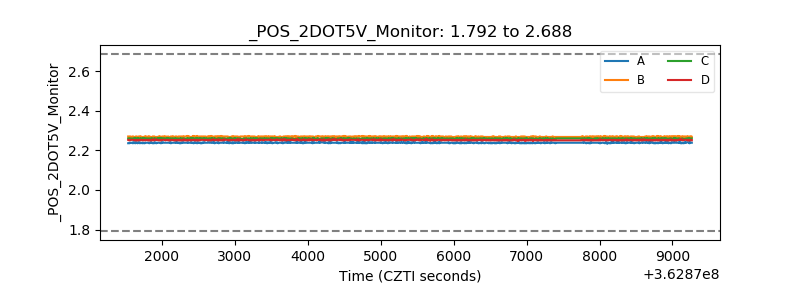 |
| +5 Volts monitor |  |
| _ROLL_ROT | 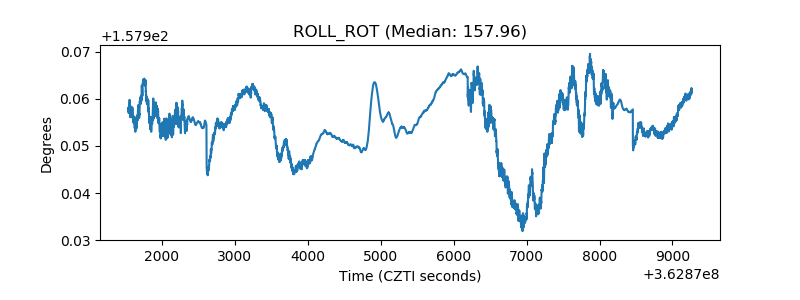 |
| _Roll_DEC | 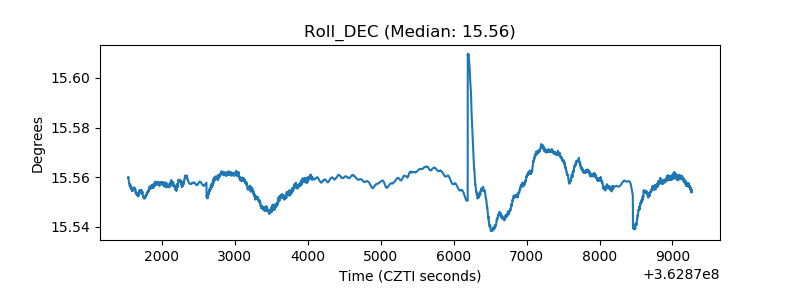 |
| _Roll_RA | 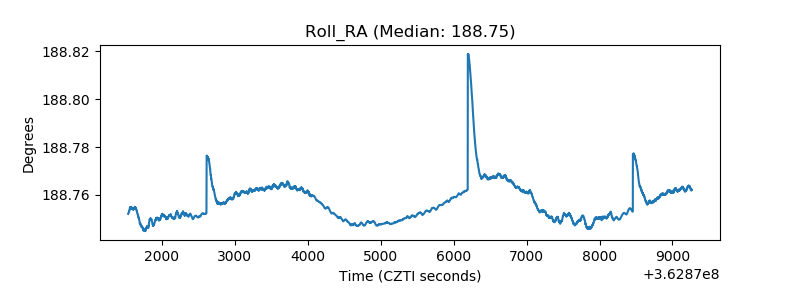 |
| Veto Counter | 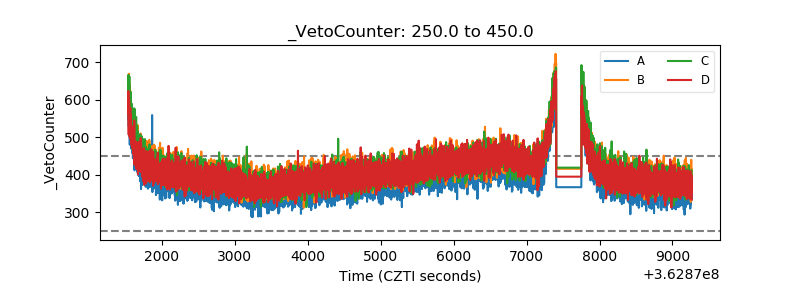 |