| Param | Original file | Final file |
|---|---|---|
| Filename | modeM0/AS1A10_071T66_9000004498_31141cztM0_level2.evt | modeM0/AS1A10_071T66_9000004498_31141cztM0_level2_quad_clean.evt |
| Size (bytes) | 724,907,520 | 99,213,120 |
| Size | 691.3 MB | 94.6 MB |
| Events in quadrant A | 3,928,515 | 630,453 |
| Events in quadrant B | 6,469,191 | 623,246 |
| Events in quadrant C | 4,298,545 | 602,162 |
| Events in quadrant D | 6,709,915 | 584,950 |
| Mode M0 | |||
|---|---|---|---|
| Quadrant | BADHDUFLAG | Total packets | Discarded packets |
| A | 0 | 16940 | 2 |
| B | 0 | 25185 | 2 |
| C | 0 | 17845 | 2 |
| D | 0 | 25686 | 2 |
| Mode M9 | |||
|---|---|---|---|
| Quadrant | BADHDUFLAG | Total packets | Discarded packets |
| A | 0 | 6 | 0 |
| B | 0 | 6 | 0 |
| C | 0 | 6 | 0 |
| D | 0 | 6 | 0 |
| Mode SS | |||
|---|---|---|---|
| Quadrant | BADHDUFLAG | Total packets | Discarded packets |
| A | 0 | 166 | 0 |
| B | 0 | 166 | 0 |
| C | 0 | 166 | 0 |
| D | 0 | 166 | 0 |
| Quadrant | Total seconds | Saturated seconds | Saturation percentage |
|---|---|---|---|
| A | 8106 | 142 | 1.751789% |
| B | 8107 | 314 | 3.873196% |
| C | 8107 | 267 | 3.293450% |
| D | 8107 | 276 | 3.404465% |
Noise dominated data is calculated using 1-second bins in cleaned event files. If a bin has >2000 counts, and if more than 50% of those come from <1% of pixels, then it is considered to be noise-dominated and hence unusable.
| Quadrant | # 1 sec bins | Bins with >0 counts | Bins with >2000 counts | High rate bins dominated by noise | Noise dominated (total time) | Noise dominated (detector-on time) | Marked lightcurve |
|---|---|---|---|---|---|---|---|
| A | 8706 | 8108 | 3 | 3 | 0.03% | 0.04% | 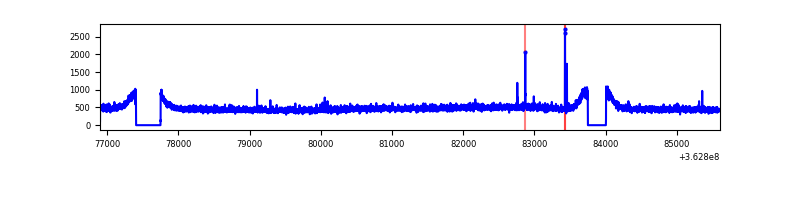 |
| B | 8707 | 8109 | 14 | 14 | 0.16% | 0.17% | 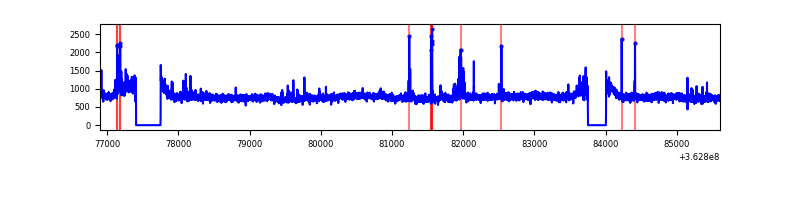 |
| C | 8707 | 8109 | 65 | 65 | 0.75% | 0.80% | 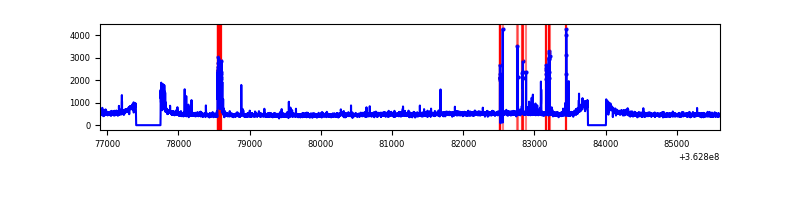 |
| D | 8707 | 8109 | 97 | 97 | 1.11% | 1.20% | 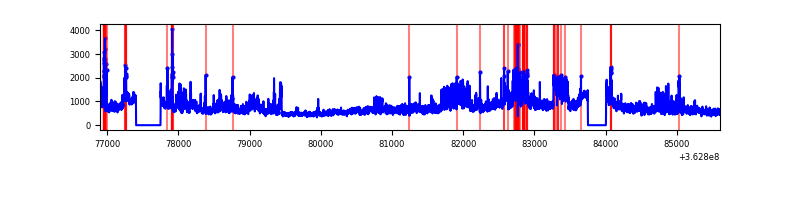 |
Top three noisy pixels from each quadrant. If the there are fewer than three noisy pixels in the level2.evt file, extra rows are filled as -1
| Pixel properties | Quadrant properties | ||||||
|---|---|---|---|---|---|---|---|
| Quadrant | DetID | PixID | Counts | Sigma | Mean | Median | Sigma |
| A | 13 | 254 | 16242 | 74.25 | 1012 | 987 | 205.4 |
| A | 3 | 137 | 10538 | 46.49 | 1012 | 987 | 205.4 |
| A | 11 | 29 | 9853 | 43.16 | 1012 | 987 | 205.4 |
| B | 6 | 159 | 2297023 | 11732.71 | 1000 | 973 | 195.7 |
| B | 0 | 190 | 127040 | 644.2 | 1000 | 973 | 195.7 |
| B | 0 | 230 | 31716 | 157.1 | 1000 | 973 | 195.7 |
| C | 0 | 10 | 171308 | 741.14 | 969 | 975 | 229.8 |
| C | 14 | 238 | 151433 | 654.66 | 969 | 975 | 229.8 |
| C | 3 | 233 | 128303 | 554.02 | 969 | 975 | 229.8 |
| D | 8 | 195 | 2784190 | 11001.04 | 967 | 943 | 253.0 |
| D | 13 | 249 | 160611 | 631.1 | 967 | 943 | 253.0 |
| D | 2 | 250 | 35784 | 137.71 | 967 | 943 | 253.0 |
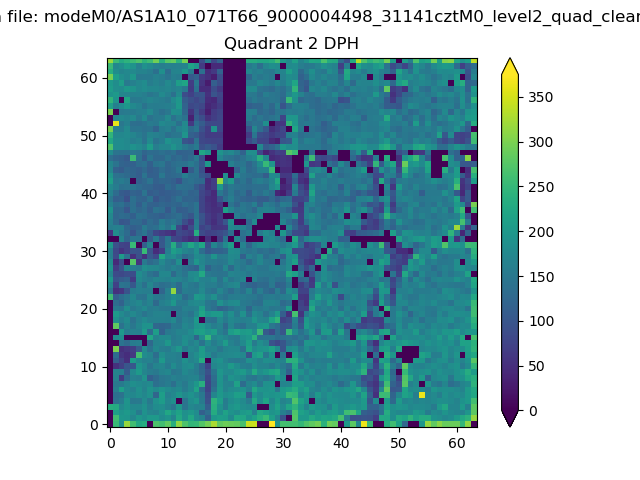
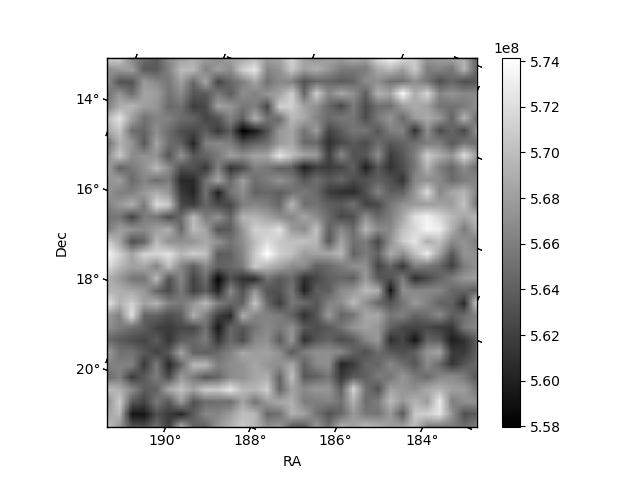
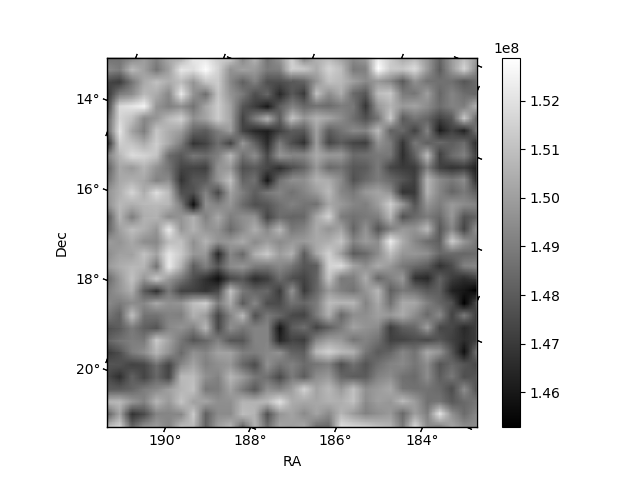
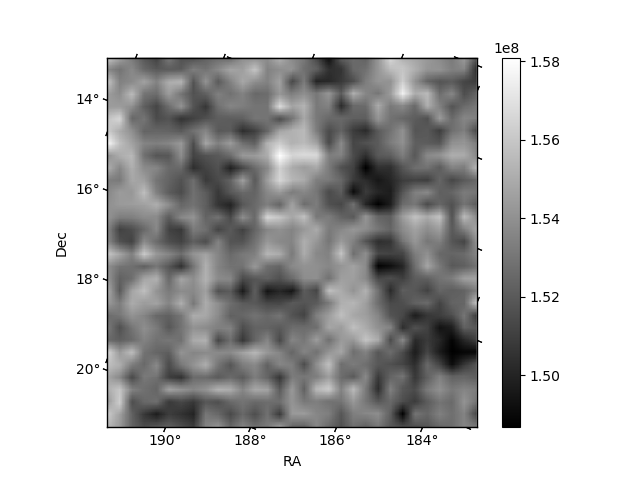
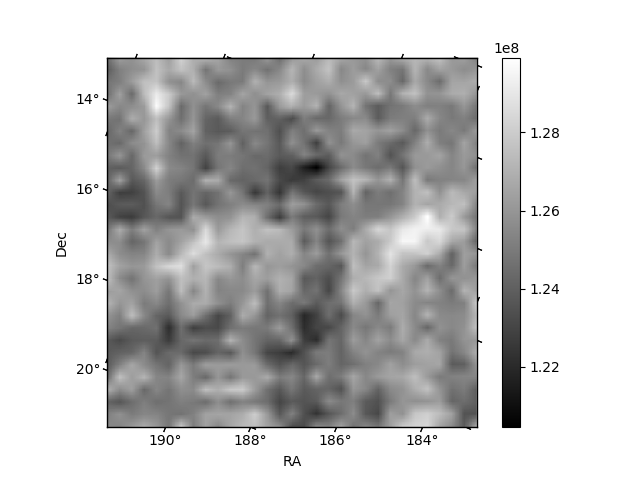
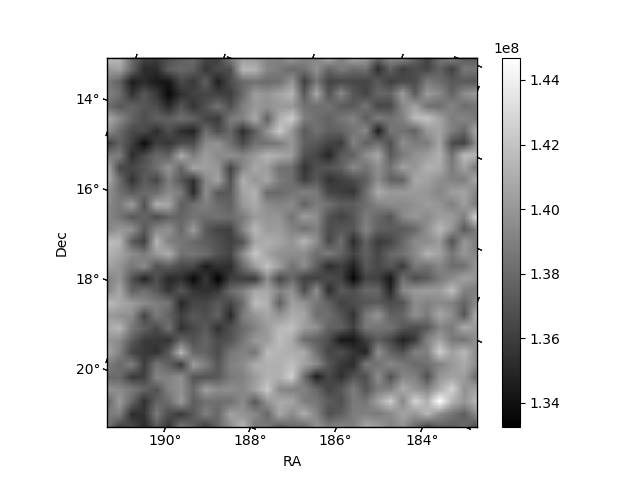
Histogram calculated using DETX and DETY for each event in the final _common_clean file
| Quadrant A | 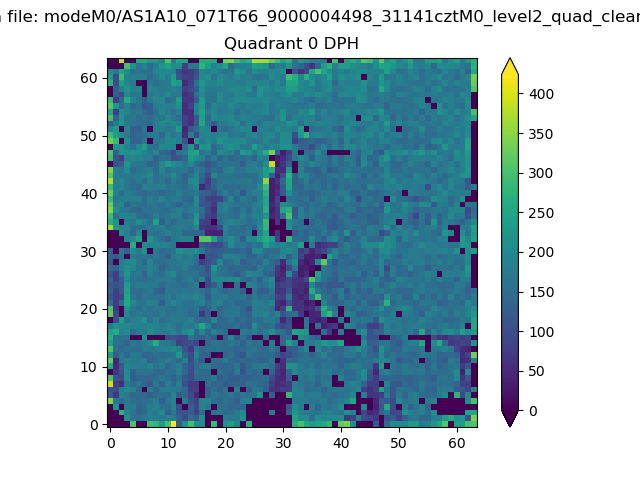 |
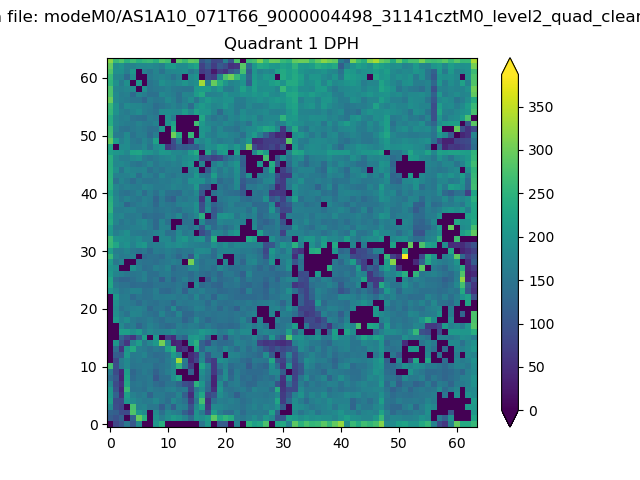 |
Quadrant B |
|---|---|---|---|
| Quadrant D | 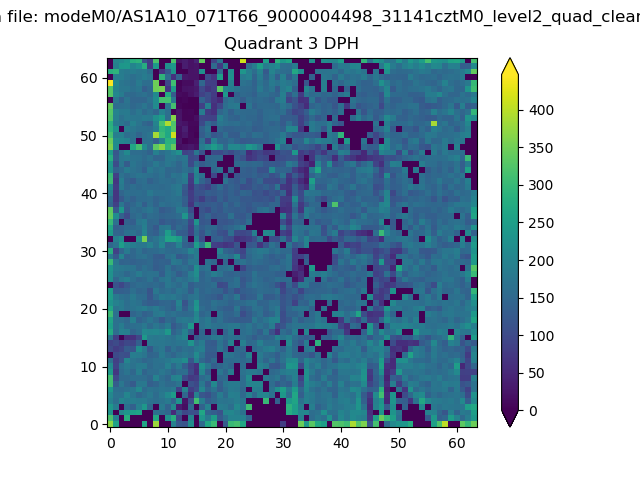 |
 |
Quadrant C |
| Plot type | Count rate plots | Images |
|---|---|---|
| Comparison with Poisson distribution Blue bars denote a histogram of data divided into 1 sec bins. Red curve is a Poisson curve with rate = median count rate of data. |
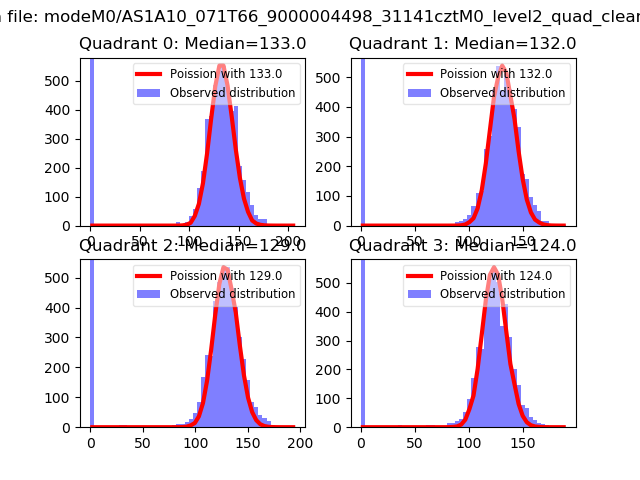 |
 |
| Quadrant-wise count rates Data is divided into 100 sec bins |
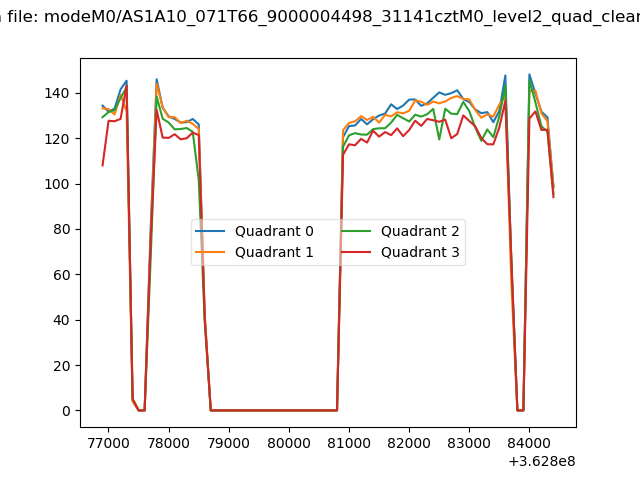 |
|
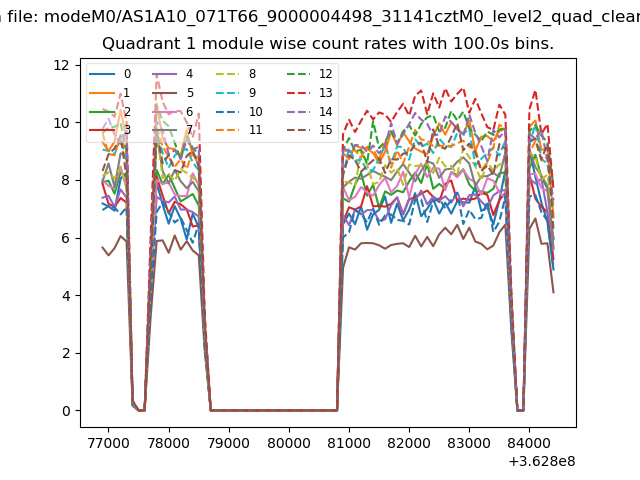
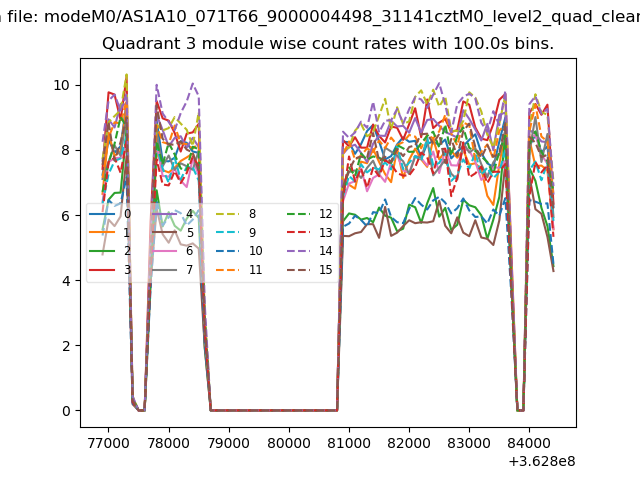
| Module-wise count rates for Quadrant A Data is divided into 100 sec bins |
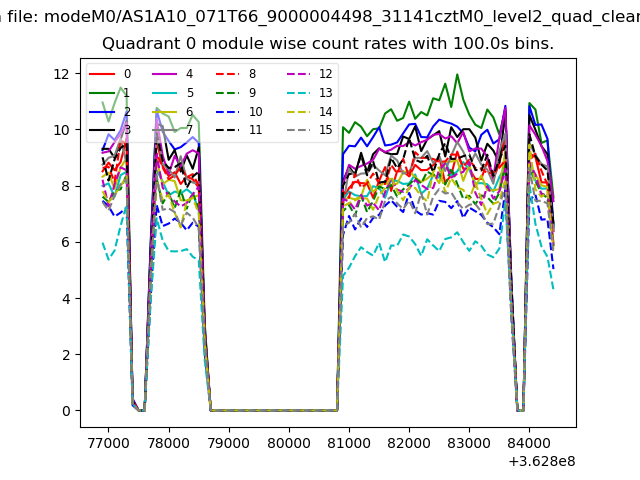 |
 |
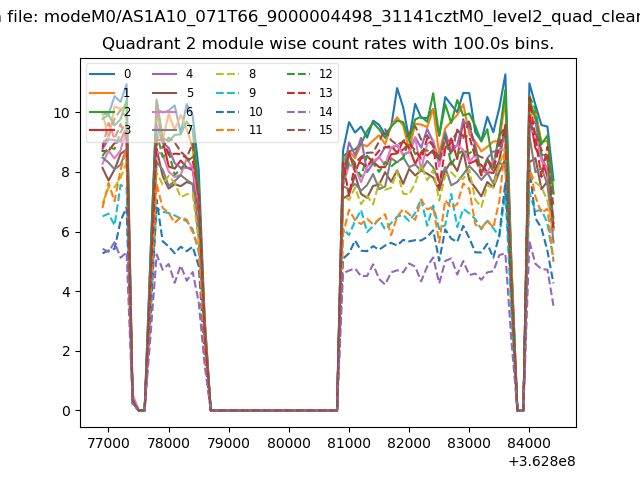
| Module-wise count rates for Quadrant B Data is divided into 100 sec bins |
 |
 |
| Module-wise count rates for Quadrant C Data is divided into 100 sec bins |
 |
 |
| Module-wise count rates for Quadrant D Data is divided into 100 sec bins |
 |
 |
| Parameter | Plot |
|---|---|
| CZT HV Monitor | 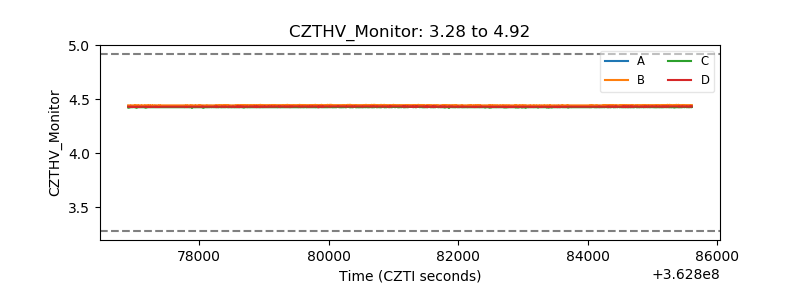 |
| D_VDD | 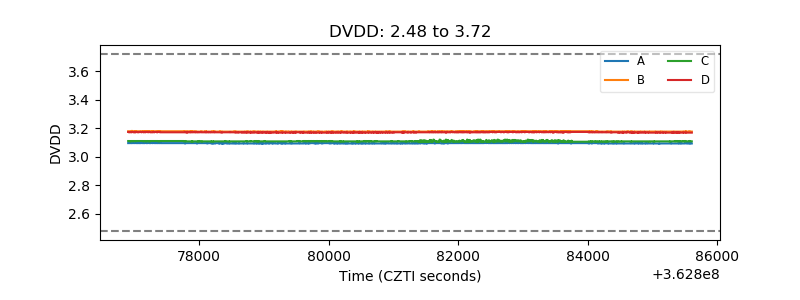 |
| Temperature 1 | 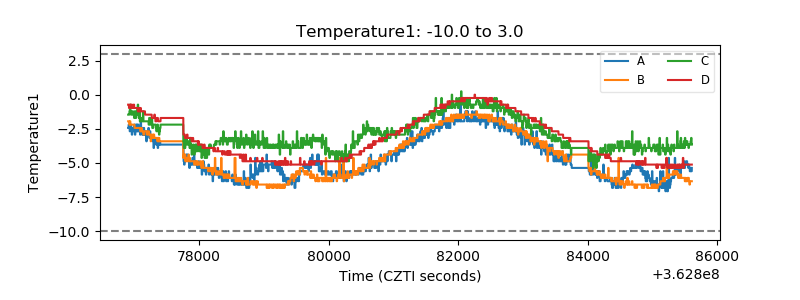 |
| Veto HV Monitor | 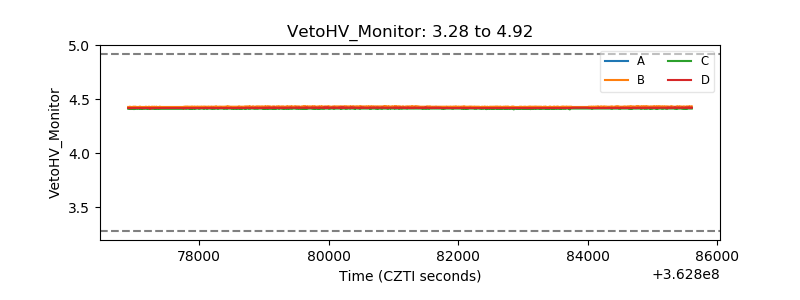 |
| Veto LLD | 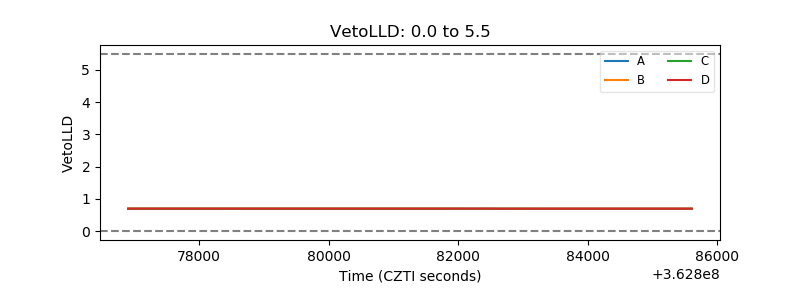 |
| Alpha Counter | 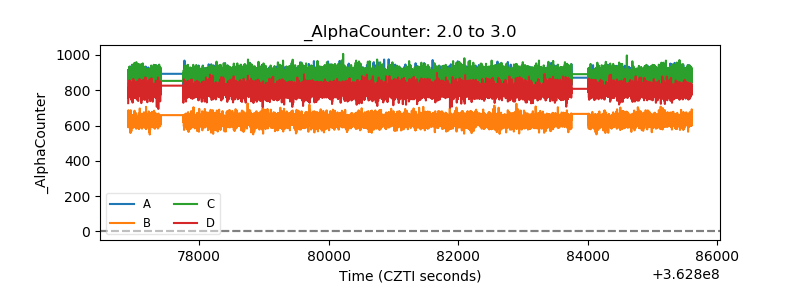 |
| _CPM_Rate | 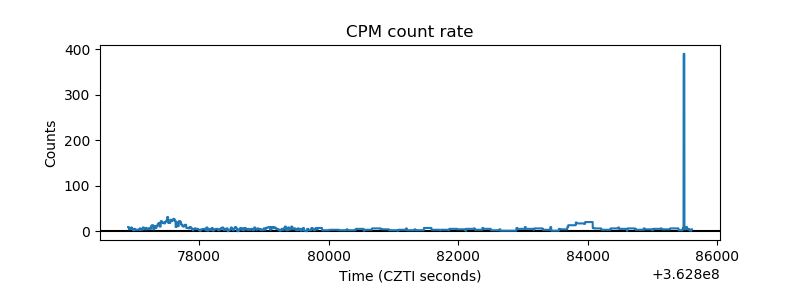 |
| CZT Counter | 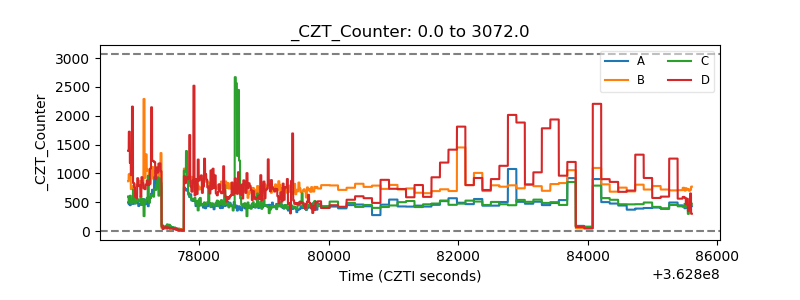 |
| +2.5 Volts monitor |  |
| +5 Volts monitor |  |
| _ROLL_ROT | 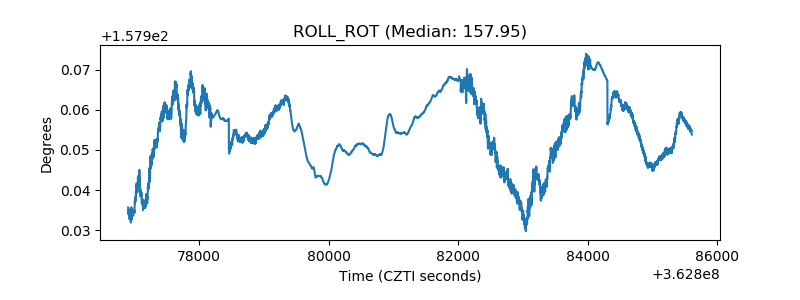 |
| _Roll_DEC | 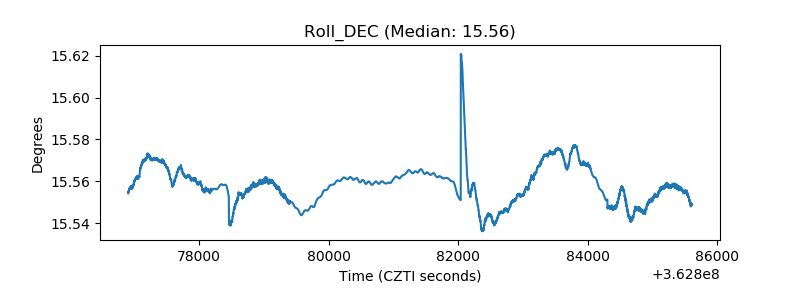 |
| _Roll_RA | 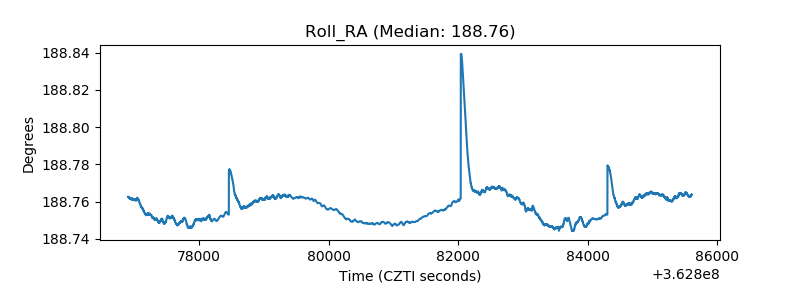 |
| Veto Counter | 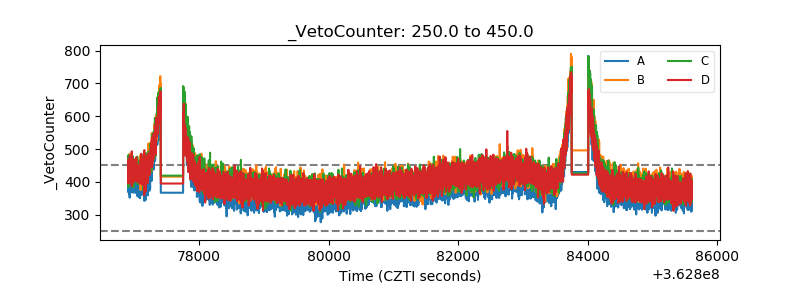 |