| Param | Original file | Final file |
|---|---|---|
| Filename | modeM0/AS1A10_071T66_9000004498_31144cztM0_level2.evt | modeM0/AS1A10_071T66_9000004498_31144cztM0_level2_quad_clean.evt |
| Size (bytes) | 1,605,585,600 | 215,798,400 |
| Size | 1.5 GB | 205.8 MB |
| Events in quadrant A | 8,326,027 | 1,386,633 |
| Events in quadrant B | 13,665,936 | 1,374,022 |
| Events in quadrant C | 8,943,338 | 1,335,614 |
| Events in quadrant D | 16,514,938 | 1,235,034 |
| Mode M0 | |||
|---|---|---|---|
| Quadrant | BADHDUFLAG | Total packets | Discarded packets |
| A | 0 | 35865 | 4 |
| B | 0 | 53344 | 4 |
| C | 0 | 37327 | 4 |
| D | 0 | 61607 | 4 |
| Mode M9 | |||
|---|---|---|---|
| Quadrant | BADHDUFLAG | Total packets | Discarded packets |
| A | 0 | 19 | 0 |
| B | 0 | 20 | 0 |
| C | 0 | 20 | 0 |
| D | 0 | 20 | 0 |
| Mode SS | |||
|---|---|---|---|
| Quadrant | BADHDUFLAG | Total packets | Discarded packets |
| A | 0 | 356 | 0 |
| B | 0 | 356 | 0 |
| C | 0 | 356 | 0 |
| D | 0 | 356 | 0 |
| Quadrant | Total seconds | Saturated seconds | Saturation percentage |
|---|---|---|---|
| A | 17470 | 208 | 1.190612% |
| B | 17469 | 385 | 2.203904% |
| C | 17469 | 360 | 2.060793% |
| D | 17469 | 1326 | 7.590589% |
Noise dominated data is calculated using 1-second bins in cleaned event files. If a bin has >2000 counts, and if more than 50% of those come from <1% of pixels, then it is considered to be noise-dominated and hence unusable.
| Quadrant | # 1 sec bins | Bins with >0 counts | Bins with >2000 counts | High rate bins dominated by noise | Noise dominated (total time) | Noise dominated (detector-on time) | Marked lightcurve |
|---|---|---|---|---|---|---|---|
| A | 19230 | 17473 | 2 | 2 | 0.01% | 0.01% | 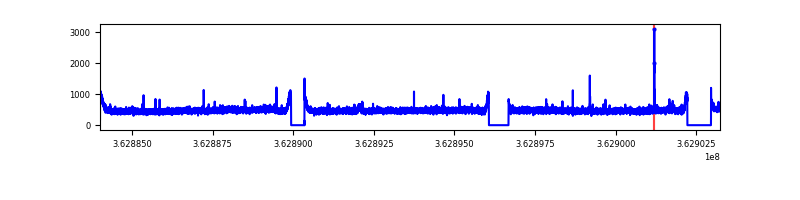 |
| B | 19229 | 17472 | 11 | 11 | 0.06% | 0.06% | 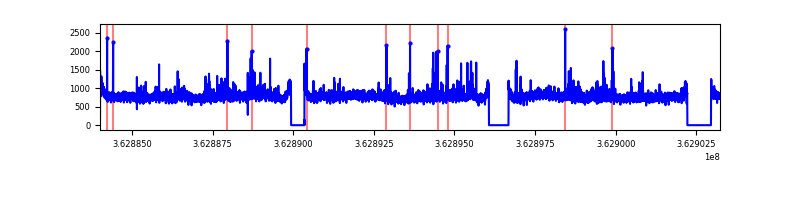 |
| C | 19229 | 17471 | 33 | 33 | 0.17% | 0.19% | 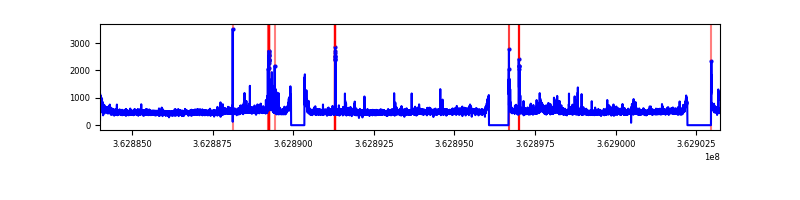 |
| D | 19229 | 17472 | 943 | 943 | 4.90% | 5.40% | 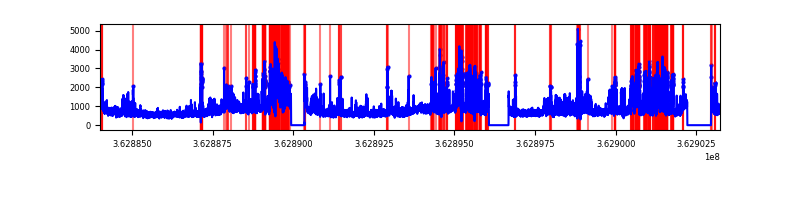 |
Top three noisy pixels from each quadrant. If the there are fewer than three noisy pixels in the level2.evt file, extra rows are filled as -1
| Pixel properties | Quadrant properties | ||||||
|---|---|---|---|---|---|---|---|
| Quadrant | DetID | PixID | Counts | Sigma | Mean | Median | Sigma |
| A | 13 | 254 | 33495 | 73.2 | 2141 | 2094 | 429.0 |
| A | 11 | 47 | 28658 | 61.93 | 2141 | 2094 | 429.0 |
| A | 12 | 96 | 23877 | 50.78 | 2141 | 2094 | 429.0 |
| B | 6 | 159 | 4821746 | 11768.5 | 2110 | 2051 | 409.5 |
| B | 0 | 183 | 219809 | 531.71 | 2110 | 2051 | 409.5 |
| B | 0 | 190 | 150509 | 362.5 | 2110 | 2051 | 409.5 |
| C | 14 | 238 | 325986 | 670.68 | 2046 | 2055 | 483.0 |
| C | 0 | 10 | 239568 | 491.76 | 2046 | 2055 | 483.0 |
| C | 3 | 233 | 193678 | 396.74 | 2046 | 2055 | 483.0 |
| D | 8 | 195 | 5948550 | 11783.77 | 2003 | 1957 | 504.6 |
| D | 13 | 174 | 1417960 | 2805.95 | 2003 | 1957 | 504.6 |
| D | 2 | 250 | 870575 | 1721.25 | 2003 | 1957 | 504.6 |
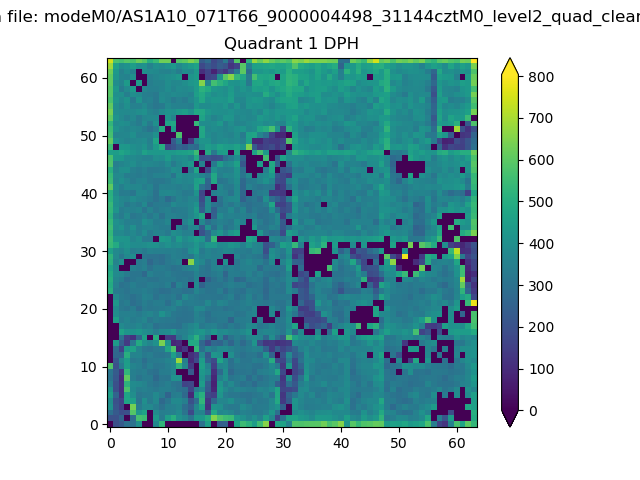
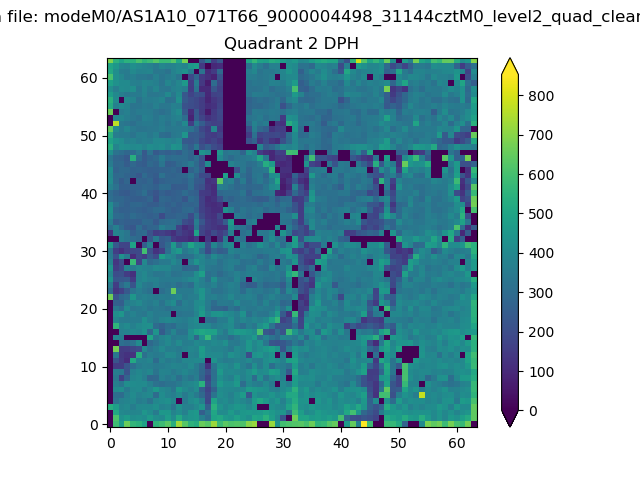
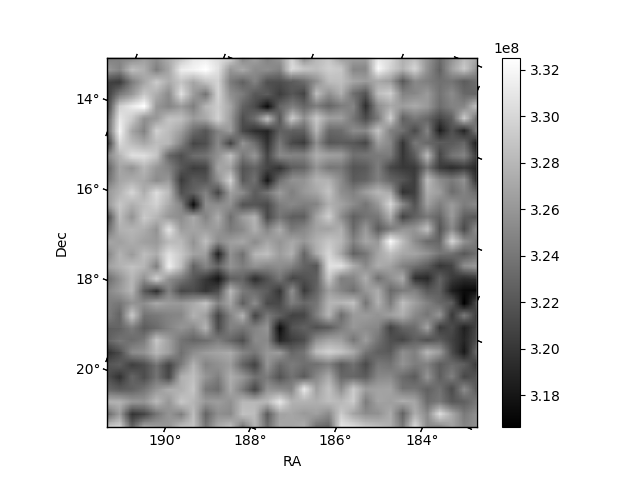
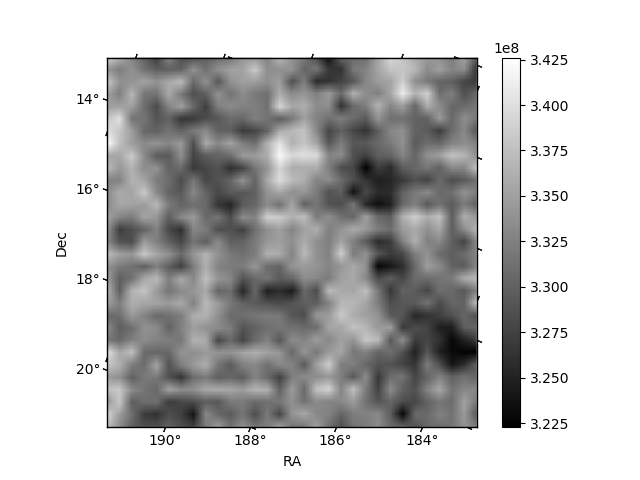
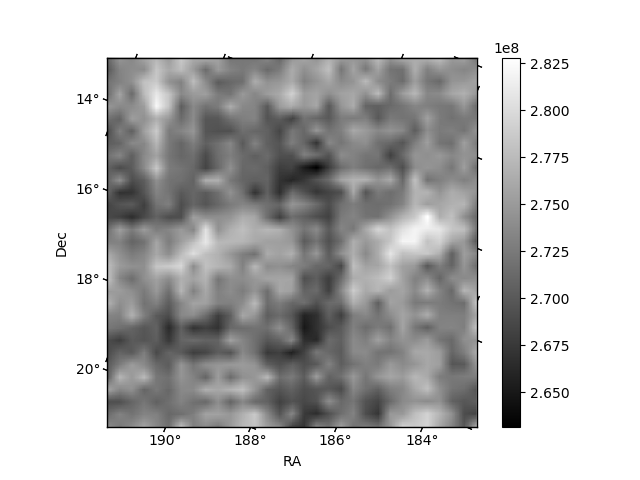
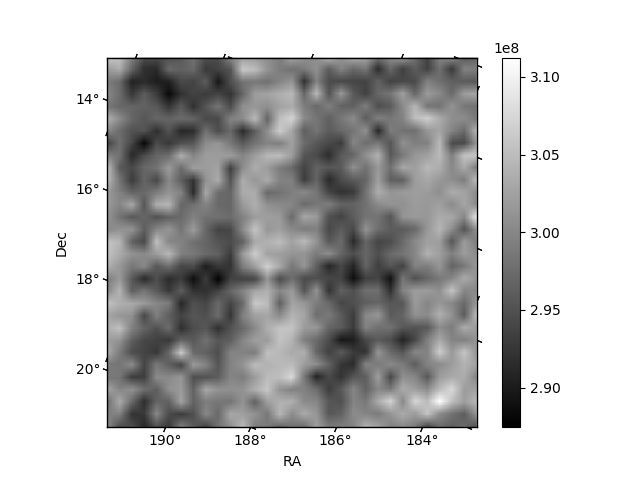
Histogram calculated using DETX and DETY for each event in the final _common_clean file
| Quadrant A |  |
 |
Quadrant B |
|---|---|---|---|
| Quadrant D |  |
 |
Quadrant C |
| Plot type | Count rate plots | Images |
|---|---|---|
| Comparison with Poisson distribution Blue bars denote a histogram of data divided into 1 sec bins. Red curve is a Poisson curve with rate = median count rate of data. |
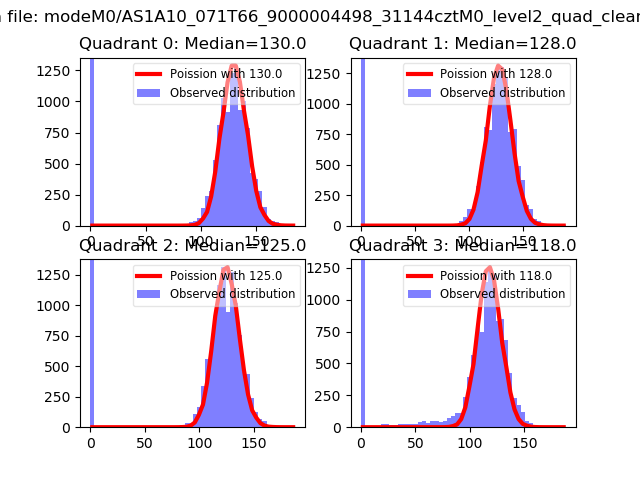 |
 |
| Quadrant-wise count rates Data is divided into 100 sec bins |
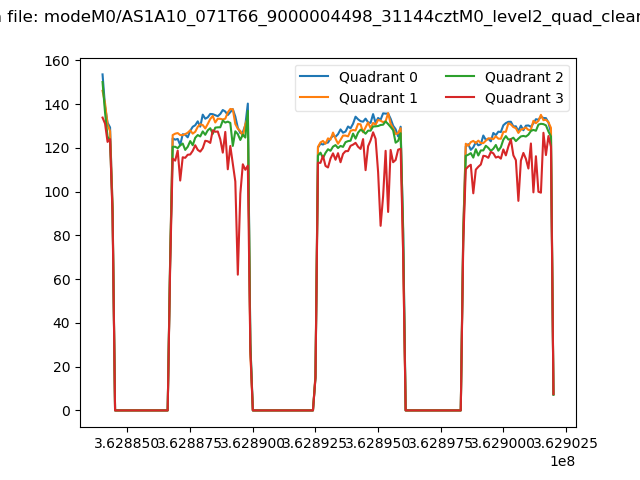 |
|
| Module-wise count rates for Quadrant A Data is divided into 100 sec bins |
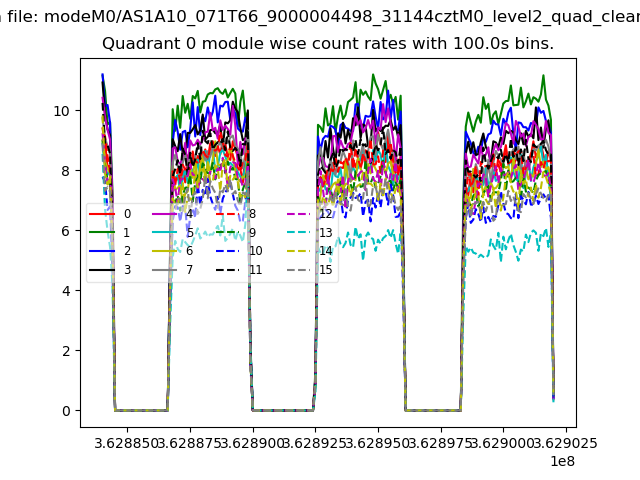 |
 |
| Module-wise count rates for Quadrant B Data is divided into 100 sec bins |
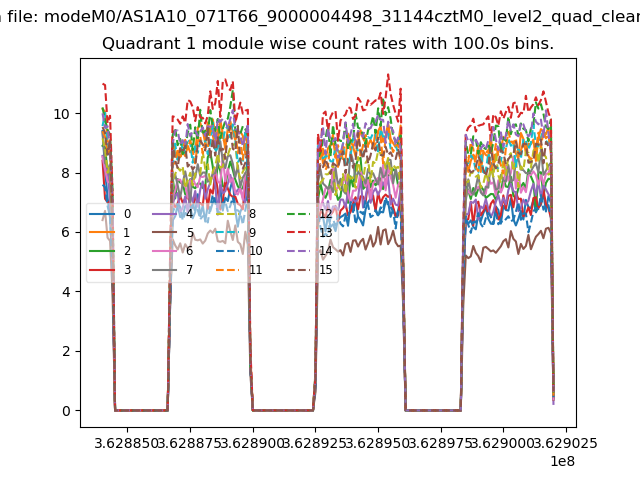 |
 |
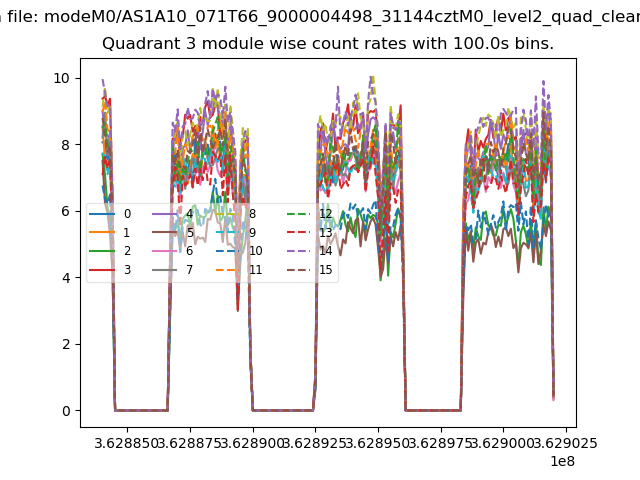
| Module-wise count rates for Quadrant C Data is divided into 100 sec bins |
 |
 |
| Module-wise count rates for Quadrant D Data is divided into 100 sec bins |
 |
 |
| Parameter | Plot |
|---|---|
| CZT HV Monitor | 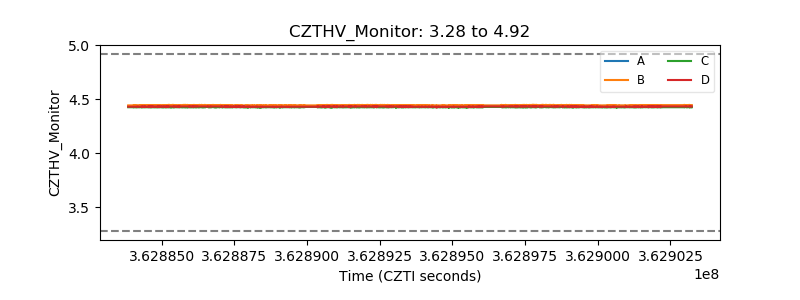 |
| D_VDD | 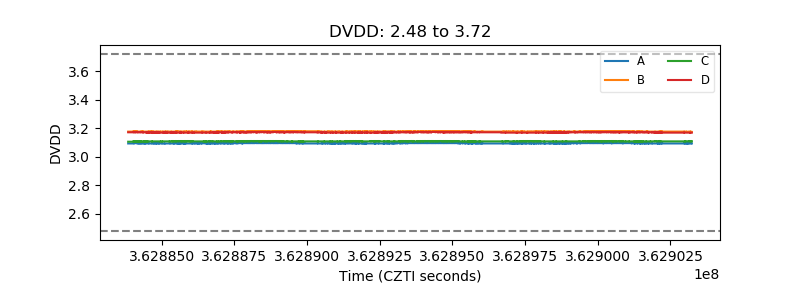 |
| Temperature 1 | 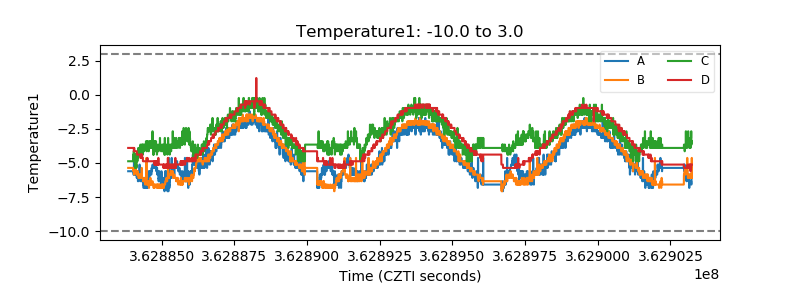 |
| Veto HV Monitor | 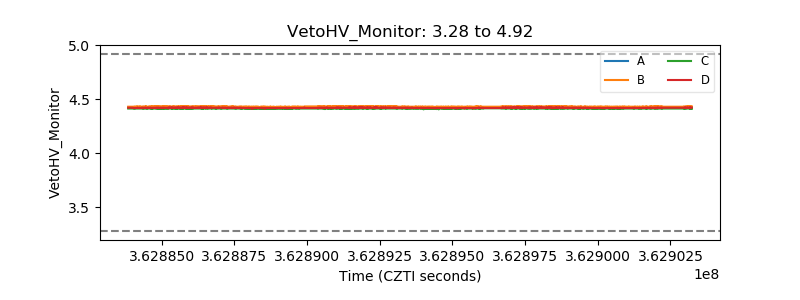 |
| Veto LLD | 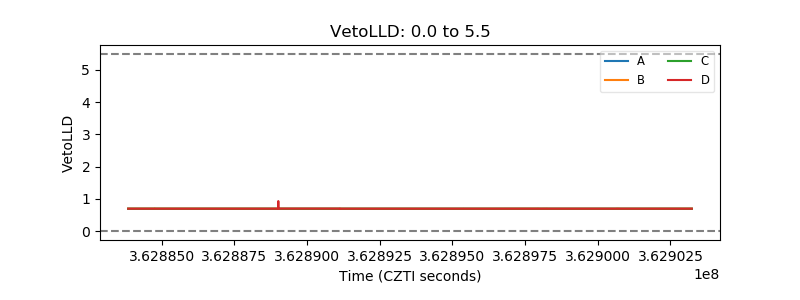 |
| Alpha Counter | 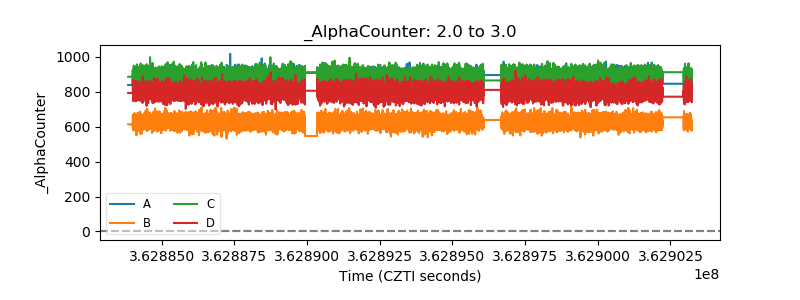 |
| _CPM_Rate | 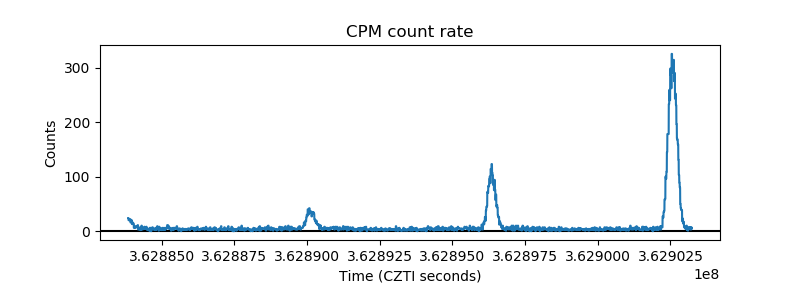 |
| CZT Counter | 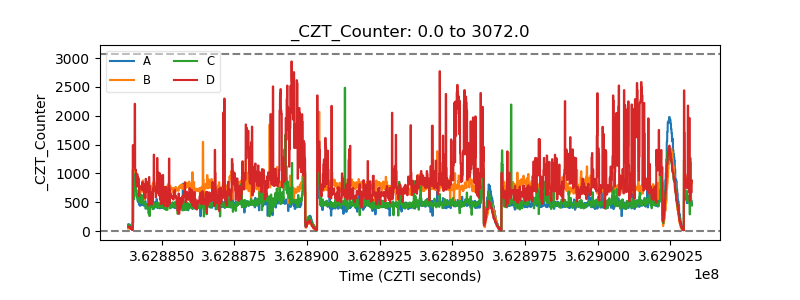 |
| +2.5 Volts monitor |  |
| +5 Volts monitor |  |
| _ROLL_ROT | 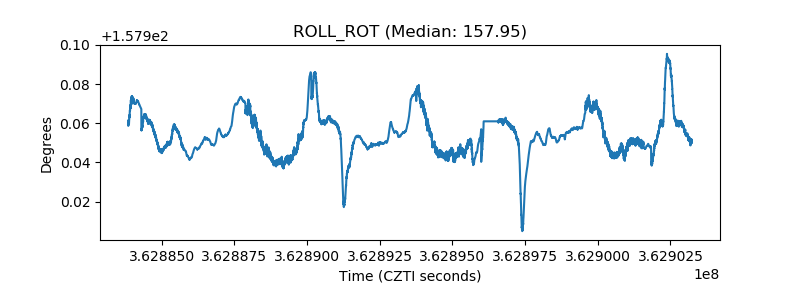 |
| _Roll_DEC | 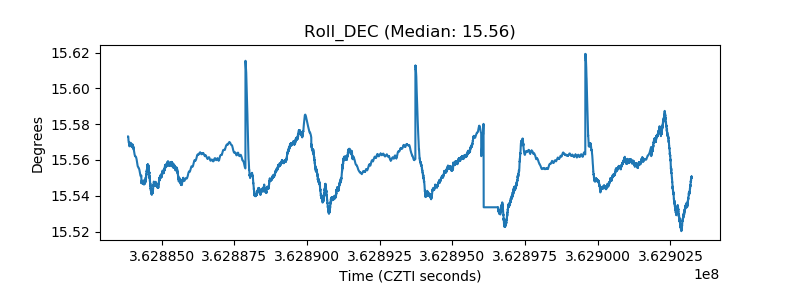 |
| _Roll_RA | 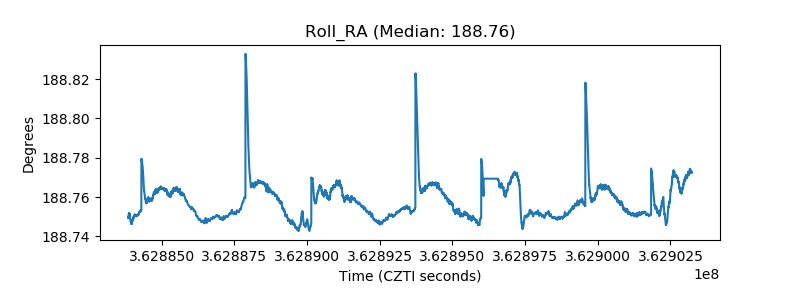 |
| Veto Counter | 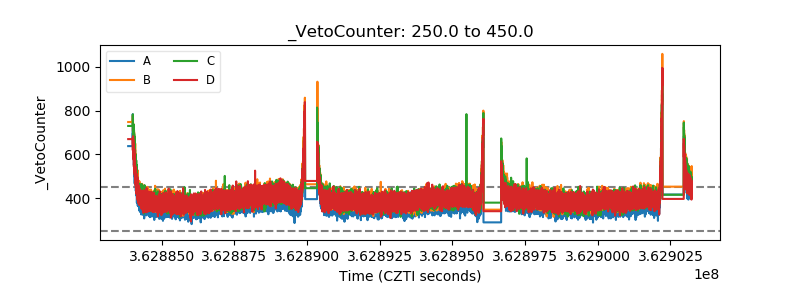 |