| Param | Original file | Final file |
|---|---|---|
| Filename | modeM0/AS1T04_018T01_9000004494_31127cztM0_level2.evt | modeM0/AS1T04_018T01_9000004494_31127cztM0_level2_quad_clean.evt |
| Size (bytes) | 505,045,440 | 85,311,360 |
| Size | 481.6 MB | 81.4 MB |
| Events in quadrant A | 3,024,199 | 546,148 |
| Events in quadrant B | 5,084,816 | 537,097 |
| Events in quadrant C | 3,216,138 | 524,971 |
| Events in quadrant D | 3,526,698 | 519,321 |
| Mode M0 | |||
|---|---|---|---|
| Quadrant | BADHDUFLAG | Total packets | Discarded packets |
| A | 0 | 13314 | 1 |
| B | 0 | 20019 | 1 |
| C | 0 | 13683 | 1 |
| D | 0 | 14938 | 1 |
| Mode M9 | |||
|---|---|---|---|
| Quadrant | BADHDUFLAG | Total packets | Discarded packets |
| A | 0 | 4 | 0 |
| B | 0 | 4 | 0 |
| C | 0 | 4 | 0 |
| D | 0 | 4 | 0 |
| Mode SS | |||
|---|---|---|---|
| Quadrant | BADHDUFLAG | Total packets | Discarded packets |
| A | 0 | 132 | 0 |
| B | 0 | 132 | 0 |
| C | 0 | 132 | 0 |
| D | 0 | 132 | 0 |
| Quadrant | Total seconds | Saturated seconds | Saturation percentage |
|---|---|---|---|
| A | 6539 | 38 | 0.581129% |
| B | 6539 | 121 | 1.850436% |
| C | 6539 | 131 | 2.003364% |
| D | 6539 | 76 | 1.162257% |
Noise dominated data is calculated using 1-second bins in cleaned event files. If a bin has >2000 counts, and if more than 50% of those come from <1% of pixels, then it is considered to be noise-dominated and hence unusable.
| Quadrant | # 1 sec bins | Bins with >0 counts | Bins with >2000 counts | High rate bins dominated by noise | Noise dominated (total time) | Noise dominated (detector-on time) | Marked lightcurve |
|---|---|---|---|---|---|---|---|
| A | 6899 | 6540 | 0 | 0 | 0.00% | 0.00% | 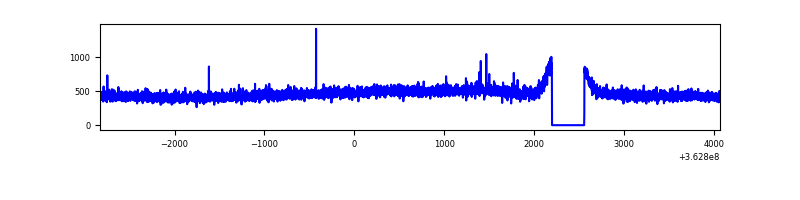 |
| B | 6899 | 6540 | 7 | 7 | 0.10% | 0.11% | 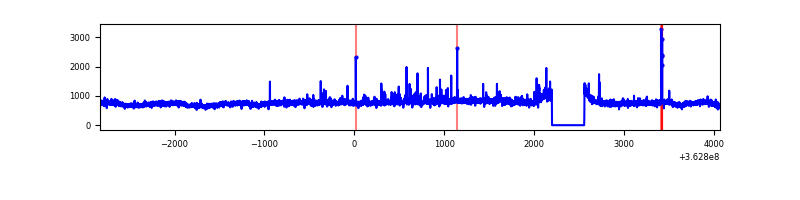 |
| C | 6899 | 6540 | 14 | 14 | 0.20% | 0.21% | 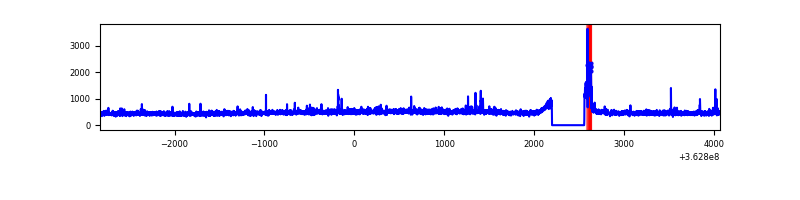 |
| D | 6899 | 6540 | 29 | 29 | 0.42% | 0.44% | 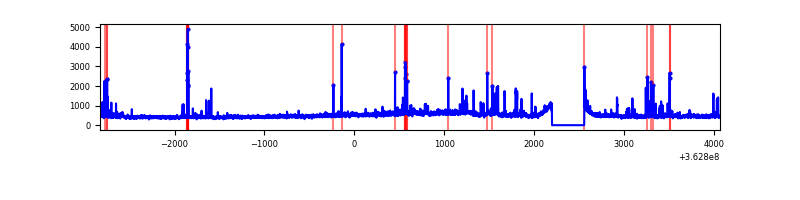 |
Top three noisy pixels from each quadrant. If the there are fewer than three noisy pixels in the level2.evt file, extra rows are filled as -1
| Pixel properties | Quadrant properties | ||||||
|---|---|---|---|---|---|---|---|
| Quadrant | DetID | PixID | Counts | Sigma | Mean | Median | Sigma |
| A | 13 | 254 | 11061 | 65.52 | 782 | 767 | 157.1 |
| A | 3 | 137 | 7949 | 45.71 | 782 | 767 | 157.1 |
| A | 0 | 226 | 6510 | 36.55 | 782 | 767 | 157.1 |
| B | 6 | 159 | 1866888 | 12560.14 | 773 | 753 | 148.6 |
| B | 0 | 183 | 72124 | 480.37 | 773 | 753 | 148.6 |
| B | 0 | 230 | 33390 | 219.67 | 773 | 753 | 148.6 |
| C | 14 | 238 | 121595 | 681.81 | 749 | 751 | 177.2 |
| C | 0 | 10 | 93929 | 525.72 | 749 | 751 | 177.2 |
| C | 15 | 208 | 51690 | 287.4 | 749 | 751 | 177.2 |
| D | 8 | 195 | 422629 | 2352.74 | 753 | 731 | 179.3 |
| D | 2 | 250 | 122972 | 681.69 | 753 | 731 | 179.3 |
| D | 13 | 174 | 55839 | 307.31 | 753 | 731 | 179.3 |
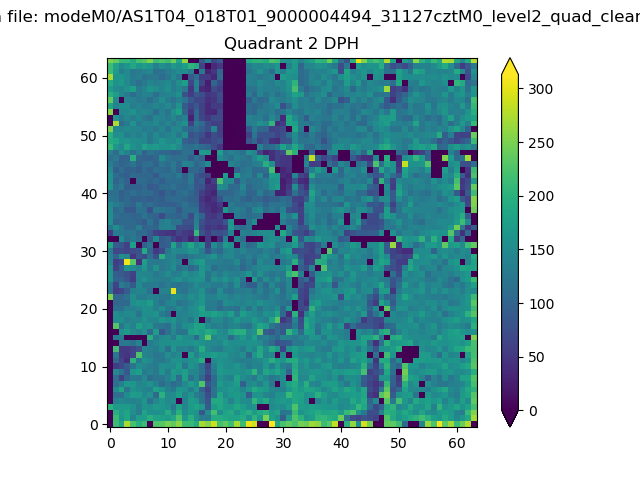
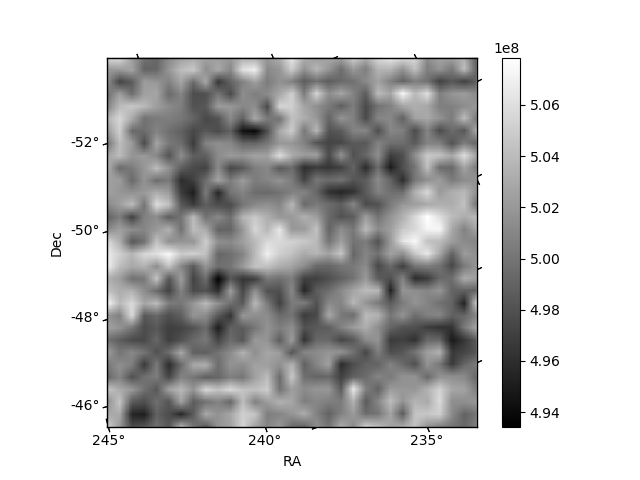
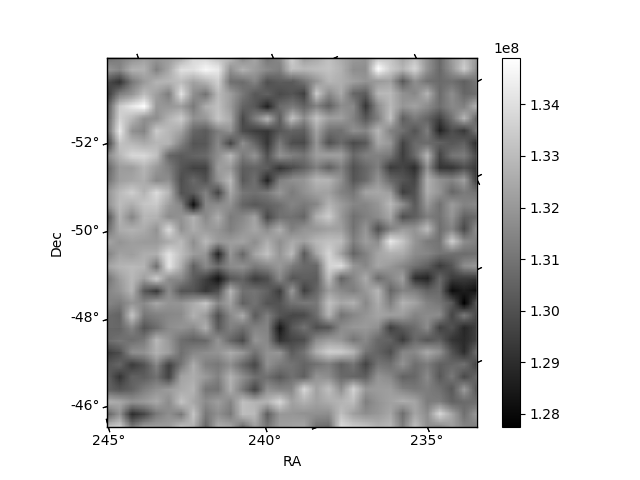
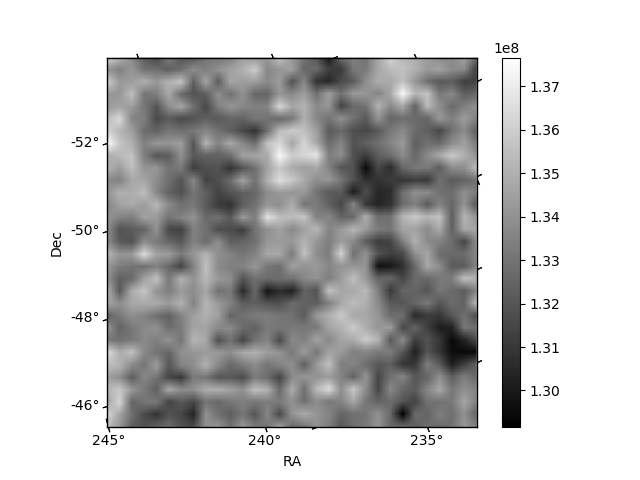
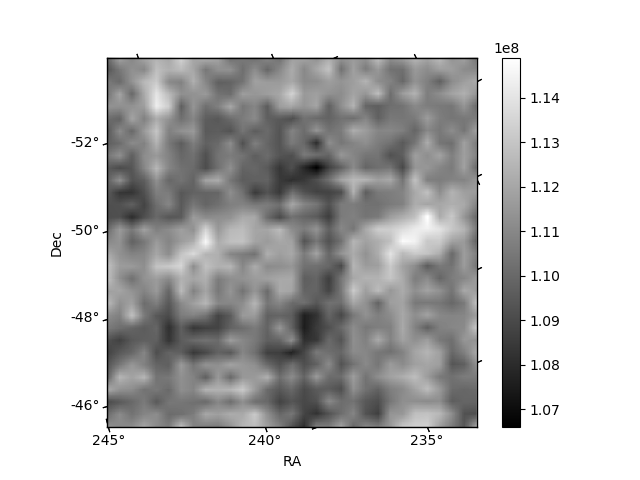
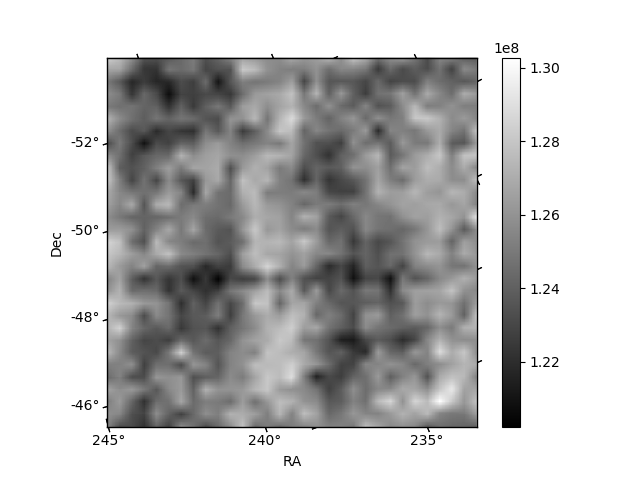
Histogram calculated using DETX and DETY for each event in the final _common_clean file
| Quadrant A | 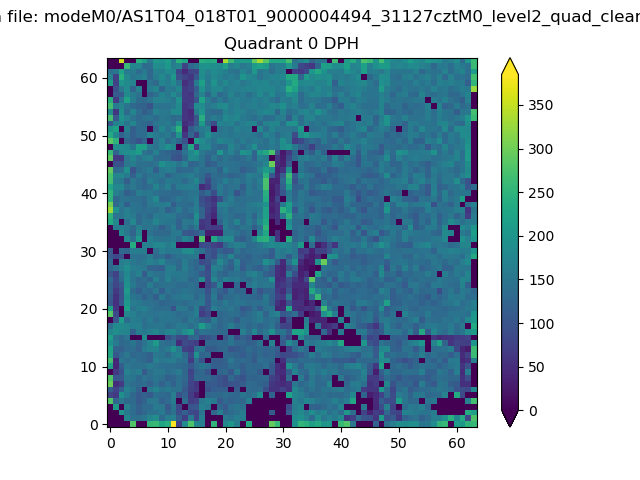 |
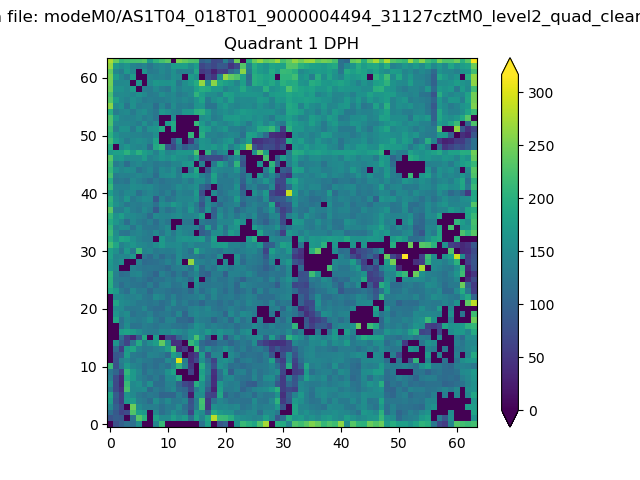 |
Quadrant B |
|---|---|---|---|
| Quadrant D | 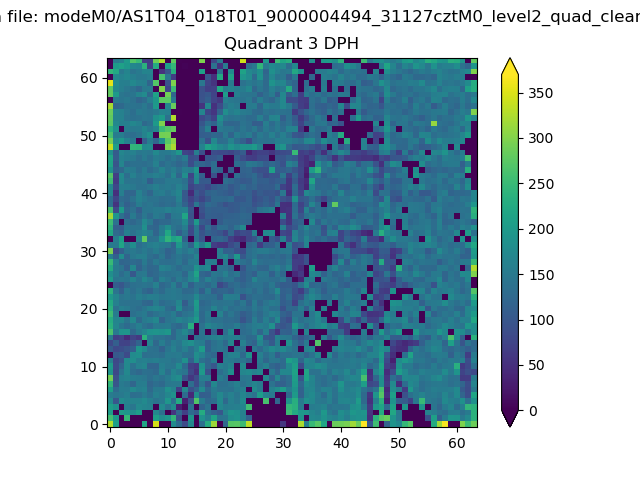 |
 |
Quadrant C |
| Plot type | Count rate plots | Images |
|---|---|---|
| Comparison with Poisson distribution Blue bars denote a histogram of data divided into 1 sec bins. Red curve is a Poisson curve with rate = median count rate of data. |
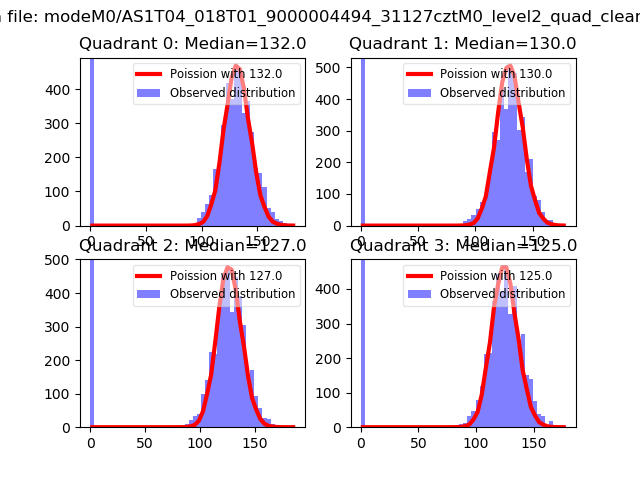 |
 |
| Quadrant-wise count rates Data is divided into 100 sec bins |
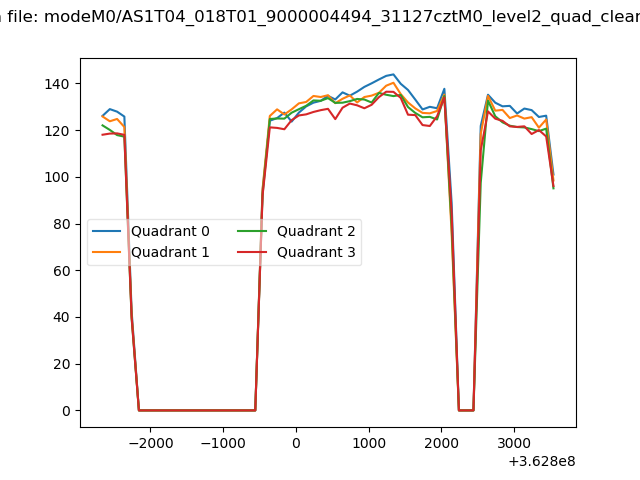 |
|
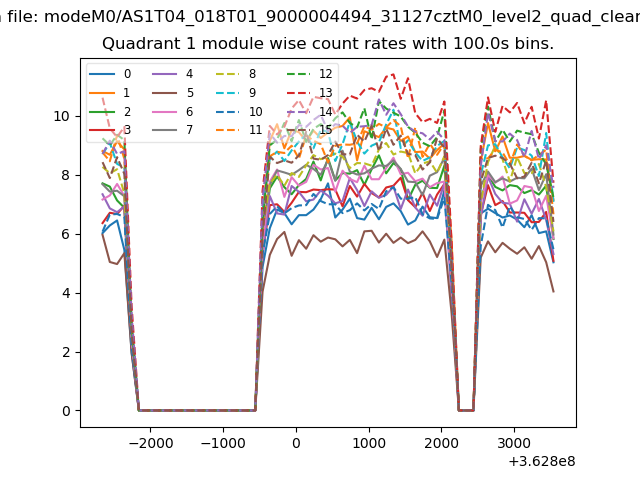
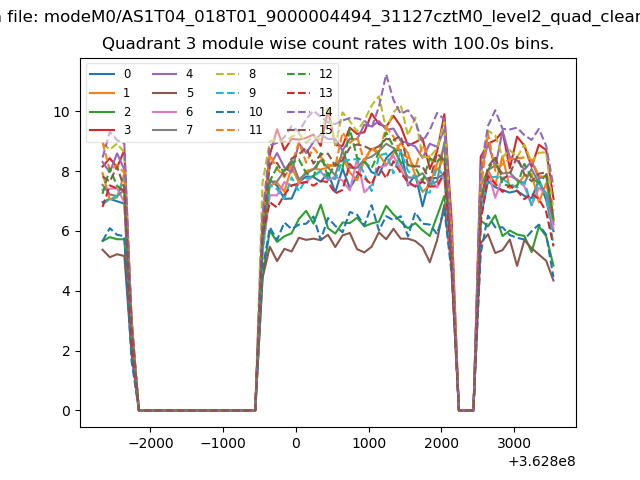
| Module-wise count rates for Quadrant A Data is divided into 100 sec bins |
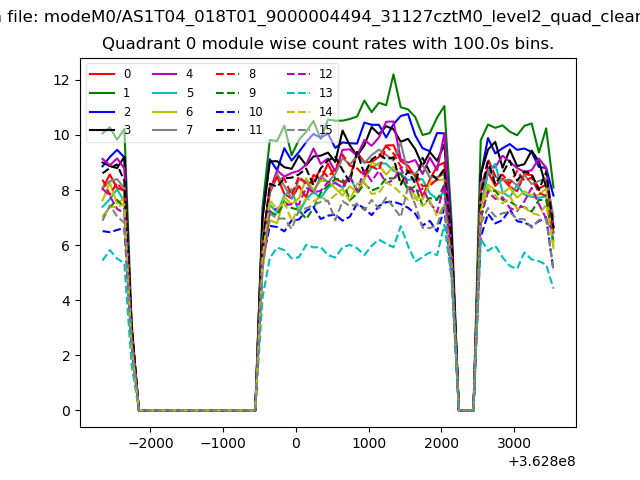 |
 |
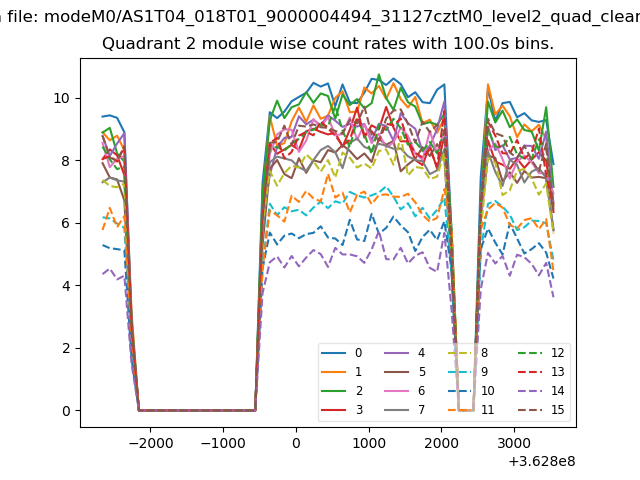
| Module-wise count rates for Quadrant B Data is divided into 100 sec bins |
 |
 |
| Module-wise count rates for Quadrant C Data is divided into 100 sec bins |
 |
 |
| Module-wise count rates for Quadrant D Data is divided into 100 sec bins |
 |
 |
| Parameter | Plot |
|---|---|
| CZT HV Monitor | 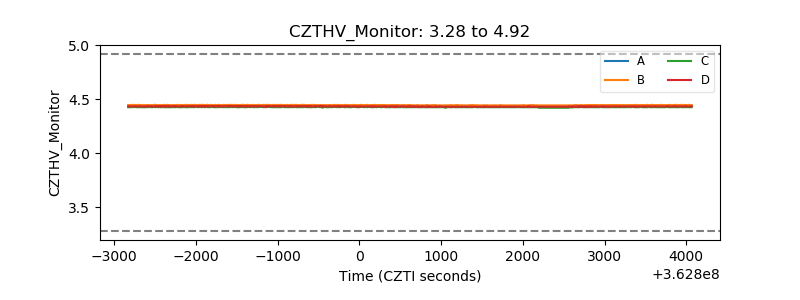 |
| D_VDD | 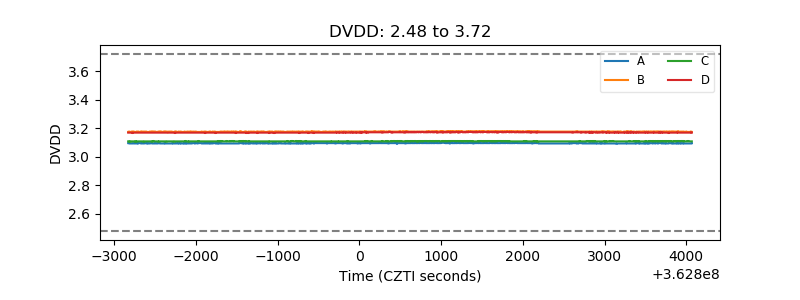 |
| Temperature 1 | 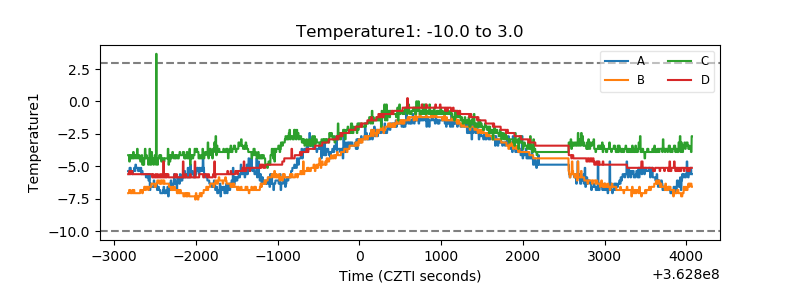 |
| Veto HV Monitor |  |
| Veto LLD | 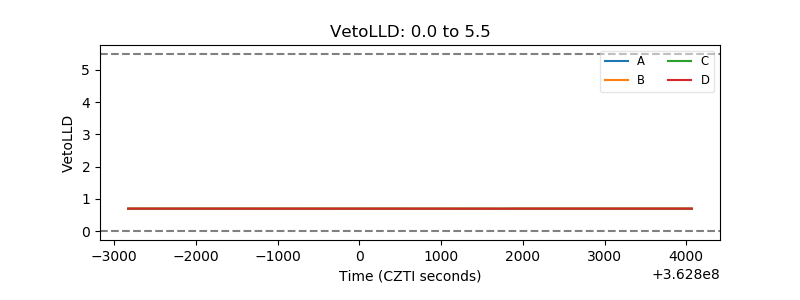 |
| Alpha Counter | 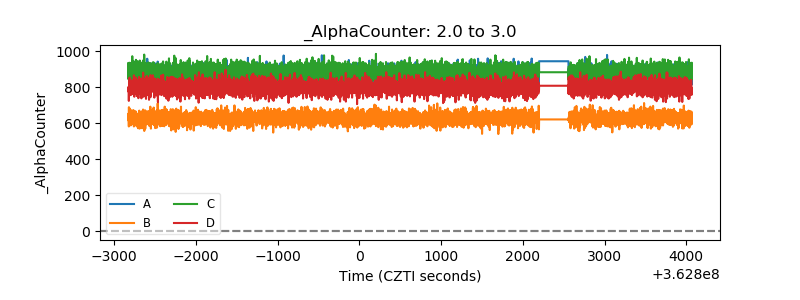 |
| _CPM_Rate | 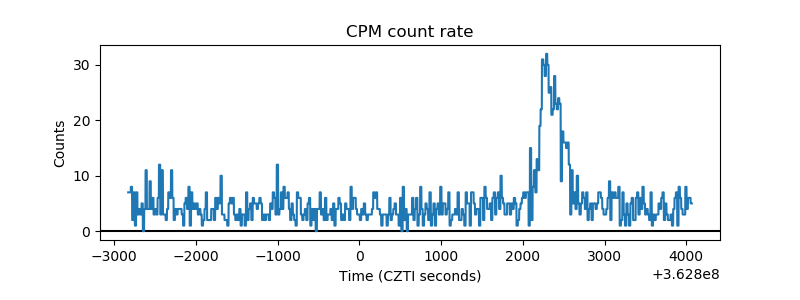 |
| CZT Counter | 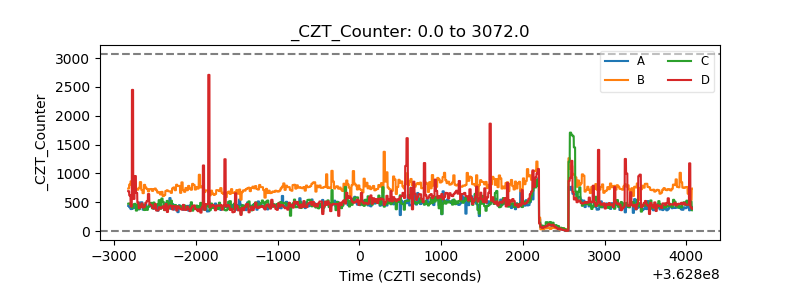 |
| +2.5 Volts monitor |  |
| +5 Volts monitor | 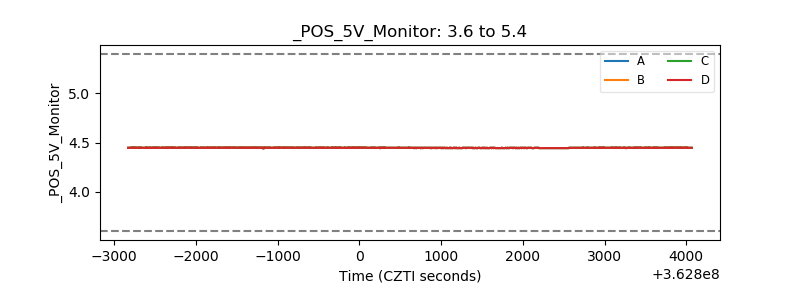 |
| _ROLL_ROT | 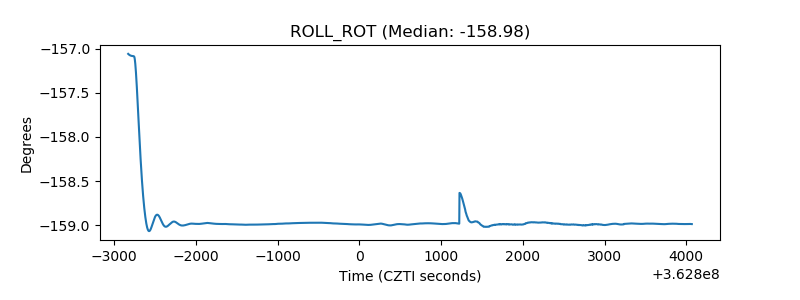 |
| _Roll_DEC | 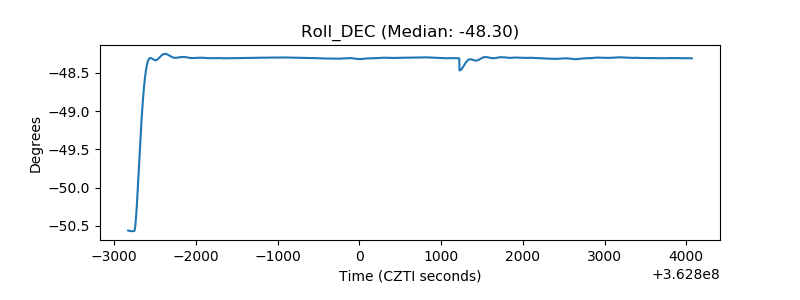 |
| _Roll_RA | 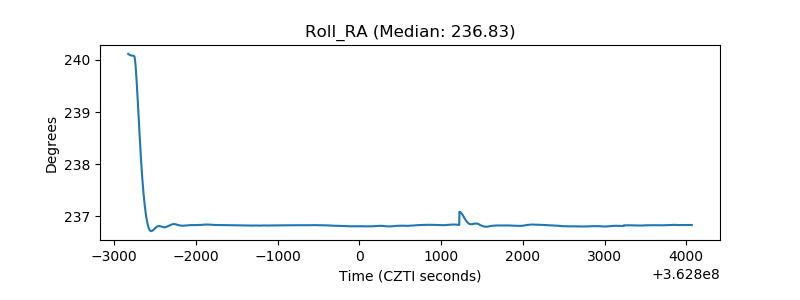 |
| Veto Counter |  |