| Param | Original file | Final file |
|---|---|---|
| Filename | modeM0/AS1T04_018T01_9000004494_31129cztM0_level2.evt | modeM0/AS1T04_018T01_9000004494_31129cztM0_level2_quad_clean.evt |
| Size (bytes) | 837,259,200 | 143,242,560 |
| Size | 798.5 MB | 136.6 MB |
| Events in quadrant A | 4,898,237 | 923,241 |
| Events in quadrant B | 8,338,220 | 907,470 |
| Events in quadrant C | 5,113,246 | 894,035 |
| Events in quadrant D | 6,284,278 | 873,270 |
| Mode M0 | |||
|---|---|---|---|
| Quadrant | BADHDUFLAG | Total packets | Discarded packets |
| A | 0 | 21623 | 1 |
| B | 0 | 32964 | 3 |
| C | 0 | 21929 | 1 |
| D | 0 | 25877 | 1 |
| Mode M9 | |||
|---|---|---|---|
| Quadrant | BADHDUFLAG | Total packets | Discarded packets |
| A | 0 | 5 | 0 |
| B | 0 | 5 | 0 |
| C | 0 | 5 | 0 |
| D | 0 | 5 | 0 |
| Mode SS | |||
|---|---|---|---|
| Quadrant | BADHDUFLAG | Total packets | Discarded packets |
| A | 0 | 216 | 0 |
| B | 0 | 216 | 0 |
| C | 0 | 216 | 0 |
| D | 0 | 216 | 0 |
| Quadrant | Total seconds | Saturated seconds | Saturation percentage |
|---|---|---|---|
| A | 10688 | 42 | 0.392964% |
| B | 10687 | 156 | 1.459717% |
| C | 10687 | 121 | 1.132217% |
| D | 10687 | 127 | 1.188360% |
Noise dominated data is calculated using 1-second bins in cleaned event files. If a bin has >2000 counts, and if more than 50% of those come from <1% of pixels, then it is considered to be noise-dominated and hence unusable.
| Quadrant | # 1 sec bins | Bins with >0 counts | Bins with >2000 counts | High rate bins dominated by noise | Noise dominated (total time) | Noise dominated (detector-on time) | Marked lightcurve |
|---|---|---|---|---|---|---|---|
| A | 11213 | 10689 | 1 | 1 | 0.01% | 0.01% | 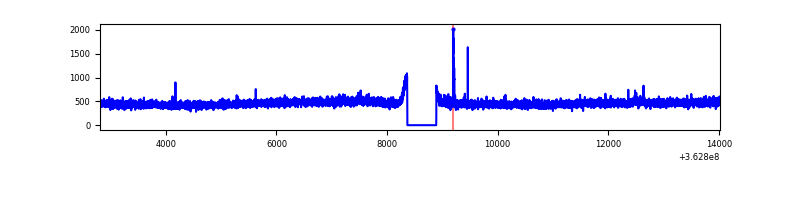 |
| B | 11212 | 10688 | 38 | 38 | 0.34% | 0.36% | 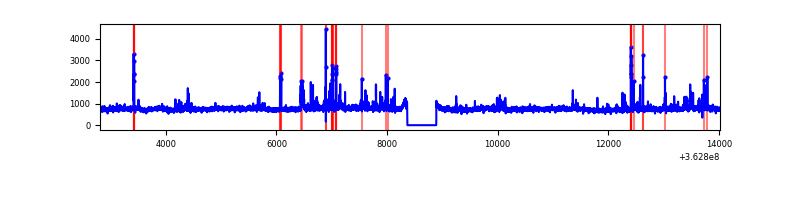 |
| C | 11212 | 10688 | 9 | 9 | 0.08% | 0.08% | 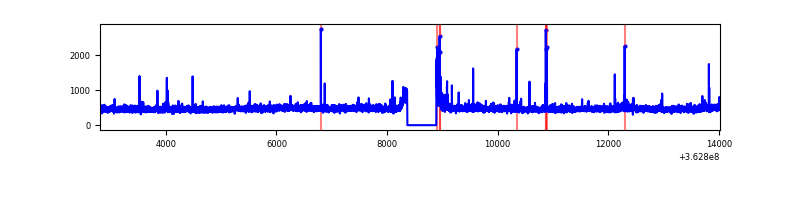 |
| D | 11212 | 10688 | 62 | 62 | 0.55% | 0.58% | 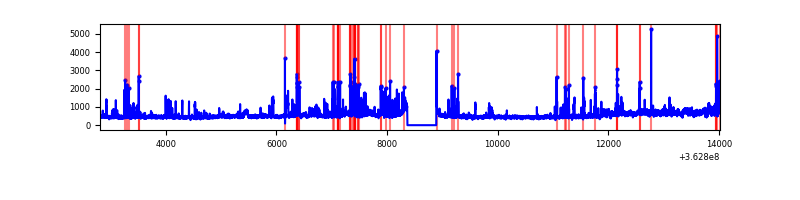 |
Top three noisy pixels from each quadrant. If the there are fewer than three noisy pixels in the level2.evt file, extra rows are filled as -1
| Pixel properties | Quadrant properties | ||||||
|---|---|---|---|---|---|---|---|
| Quadrant | DetID | PixID | Counts | Sigma | Mean | Median | Sigma |
| A | 12 | 96 | 24220 | 91.19 | 1263 | 1237 | 252.0 |
| A | 13 | 254 | 19548 | 72.65 | 1263 | 1237 | 252.0 |
| A | 3 | 137 | 12778 | 45.79 | 1263 | 1237 | 252.0 |
| B | 6 | 159 | 2961607 | 12479.32 | 1246 | 1215 | 237.2 |
| B | 0 | 190 | 98392 | 409.64 | 1246 | 1215 | 237.2 |
| B | 0 | 183 | 95073 | 395.65 | 1246 | 1215 | 237.2 |
| C | 14 | 238 | 195124 | 687.25 | 1210 | 1213 | 282.2 |
| C | 0 | 10 | 155197 | 545.75 | 1210 | 1213 | 282.2 |
| C | 2 | 114 | 24118 | 81.18 | 1210 | 1213 | 282.2 |
| D | 8 | 195 | 1150585 | 3980.7 | 1218 | 1183 | 288.7 |
| D | 2 | 250 | 152373 | 523.61 | 1218 | 1183 | 288.7 |
| D | 12 | 218 | 123276 | 422.84 | 1218 | 1183 | 288.7 |
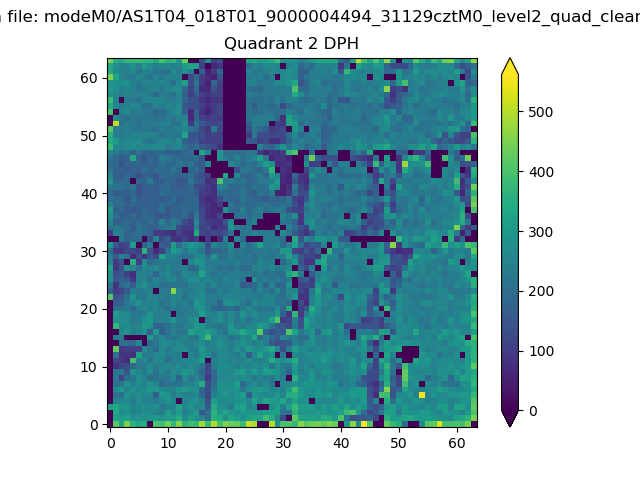
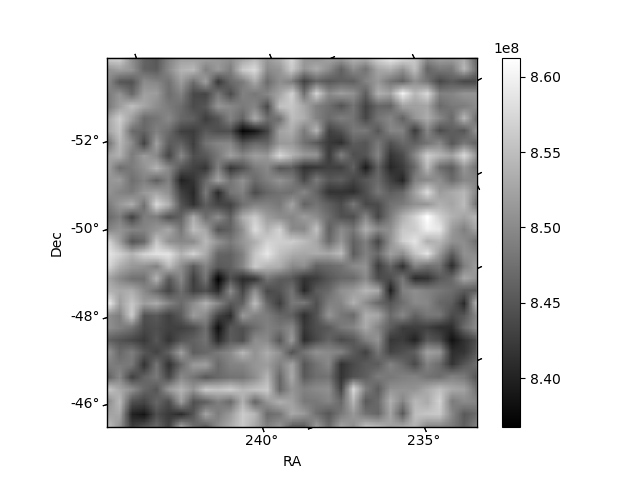
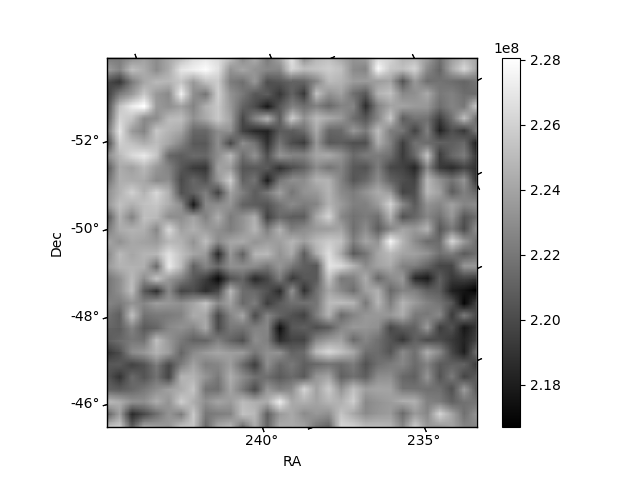
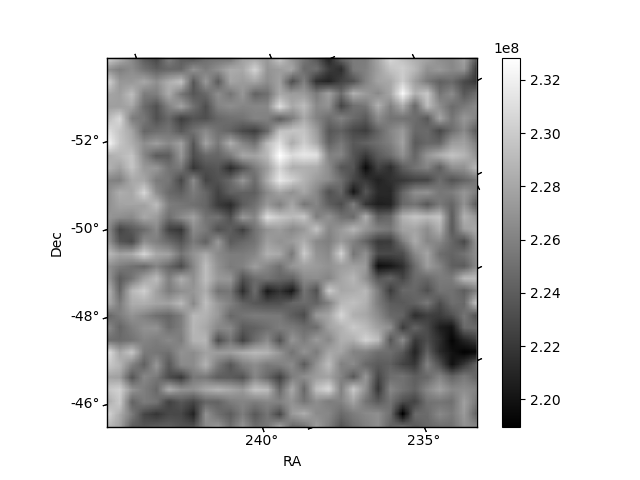
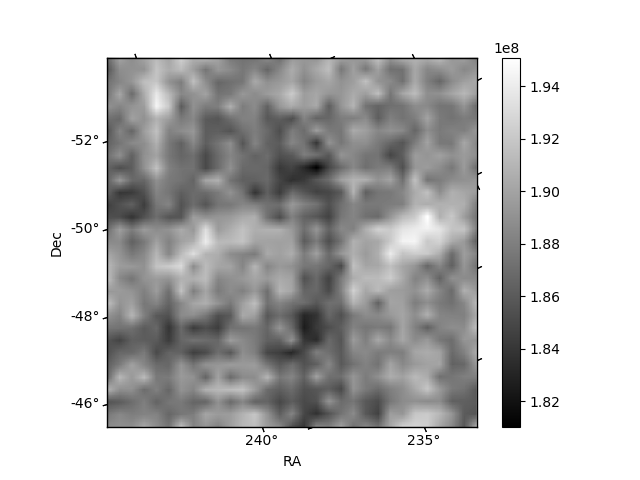
Histogram calculated using DETX and DETY for each event in the final _common_clean file
| Quadrant A | 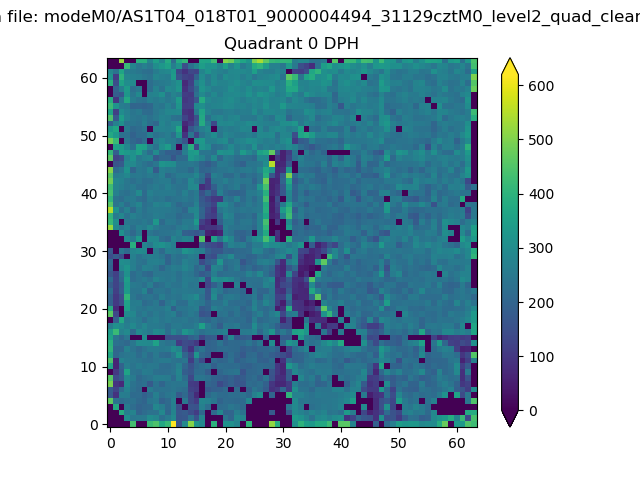 |
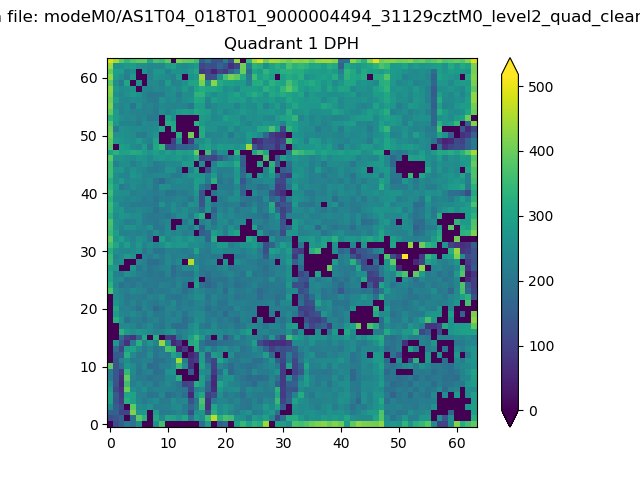 |
Quadrant B |
|---|---|---|---|
| Quadrant D | 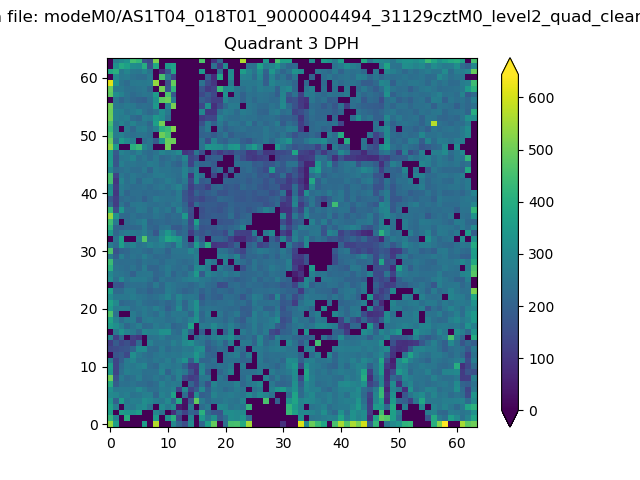 |
 |
Quadrant C |
| Plot type | Count rate plots | Images |
|---|---|---|
| Comparison with Poisson distribution Blue bars denote a histogram of data divided into 1 sec bins. Red curve is a Poisson curve with rate = median count rate of data. |
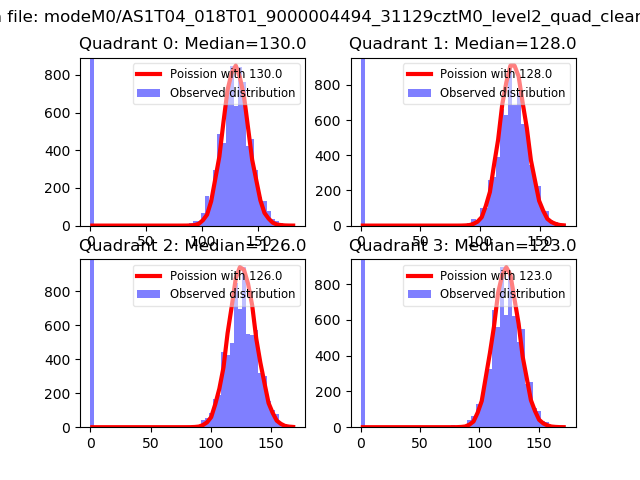 |
 |
| Quadrant-wise count rates Data is divided into 100 sec bins |
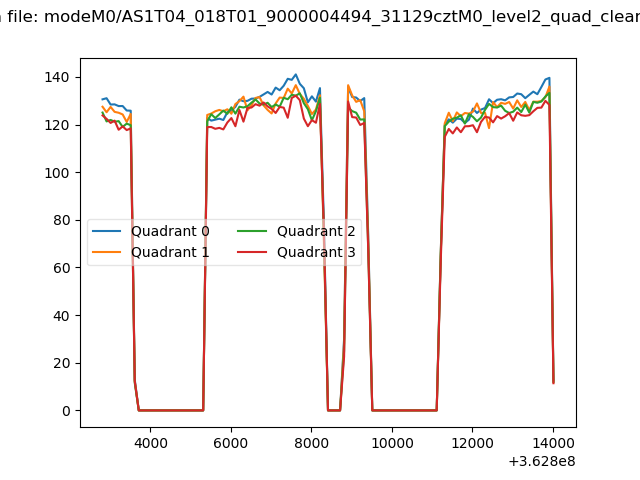 |
|
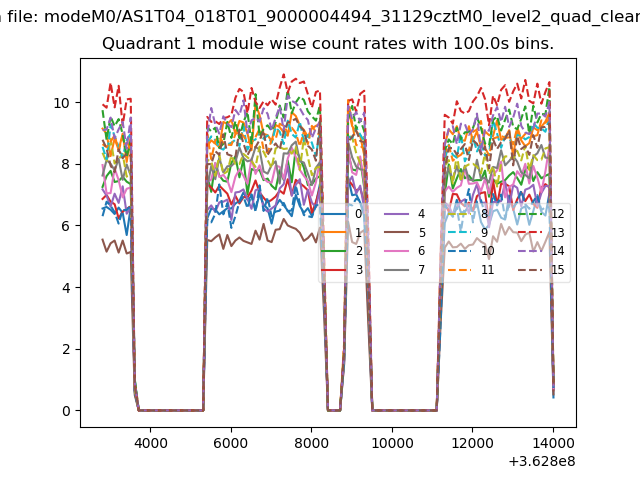
| Module-wise count rates for Quadrant A Data is divided into 100 sec bins |
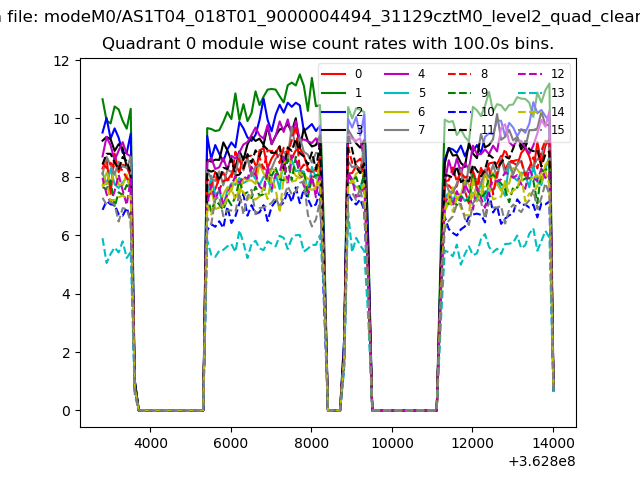 |
 |
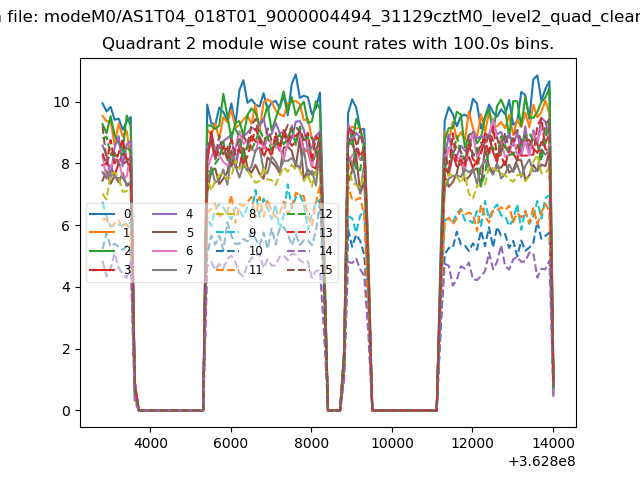
| Module-wise count rates for Quadrant B Data is divided into 100 sec bins |
 |
 |
| Module-wise count rates for Quadrant C Data is divided into 100 sec bins |
 |
 |
| Module-wise count rates for Quadrant D Data is divided into 100 sec bins |
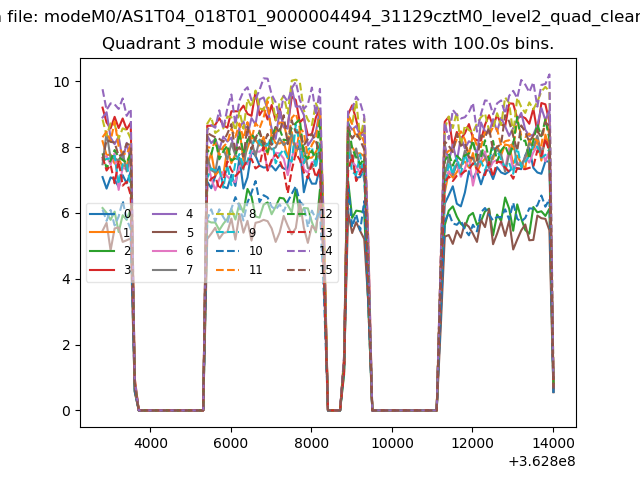 |
 |
| Parameter | Plot |
|---|---|
| CZT HV Monitor |  |
| D_VDD | 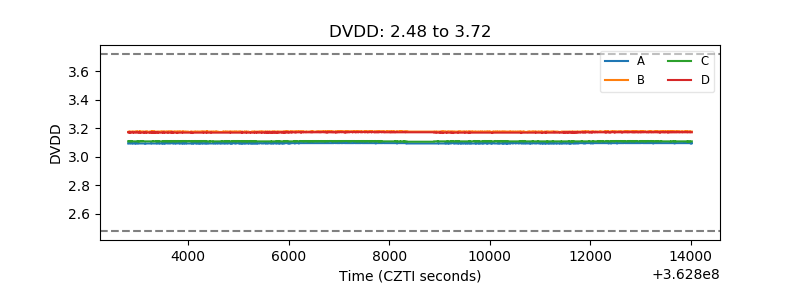 |
| Temperature 1 | 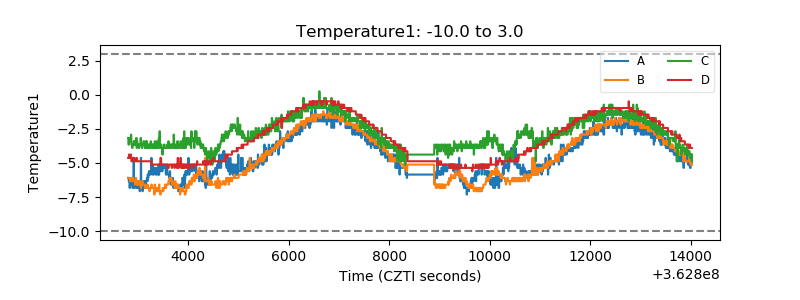 |
| Veto HV Monitor | 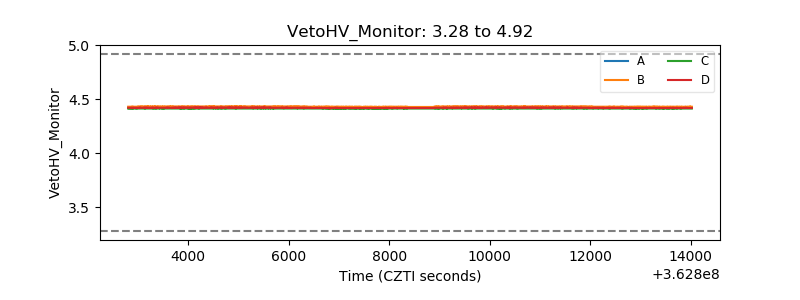 |
| Veto LLD | 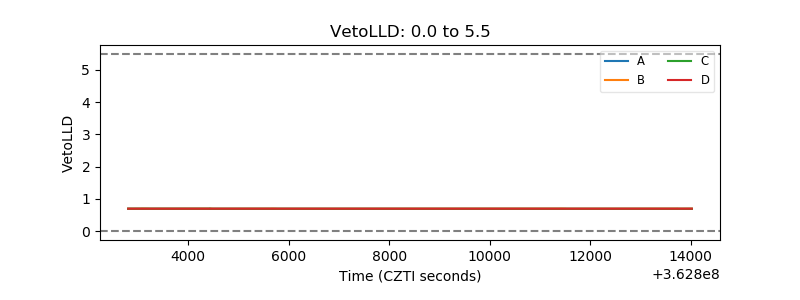 |
| Alpha Counter | 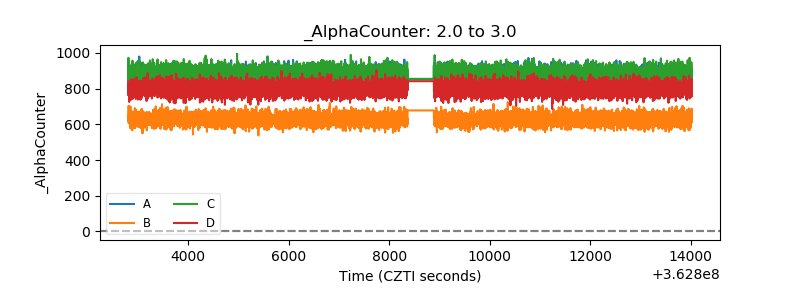 |
| _CPM_Rate | 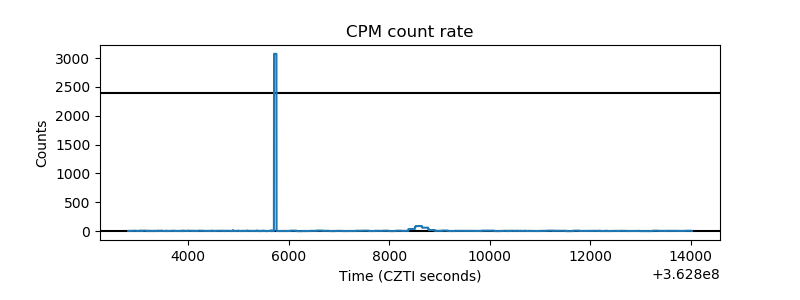 |
| CZT Counter | 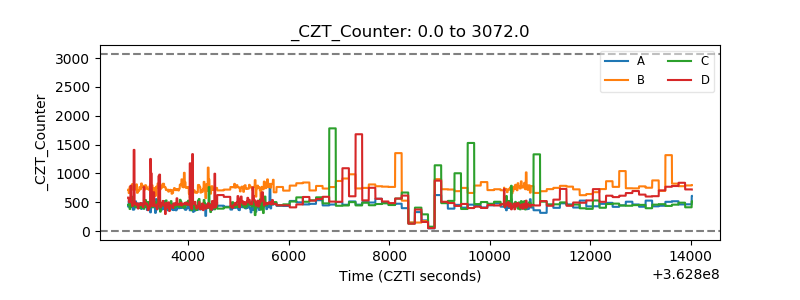 |
| +2.5 Volts monitor | 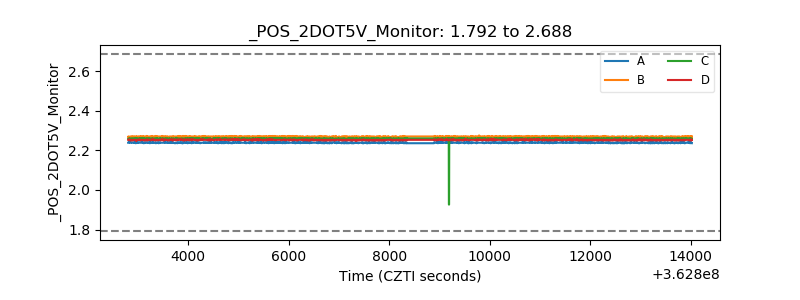 |
| +5 Volts monitor | 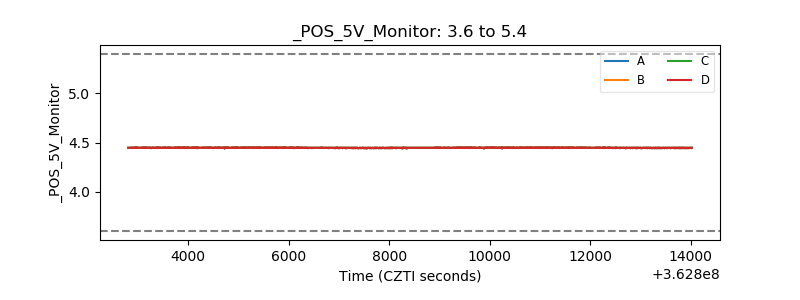 |
| _ROLL_ROT | 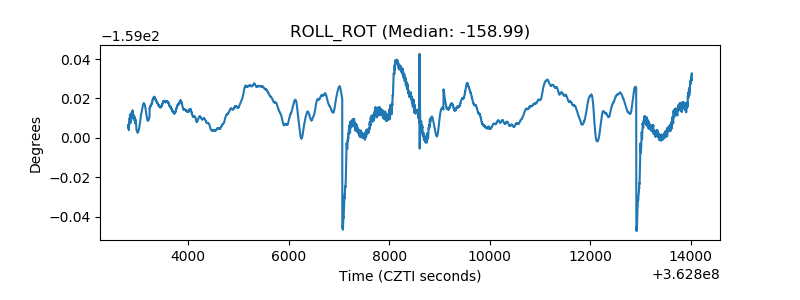 |
| _Roll_DEC | 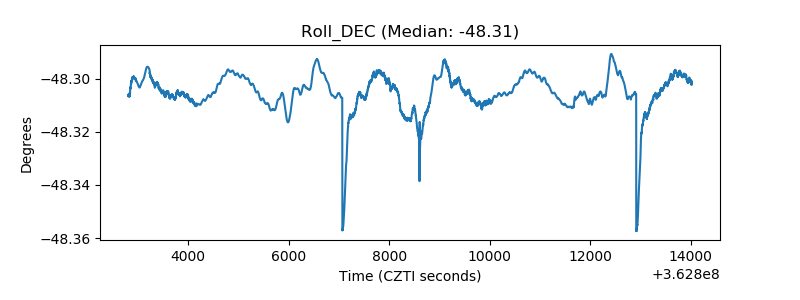 |
| _Roll_RA | 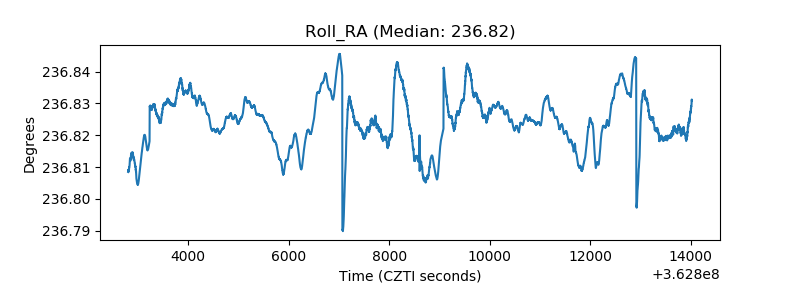 |
| Veto Counter | 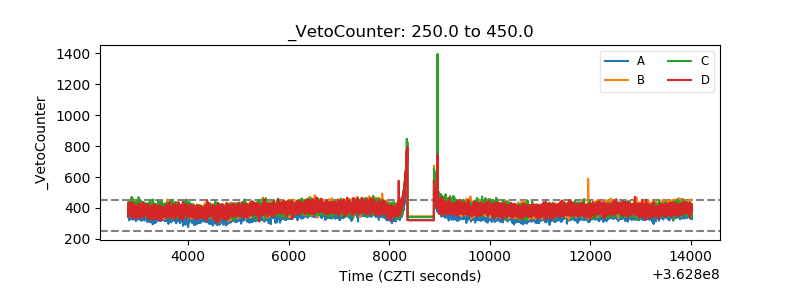 |